CUDA Debugger > How To > View Variables

NVIDIA Nsight supports the standard Visual Studio Locals window for examining the value of local variables in CUDA source code, and the Watch window for interactively evaluating expressions.

The information in the Locals window and Watch window are available in the CUDA Debugger only when:

To View the Value of a Local Variable:
  1. Start a debugging session.
    1. In Visual Studio, open a CUDA-based project.
    2. Define at least one breakpoint.
    3. From Nsight menu, choose Start CUDA Debugging. (Alternately, you can right-click on the project in Solution Explorer and choose Start CUDA Debugging.)
      Your applications starts and the CUDA Debugger launches, stopping at the first breakpoint encountered.
    4. Pause execution or allow the application to run to a breakpoint, or set a breakpoint if none enabled.
  2. From the Debug menu, choose Windows > Locals. The Locals window opens.

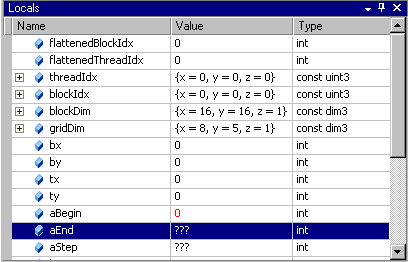
The Locals window shows the list of variables, their assigned values, and type in the current lexical scope.


Note: The block and thread indices are exposed in the blockDim and the threadIdx variables.


Note: Variables that have not yet been initialized show triple question marks as their value: ???


To Evaluate the Value of an Expression:
  1. From the Debug menu, choose Windows > Watch > Watch1 to open or focus the Watch window.
  2. Left-click on the expression portion of the window.
  3. Type any valid expression recognized by the debugger. The expression can contain any variable valid at the current execution location.
  4. Press the Enter key.
    The CUDA Debugger evaluates the expression displayed in the Name column, and places the result in the Value column.
    If the expression refers to a variable that is not valid at the current execution location, the expression value displays an error message.
    If the expression is a variable, you can edit the value in this column to change the contents of the variable. You cannot edit the value of const variables.The right column of the Watch window shows the value to which the expression evaluates.

Note: The CUDA Debugger supports a significant percentage of C++ expression syntax, including:
  • Bitwise and Logical Operators:&, |, ^, &&, ||, <<, >>
  • Arithmetic Operators:+, -, *, /
  • Pointer Arithmetic: For example: p+4, p[4]
  • Casting:(int *)p, (float4*)p, (__shared float4*)p


To Configure Formatting of Expressions:
  1. From the Nsight menu, choose Nsight Options.
  2. Select the Debugger group in the left pane of the Nsight Options window.
  3. Mark the options that you want to enable.

Options include: the Expand Pointers as Array option, and the Max Array Elements, which controls the maximum number of array elements shown for an array expression in the Watch window.


NVIDIA® Nsight™ Development Platform, Visual Studio Edition User Guide Rev. 3.2.131009 ©2009-2013. NVIDIA Corporation. All Rights Reserved.

of