Switches
With the NetQ UI and NetQ CLI, you can monitor the health of individual switches, including interface performance and resource utilization.
NetQ reports switch performance metrics for the following categories:
- System configuration: events, interfaces, IP and MAC addresses, VLANs, IP routes, IP neighbors, and installed software packages
- Utilization statistics: CPU, memory, disk, ACL and forwarding resources, SSD, BTRFS, and processes
- Physical sensing: digital optics and switch sensors
- RoCE and Precision Time Protocol
For switch inventory information (ASIC, platform, CPU, memory, disk, and OS), refer to Switch Inventory.
View Switch Metrics and Attributes
To view events, metrics, and attributes per switch, open the Switch card:
In the header, select
 Devices, then click Open a device card.
Select a switch from the list:
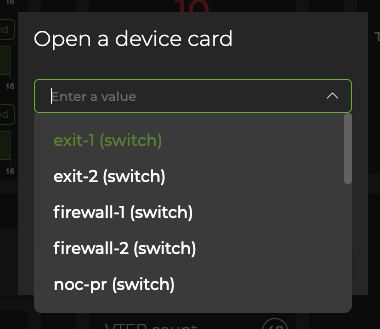
Click Add.
Adjust the card’s size to view information at different levels of granularity.
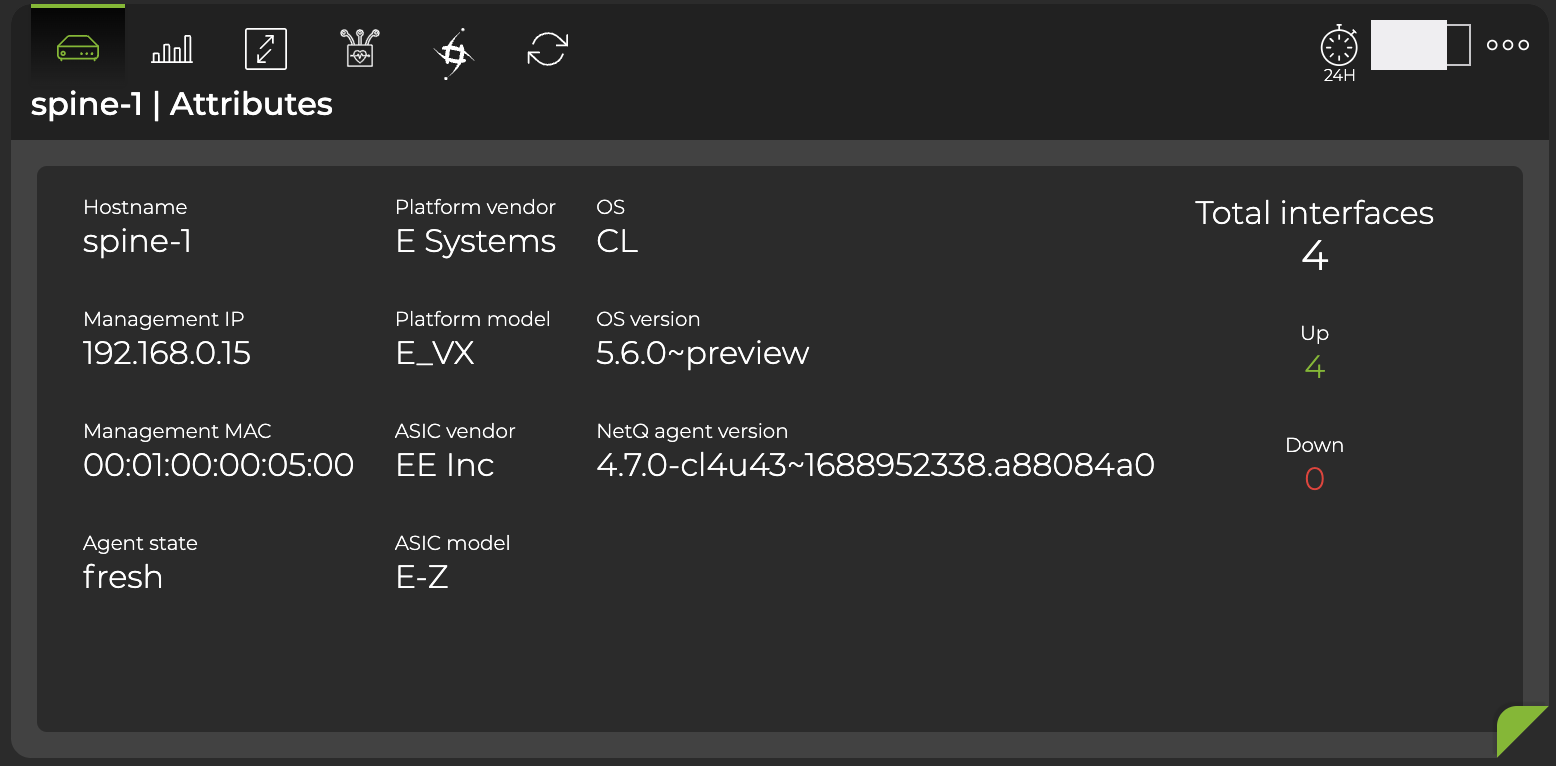
Attributes are displayed as the default tab on the large Switch card. You can view the static information about the switch, including its hostname, addresses, server and ASIC vendors and models, OS and NetQ software information. You can also view the state of the interfaces and NetQ Agent on the switch.
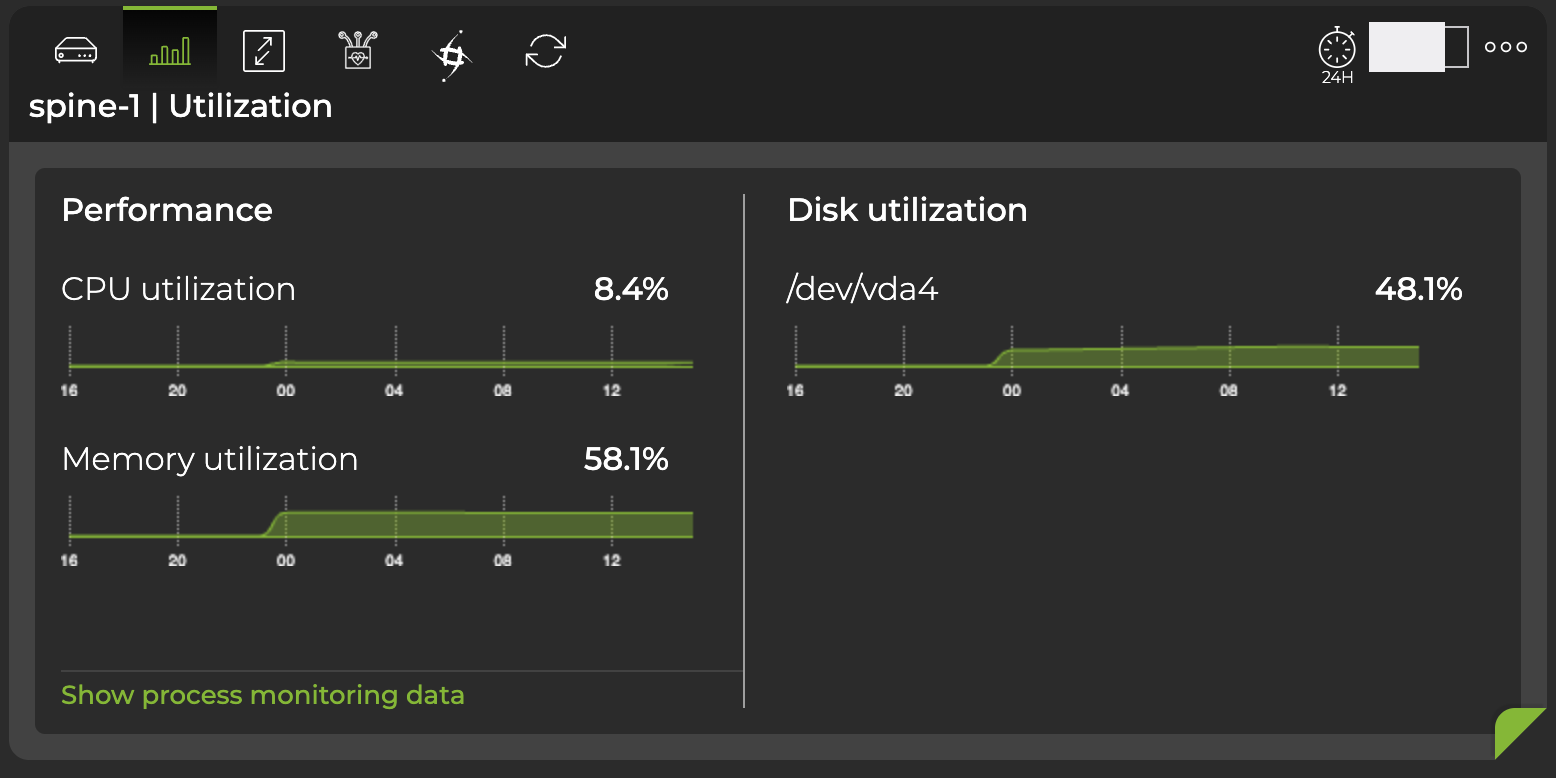
Hover over the top of the card and select the appropriate icon to view utilization info, interface statistics, digital optics info, RoCE metrics, and PTP clock graphs. This example displays utilization information, including CPU, memory, and disk utilization from the past 24 hours:
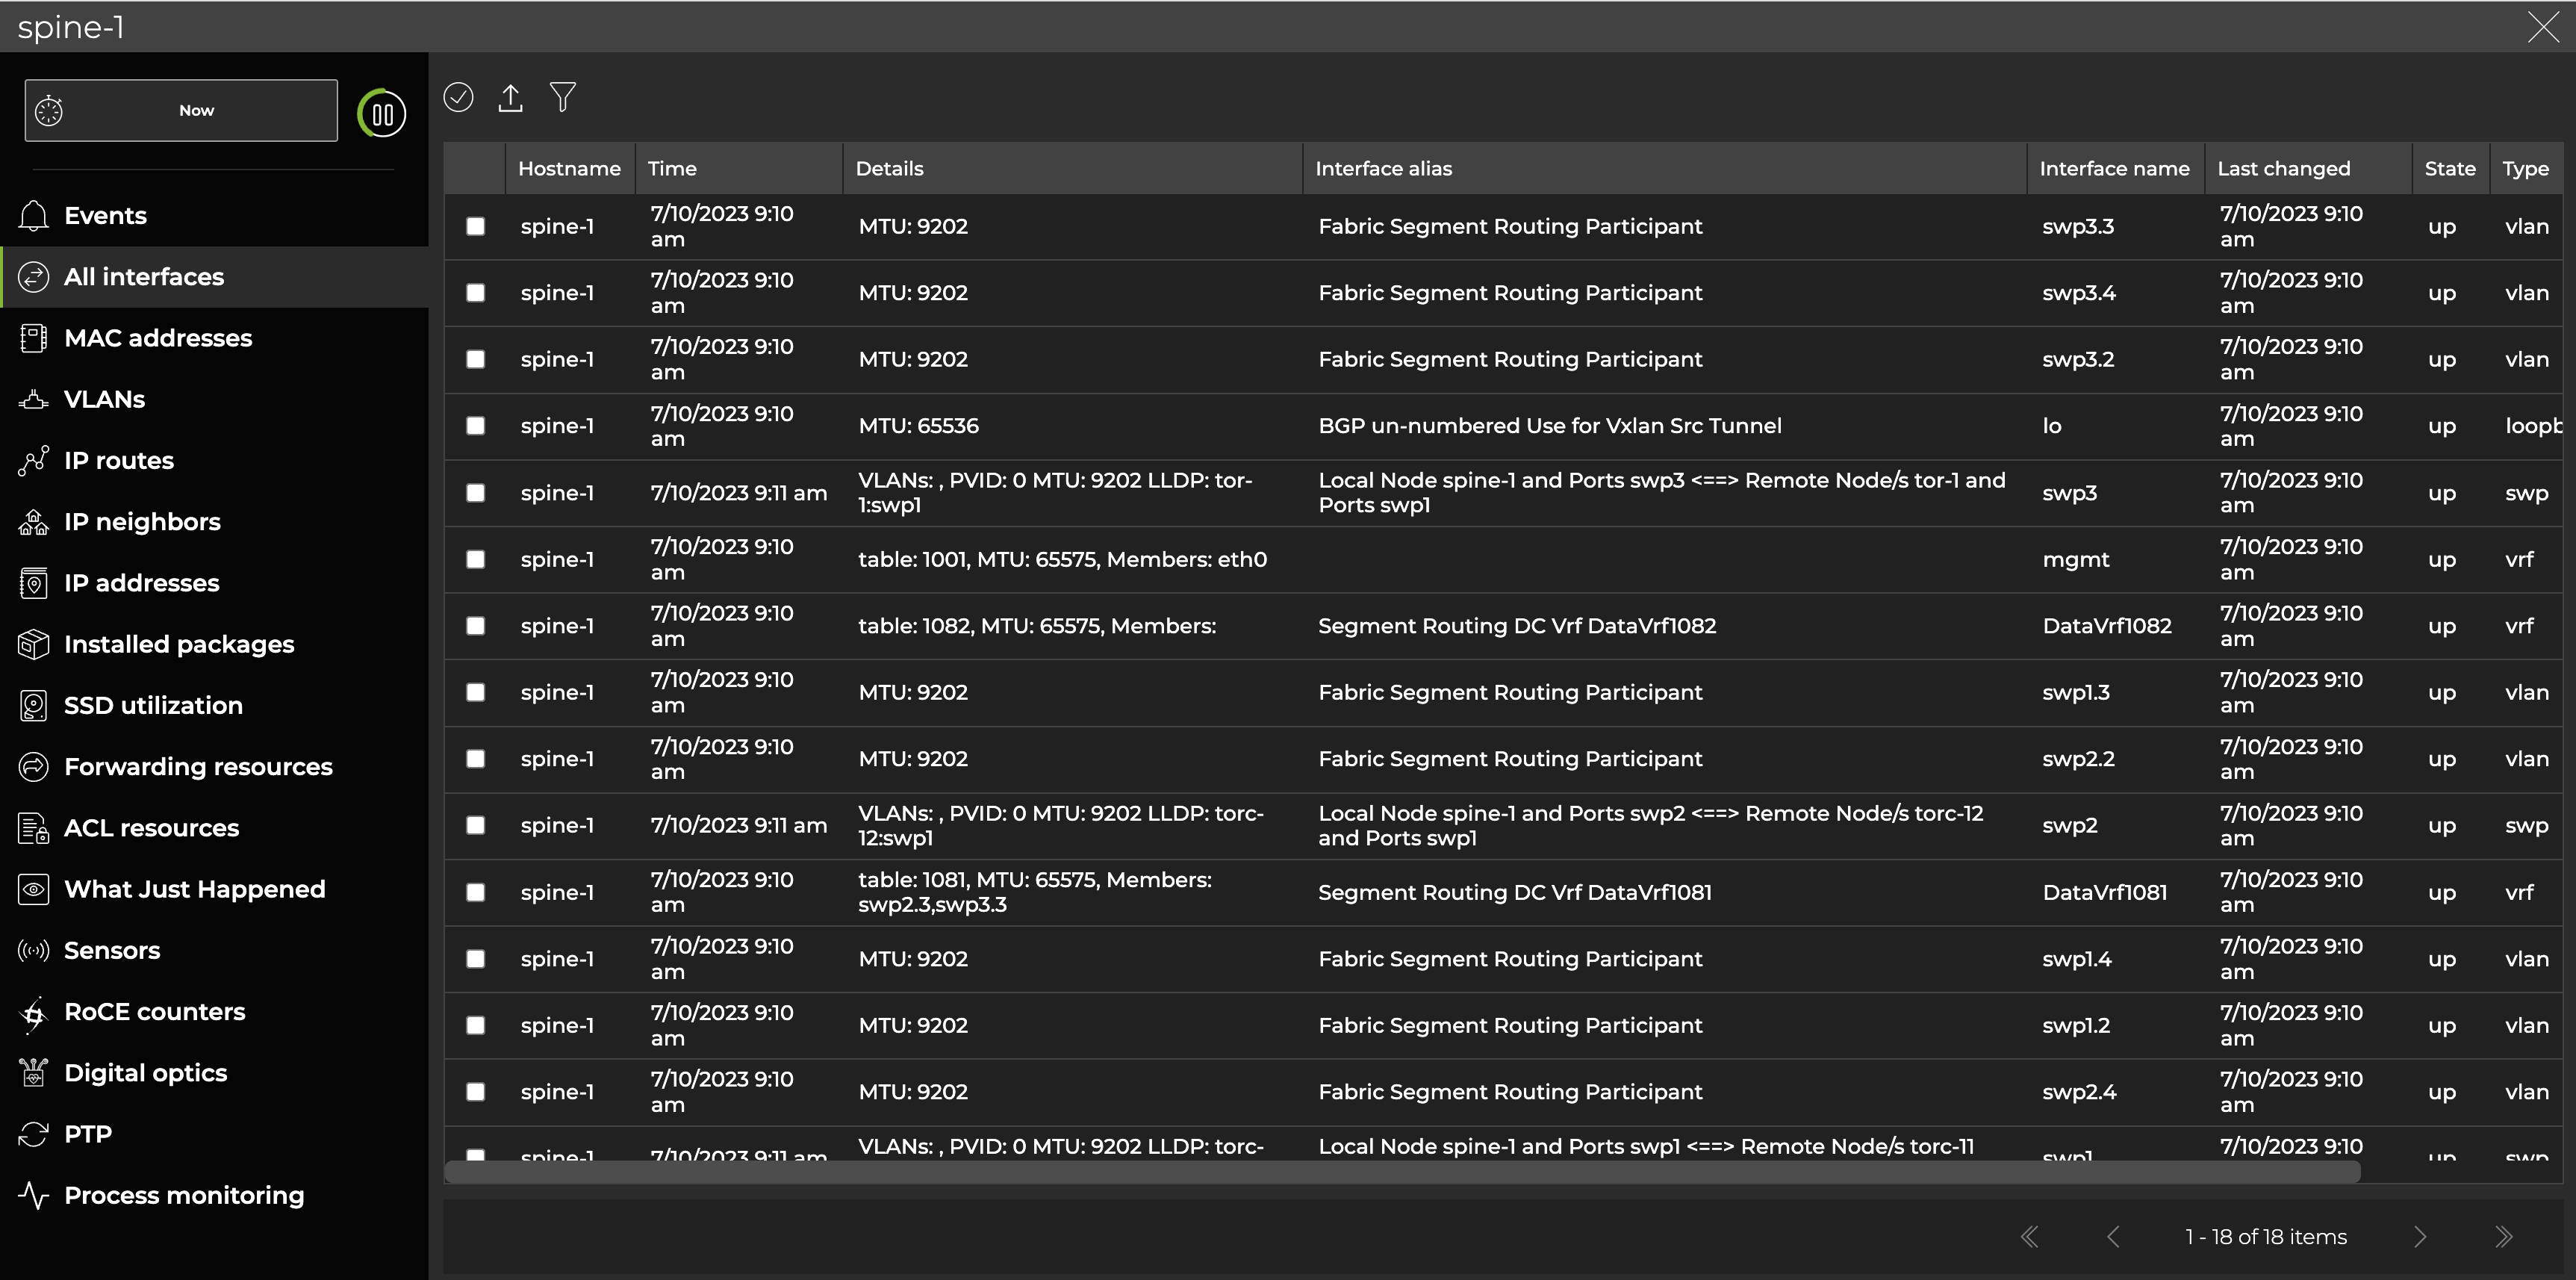
Expand the Switch card to full-screen to view, filter, or export information about events, interfaces, MAC addresses, VLANs, IP routes, IP neighbors, IP addresses, BTRFS utilization, software packages, SSD utilization, forwarding resources, ACL resources, What Just Happened events, sensors, RoCE counters, digital optics, PTP, and process monitoring:
The information available in the UI can also be displayed via the CLI with a corresponding netq show command. Each command that begins with netq show includes the option <hostname>. When the <hostname> option is included in the command, the output displays results limited to the switch or host you specified.
For example, you can view all events across your network with the netq show events command. To view all events on a particular switch, specify its name in the <hostname> field in netq <hostname> show events. The following example displays all events on the leaf01 switch:
cumulus@switch:~$ netq leaf01 show events

Matching events records:
Hostname          Message Type             Severity         Message                             Timestamp
----------------- ------------------------ ---------------- ----------------------------------- -------------------------
leaf01            btrfsinfo                error            data storage efficiency : space lef Wed Sep  2 20:34:31 2020
                                                            t after allocation greater than chu
                                                            nk size 0.57 GB
leaf01            btrfsinfo                error            data storage efficiency : space lef Wed Sep  2 20:04:30 2020
                                                            t after allocation greater than chu
                                                            nk size 0.57 GB
Refer to the command line reference for a comprehensive list of netq show commands.
View CPU and Memory Utilization for Processes and Services
Use the UI or CLI to visualize which services and processes are consuming the most CPU and memory on a switch. You can add or remove certain services that NetQ monitors using the CLI.
Process monitoring is only supported on Spectrum switches.
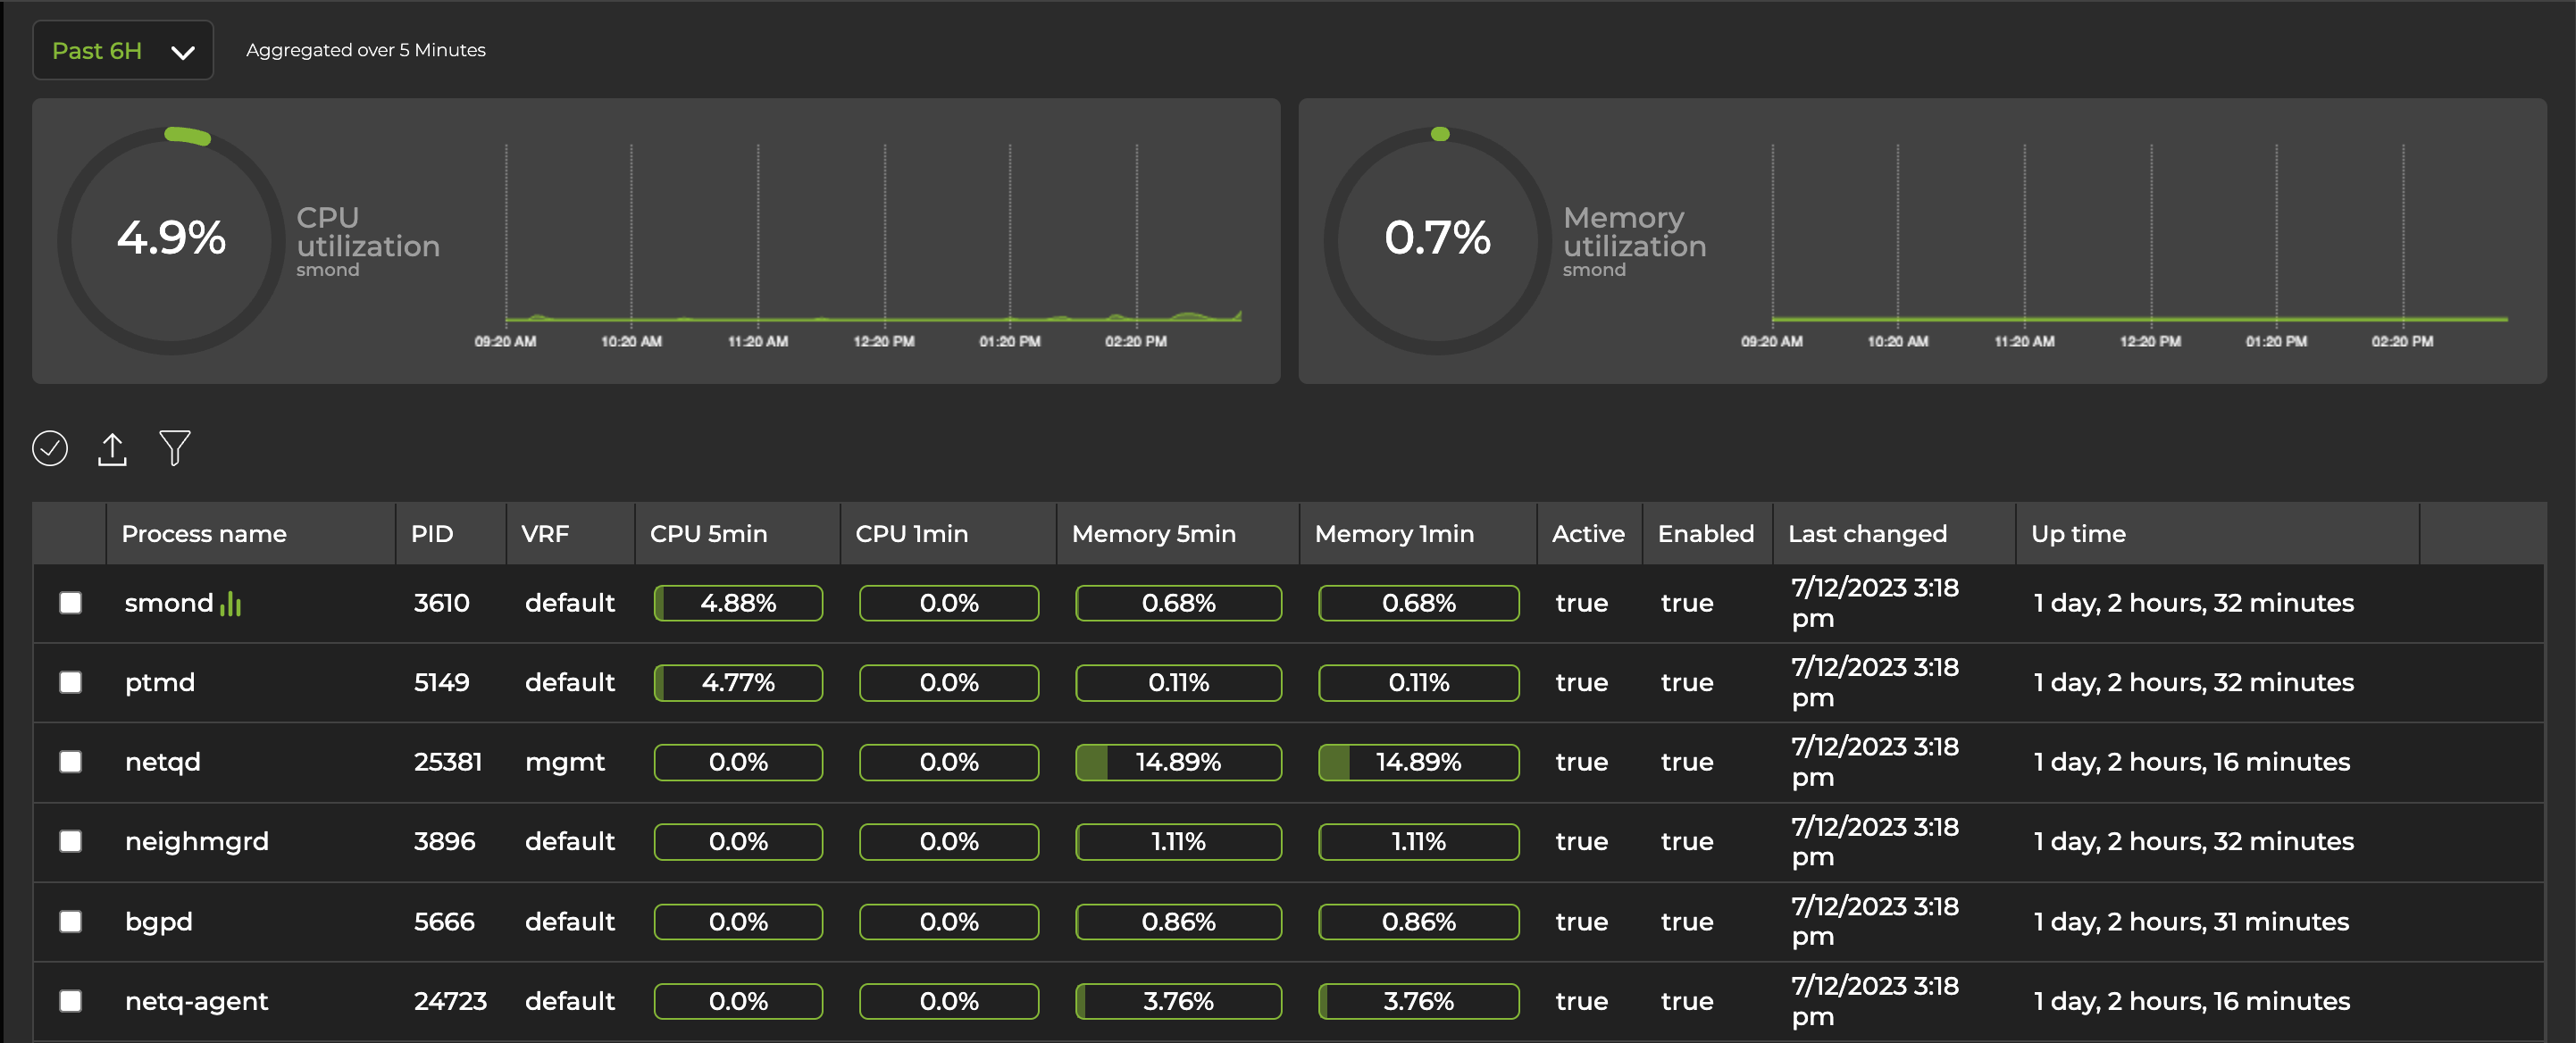
To visualize CPU and memory utilization at the process level, open a large device card and navigate to the Utilization tab. Then select Show process monitoring data. The UI depicts two charts—one each for CPU and memory utilization—along with a list of services and processes.
Select a process from the Process name column for its usage data to be reflected in the CPU and memory utilization charts. The data presented is aggregated over a 5-minute period; NetQ lists the process consuming the most CPU resources (aggregated over a 5-minute period or the CPU 5min column) from highest to lowest. The process whose data is reflected in the charts is indicated by an icon ![]() next to the name of the process.
next to the name of the process.
The following graphs depict CPU and memory usage over a 6-hour time period from the system monitor daemon, smond.
The information displayed in the UI can be viewed using the CLI with the netq show services resource-util command:
cumulus@switch:~$ netq show services resource-util

Matching services records:
Hostname          Service              PID   VRF                  Enabled Active Uptime               CPU one Minute       CPU five Minute      Memory one Minute    Memory five Minute   Last Updated
----------------- -------------------- ----- -------------------- ------- ------ -------------------- -------------------- -------------------- -------------------- -------------------- ------------------------
r-3700-02         sx_sdk               19012 default              yes     yes    81 day 17h ago       7.7                  24.65                9.44                 9.44                 Tue Jul 18 18:49:19 2023
r-3700-03         sx_sdk               13627 default              yes     yes    81 day 18h ago       0                    17.82                9.44                 9.44                 Tue Jul 18 18:49:19 2023
r-3700-02         switchd              21100 default              yes     yes    81 day 17h ago       56.77                15.07                1.13                 1.13                 Tue Jul 18 18:49:19 2023
r-3700-03         switchd              15768 default              yes     yes    81 day 18h ago       0                    8.28                 1.11                 1.11                 Tue Jul 18 18:49:19 2023
neo-switch02      sx_sdk               1841  default              yes     yes    2h 29min ago         30.1                 6.55                 9.67                 9.67                 Tue Jul 18 18:49:19 2023
ufm-switch19      sx_sdk               2343  default              yes     yes    21h 3min ago         5.22                 5.73                 2.84                 2.84                 Tue Jul 18 18:49:19 2023
ufm-switch29      sx_sdk               2135  default              yes     yes    8 day 4h ago         2.88                 5.73                 9.54                 9.54                 Tue Jul 18 18:49:19 2023
r-3420-01         sx_sdk               1885  default              yes     yes    9 day 3h ago         5.28                 5.01                 9.3                  9.3                  Tue Jul 18 18:49:19 2023
ufm-switch29      clagd                7095  default              no      yes    8 day 4h ago         23.57                4.71                 0.63                 0.63                 Tue Jul 18 18:49:19 2023
r-3700-01         smond                7301  default              yes     yes    9 day 3h ago         0                    4.7                  0.2                  0.2                  Tue Jul 18 18:49:19 2023
...
To configure the NetQ Agent to start monitoring additional services, run netq config add agent services, specifying the services you want the agent to monitor in the command. Restart the agent, then run netq config show agent services to display a list of services that the NetQ Agent is monitoring for CPU and memory usage.
To stop the agent from monitoring a service run netq config del agent services. Some services and processes cannot be excluded from monitoring.
To actively monitor process-level CPU and memory utilization, you can create threshold-crossing rules. These rules generate events when a process or service exceeds the utilization limit you defined when creating the rule. Refer to the resource utilization table in the TCA Events Reference for service memory and service CPU utilization event IDs.
View Queue Lengths in Histograms
Monitoring queue lengths in your network’s fabric is useful for detecting microbursts which can lead to higher packet latency or buffer congestion. The Cumulus Linux documentation provides a detailed description of ASIC monitoring, including example bin configurations and information on interpreting histogram queue lengths.
Queue length monitoring is supported on Spectrum switches running Cumulus Linux 5.1 and later. To display queue histogram data, you must set the snapshot file count to at least 120 when you are configuring ASIC monitoring, as described in the Snapshots section in the ASIC monitoring configuration documentation.
The information available in the UI can also be displayed via the CLI with the netq show histogram command. To view queue histograms in the UI:
- Expand the
 Menu. Under the traffic histograms section, select Queue histogram.
Devices are grouped according to their roles: superspine, leaf, spine, or exit. If you haven’t assigned roles to your devices, they appear as ‘unassigned.’
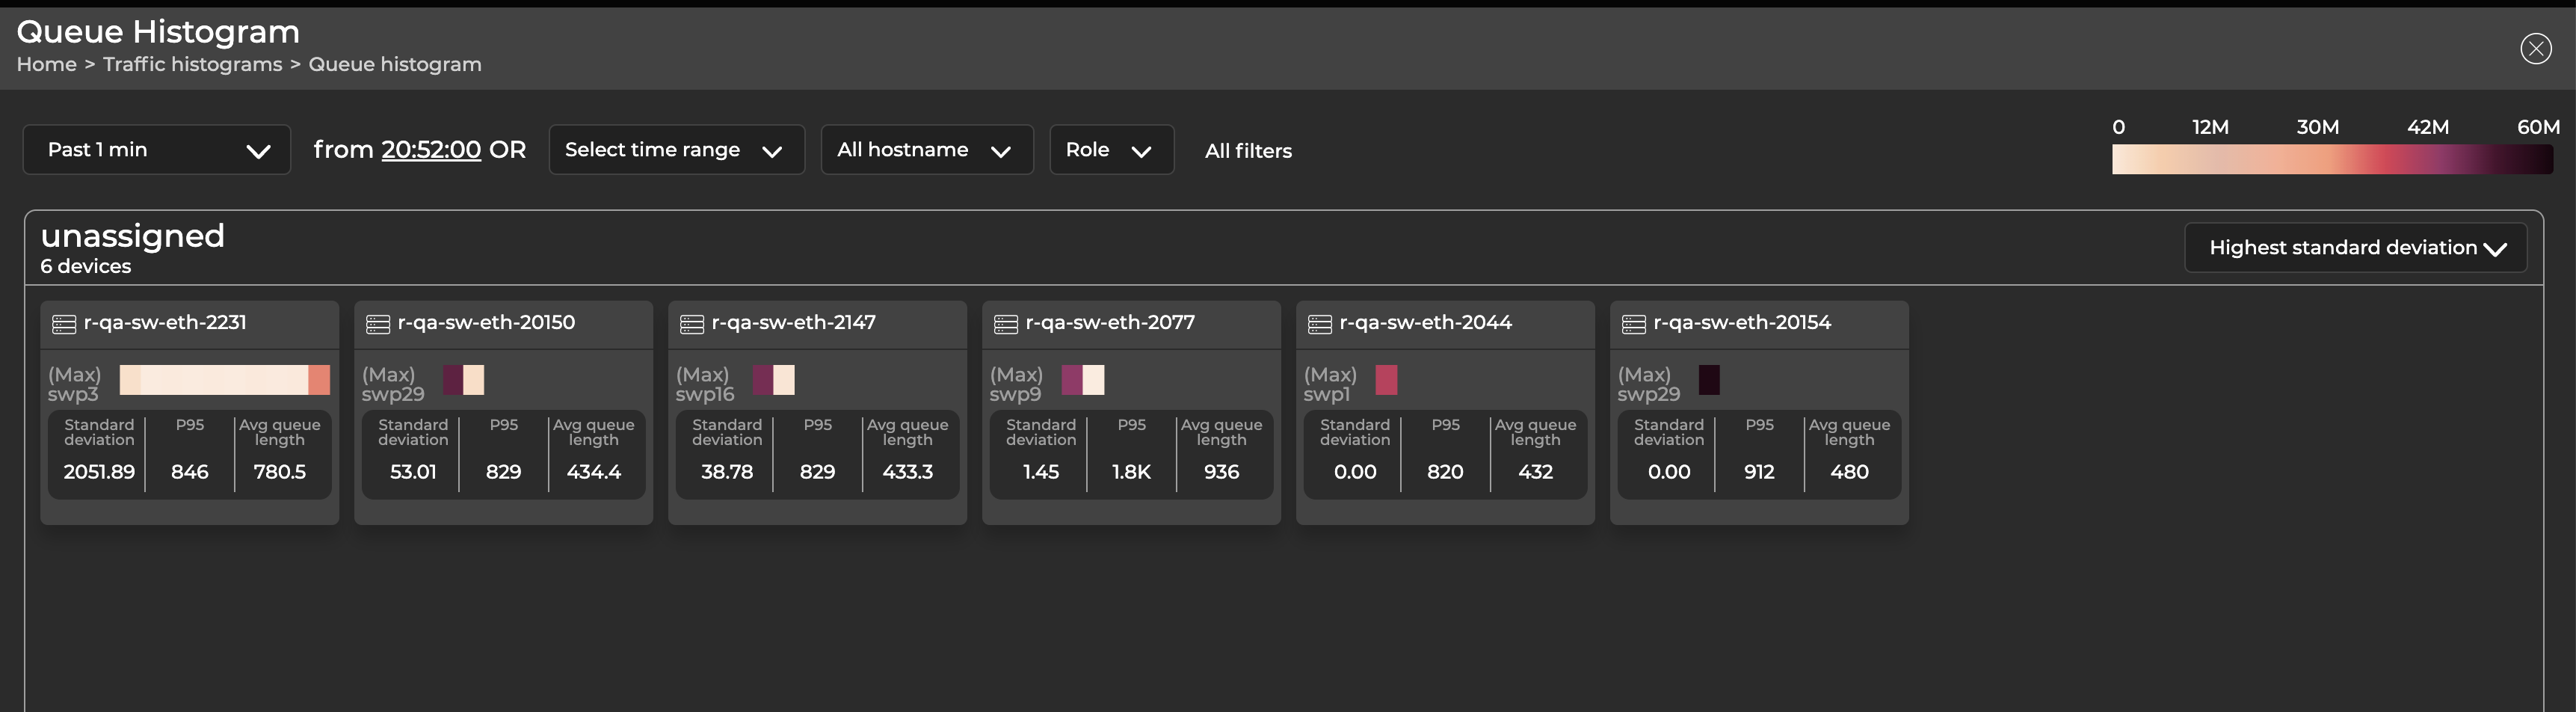
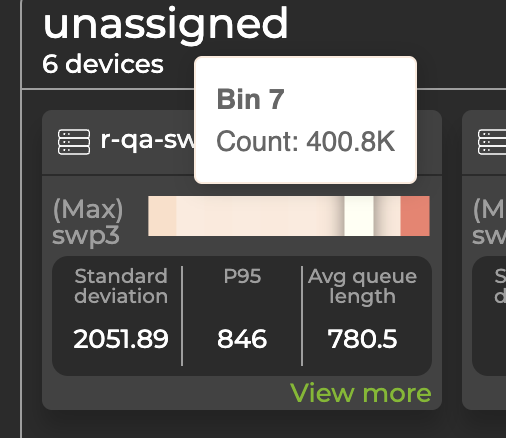
Each device is represented by a card that displays its hostname, the port with the longest queue length (displayed horizontally, divided into bins), standard deviation, P95 value across all ports (with an ASIC monitoring configuration), and average queue length. The data updates when you change the time parameters using the controls at the top of the screen. The values reflected in the bins are color-coded, with higher values displayed in darker colors and lower values in lighter colors. Hover over a bin to view its corresponding queue length count.
Select View more to open a dashboard that displays the full range of ports configured to send histogram data along with their associated devices, which are visible when you hover over a section with your cursor. From this view, you can compare devices against each other or the same devices over a different time period. For example, the following view displays switch r-qa-sw-eth-2231 with queue length data from the past minute in the top panel and the past 30 minutes in the bottom panel.
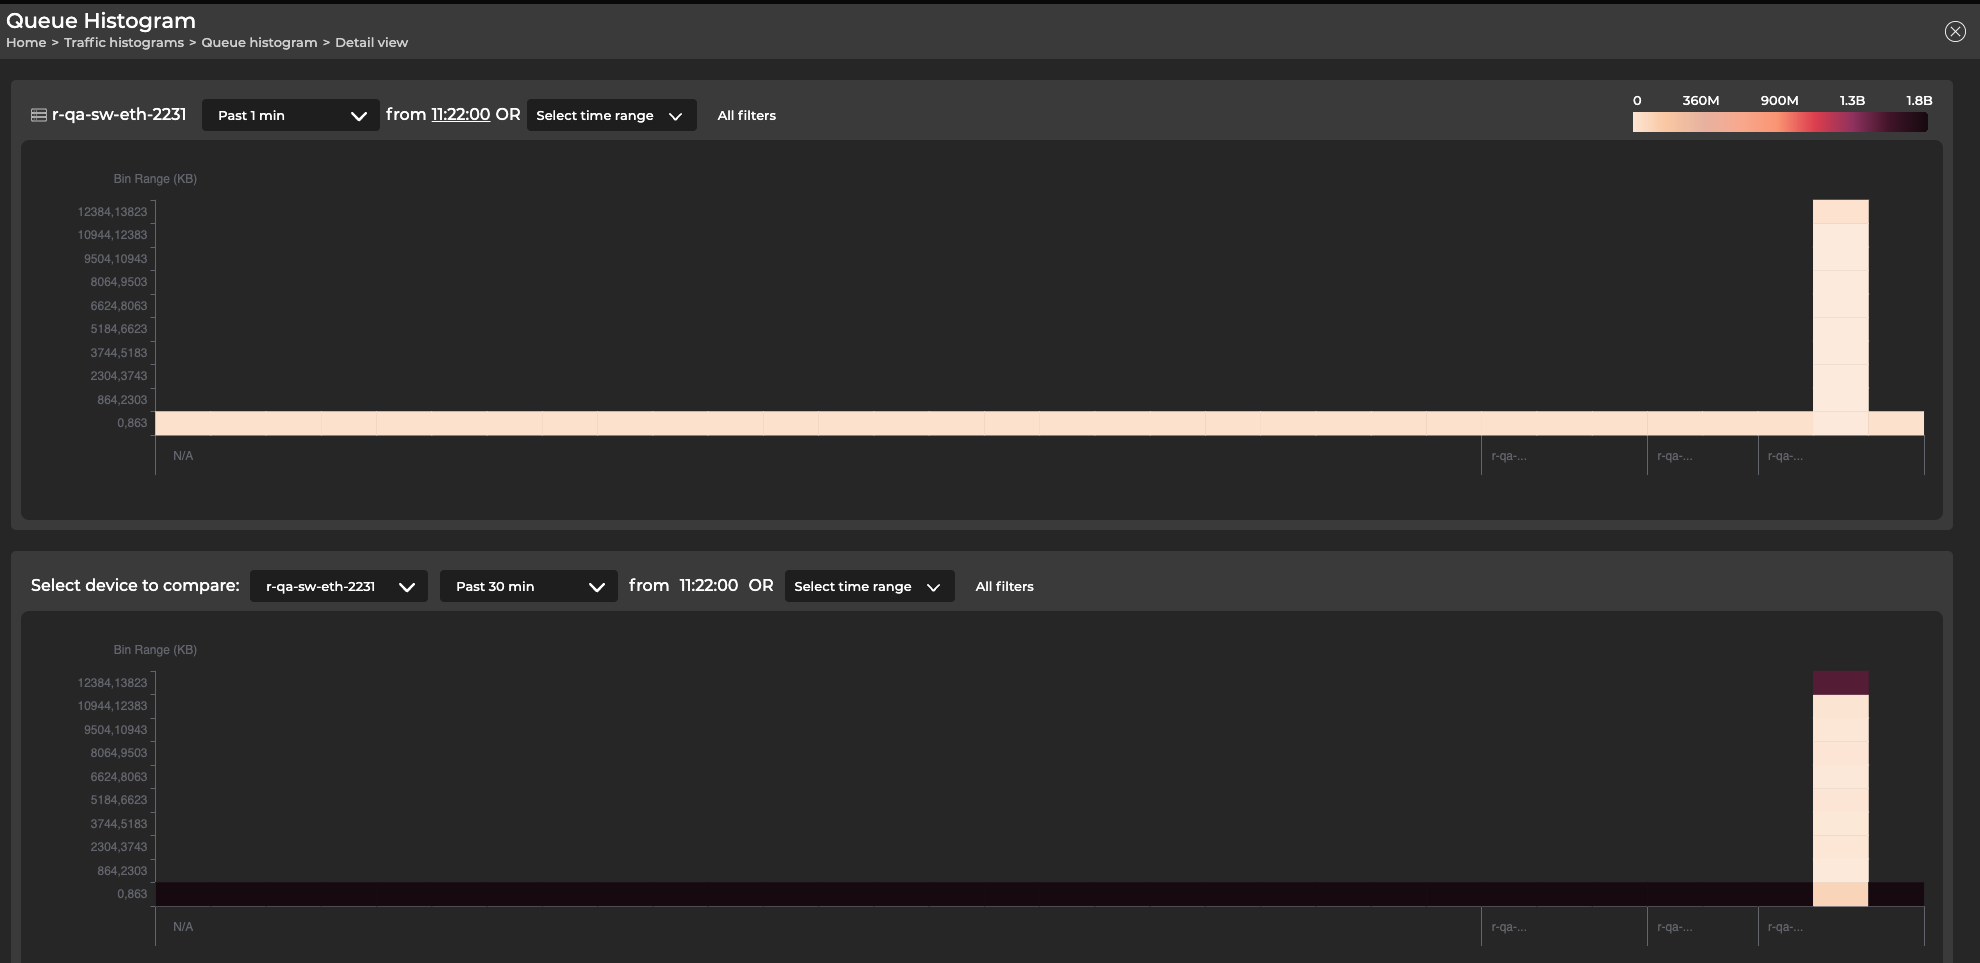
The y-axis represents bins 0 through 9. The hostname associated with the port is displayed on the x-axis.