Next Item Prediction
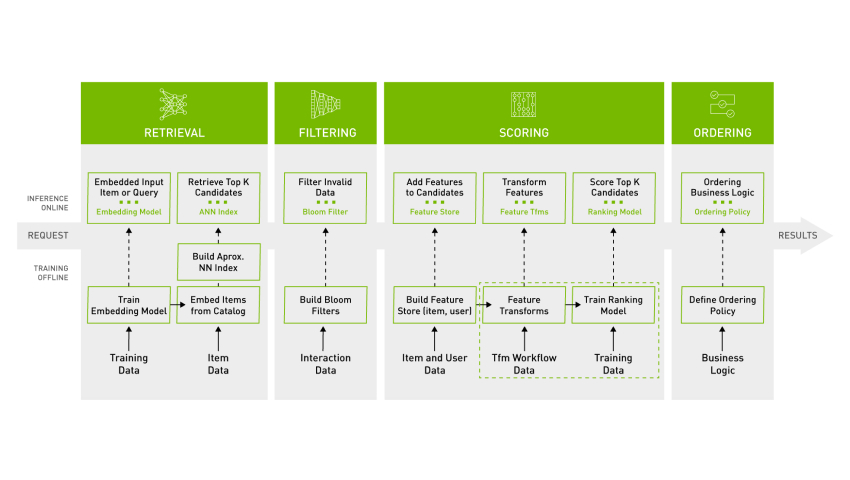
The Next Item Prediction workflow features an example opinionated integrated solution which illustrates how to leverage NVIDIA Merlin, an AI framework designed for recommender systems, to build models and pipelines for predicting next the items that a user may choose based on their historical browsing history. This can be used for an online ecommerce or retail use case, as one example.
This deployment guide will walk through the process of deploying a pre-customized solution, including information on the various components used, if further customization is required.
This example is only for reference and should not be used in production deployments. Production implementations of these workflows should be customized and integrated with your own Enterprise-grade infrastructure and software and should be deployed on platforms supported by NVIDIA AI Enterprise.
Each user is responsible for checking the content and the applicable licenses of third party software and determining if they are suitable for the intended use.
Since NVIDIA AI Workflows are available on NVIDIA NGC for NVIDIA AI Enterprise software customers, you must have access to the following in order to pull down the resources which are required for the workflow:
NVIDIA AI Enterprise licensing is required for accessing AI Workflow resources. Trial licenses are available for those who qualify.
Cloud service providers may include licenses through On-Demand NVIDIA AI Enterprise instances.
NVIDIA AI Workflows are designed to be deployed on a cloud-native Kubernetes-based platform, which can be deployed on-premise or using a cloud service provider (CSP).
The infrastructure stack that will be set up for the workflow should follow the diagram below:

Follow the instructions in the sections below to set up the required infrastructure (denoted by the blue and grey boxes) that will be used in Step 3: Install Workflow Components (denoted by the green box).
GPU-Enabled Hardware Infrastructure
NVIDIA AI Workflows at minimum require a single GPU-enabled node for running the provided example workload. Production deployments should be performed in an HA environment.
The following hardware specification for the GPU-enabled node is recommended for this workflow:
1x A30/A40/A100 (or newer) GPUs with 24 GB or more of GPU memory
16 vCPU Cores
64 GB RAM
1 TB HDD
Make a note of these hardware specifications, as you will use them in the following sections to provision the nodes used in the Kubernetes cluster.
The Kubernetes cluster and Cloud Native Service Add-On Pack may have additional infrastructure requirements for networking, storage, services, etc. More detailed information can be found in the NVIDIA Cloud Native Service Add-On Pack Deployment Guide.
Kubernetes Cluster
The workflow requires a Kubernetes cluster that is supported by NVIDIA AI Enterprise to be provisioned.
The Cloud Native Service Add-On Pack only supports a subset of NVIDIA AI Enterprise-supported Kubernetes distributions at this time. Specific supported distributions and the steps to provision a cluster can be found in the NVIDIA Cloud Native Service Add-On Pack Deployment Guide.
An example reference to provision a minimal cluster based on the NVIDIA AI Enterprise VMI, with NVIDIA Cloud Native Stack, can be found in the guide here.
If your instance has a single GPU you will have to enable GPU-sharing. To do so, run the following commands on your instance:
cat << EOF >> time-slicing-config.yaml
apiVersion: v1
kind: ConfigMap
metadata:
name: time-slicing-config
namespace: nvidia-gpu-operator
data:
any: |-
version: v1
flags:
migStrategy: none
sharing:
timeSlicing:
renameByDefault: false
failRequestsGreaterThanOne: false
resources:
- name: nvidia.com/gpu
replicas: 4
EOF
kubectl create -f time-slicing-config.yaml
kubectl patch clusterpolicy/cluster-policy -n nvidia-gpu-operator --type merge -p '{"spec": {"devicePlugin": {"config": {"name": "time-slicing-config"}}}}'
kubectl patch clusterpolicy/cluster-policy -n nvidia-gpu-operator --type merge -p '{"spec": {"devicePlugin": {"config": {"name": "time-slicing-config", "default": "any"}}}}'
NVIDIA Cloud Native Service Add-On Pack
Once the Kubernetes cluster has been provisioned, proceed to the next step in the NVIDIA Cloud Native Service Add-On Pack Deployment Guide to deploy the add-on pack on the cluster.
An example reference following the one from the previous section can be found here.
Workflow Components
All of the workflow components are integrated and deployed on top of the the previously described infrastructure stack as a starting point. The workflow can then be customized and integrated with one’s own specific environment if required.
After the add-on pack has been installed, proceed to Step 3: Install Workflow Components to continue setting up the workflow.
As a part of the workflow, we will be demonstrating how to deploy the packaged workflow components as a Helm chart on the previously described Kubernetes-based platform. We will also demonstrate how to interact with the workflow, how each of the components work, and how they all function together.
This includes an example of how to securely send requests to the inference pipeline, using Envoy set up as a proxy to authenticate and authorize requests sent to Triton, and Keycloak as the OIDC identity provider. For more information about the authentication portion of the workflow, refer to the Authentication section in the Appendix.
Configure Keycloak
Prior to deploying the workflow components, ensure that you have set up Keycloak as required for the workflow, following the instructions in the Appendix.
Make sure to note down the six fields specified within the Keycloak Configuration section, you will use this in the next step.
Generate an Access Token from Keycloak
Once Keycloak has been configured, run the following command on your system via the SSH console to get the access token (replace the TOKEN_ENDPOINT
, CLIENT_ID
, CLIENT_SECRET
, USERNAME
and PASSWORD
fields with the values previously created).
curl -k -L -X POST '<TOKEN_ENDPOINT>' -H 'Content-Type: application/x-www-form-urlencoded' --data-urlencode 'client_id=<CLIENT_ID>' --data-urlencode 'grant_type=password' --data-urlencode 'client_secret=<CLIENT_SECRET>' --data-urlencode 'scope=openid' --data-urlencode 'username=<USERNAME>' --data-urlencode 'password=<PASSWORD>' | json_pp
For example:
curl -k -L -X POST 'https://auth.your-cluster.your-domain.com/realms/ai-workflows/protocol/openid-connect/token' -H 'Content-Type: application/x-www-form-urlencoded' --data-urlencode 'client_id=ai-workflow-client' --data-urlencode 'grant_type=password' --data-urlencode 'client_secret=vihhgVP76TgA4qDL3c5jUFAN1gixWYT8' --data-urlencode 'scope=openid' --data-urlencode 'username=nvidia' --data-urlencode 'password=hello123' | json_pp
This will output a JSON string like below
{"access_token":"eyJhbGc...","expires_in":54000,"refresh_expires_in":108000,"refresh_token":"eyJhbGci...","not-before-policy":0,"session_state":"e7e23016-2307-4290-af45-2c79ee79d0a1","scope":"openid email profile"}
Note down the access_token
, this field will be required later on in the workflow, within the Jupyter notebook.
Set Environment Variables Required For Deployment
Create an environment variable for the namespace to organize the K8s cluster deployed via the Cloud Native Stack and to logically separate these Merlin next-item prediction related deployments from other projects using the following command:
export NAMESPACE="next-item"
Using your NGC API Key created previously, create an environment variable for this key using the following command:
export API_KEY="<your NGC API key>"
Using the Keycloak realm created during the Keycloak configuration, create an environment variable using the following command:
export KEYCLOAK_REALM="<keycloak realm>"
Install Next Item Prediction Workflow Charts
The Next Item Prediction Workflow is packaged as a Helm chart, with a series of subcharts to deploy the various components required for the workflow.
To deploy the workflow, first fetch the helm chart from the NGC Enterprise Catalog using the following command:
helm fetch https://helm.ngc.nvidia.com/nvaie/charts/next-item-prediction-0.1.0.tgz --username='$oauthtoken' --password=$API_KEY
Then run the following commands on the system from the root of the repository.
helm install next-item-wf --set ngcKey="$API_KEY" next-item-prediction-0.1.0.tgz --namespace $NAMESPACE --create-namespace --timeout 3600s --set next-item-wf-infer.workflow.keycloak.keycloakrealm="$KEYCLOAK_REALM"
The command above will deploy all the subcharts, but some work is needed from the user to replicate a production deployment process. In reality, a user would not explicitly run these steps; they’d run as scheduled in production.
Once the previous helm install command is finished running, you should see several services you can access. Make a note of the provided URLs to access the services, you’ll use this later on in the guide.
Check to make sure that the synthetic data generation and preparation has finished using the command below.
kubectl get jobs -n $NAMESPACE
Once the
data-prep
job shows complete, the synthetic data generation and preparation has finished. We can now move onto training.Currently, training is set to occur weekly each Sunday (a cronjob is setup to run). However, for our purposes of running the workflow as an example, we will run the cronjob manually.
Create a training job from the cronjob:
First, get the name of the cronjob.
kubectl get cronjobs -n $NAMESPACE
Then, using the name of the cronjob run:
kubectl create job --from=cronjob/<name-of-cronjob> train-job -n $NAMESPACE
The train job will run and when it finishes it will put the models in MinIO. Once the models are in MinIO (give it a few minutes to train) we can redeploy the inference deployment in order to have Triton Inference Server load the trained models.
Redeploy Triton Inference server
First, get the name of the inference deployment.
kubectl get deployments -o=jsonpath='{range .items[*]}{@.metadata.name}{"\n"}{end}' -n $NAMESPACE | grep 'infer$'
Next, restart the deployment.
kubectl rollout restart deployment <deployment_name> -n $NAMESPACE
You can see if Triton loaded the models by looking at the logs of the pod that was deployed. First, get the name of the infer pod:
kubectl get pods -n $NAMESPACE
Next, run the below command using the name of the infer pod.
kubectl logs <pod-name> -n $NAMESPACE
You should see logs indicating the model was loaded successfully.
Send request for inference
Use the Jupyter notebook client URL from the available services shown at the beginning of Step 5 to open up Jupyter in your browser. This should be in the format shown below.
https://client-<NAMESPACE>.your-cluster.your-domain.com
Once Jupyter is open, open the
example_request.ipynb
notebook from the left pane. You can then follow and execute the steps in the notebook to send an example request to Triton.NoteYou can use the Shift + Enter key combination to execute a cell in the notebook.
View Metrics
- Why Monitoring
- Monitoring in a Cloud Native Environment
- Monitoring a Service
- Next Item Workflow Dashboard
In production, every microservice needs observability. Looking at metrics allows a data scientist or a machine learning engineer to make informed decisions about the service’s scale and health. Capturing metrics like average queue time and latency allows the engineer to understand how the service behaves over time. If the service queue time has increased over time, it means that the server is receiving more requests than it can process. If the queue time has reached the allowable threshold, we need to scale the server to increase the number of replicas to process more requests.
The problem of monitoring metrics is solved in Kubernetes with Prometheus and Grafana. Prometheus is an open-source monitoring and alerting tool. It “pulls” metrics (measurements) from microservices by sending HTTP requests and stores the results in a time-series database. Prometheus uses ServiceMonitor objects to scrape metrics from a Kubernetes service endpoint and store them as targets.
The Triton Inference Server that is deployed exposes the Triton Inference Server’s metrics API. Triton provides Prometheus metrics indicating GPU and request statistics. These metrics are available at http://:8002/metrics. A ServiceMonitor Kubernetes object with Prometheus is used to scrape these metrics by polling this endpoint as a target. The Grafana dashboard object uses Prometheus as a data source to visualize these metrics as dashboards.
Let’s look at our Grafana dashboard. Navigate to the
https://dashboards.your-cluster.your-domain.com
link that was provided as the output to the workflow Helm chart installation. This will lead you to the Grafana Service sign-in page. The username is admin, and the password is obtained by running the command in the code block below on your Kubernetes Cluster.Grafana:
User: admin
Password: <see code block below>
kubectl get secret grafana-admin-credentials -n nvidia-monitoring -o json| jq -r '.data.GF_SECURITY_ADMIN_PASSWORD' | base64 -d
Once logged in, select the Dashboards icon in the left navigation pane, select browse, expand the merlin folder, and click NVIDIA Triton Inference Server Dashboard.
You can now review the Triton metrics that are reported from the dashboard. For example, note the following metrics:
Average (per minute) queue time (in ms): Average cumulative time requests spend waiting in the scheduling queue (includes cached requests). Averaged across 1 minute.
Successful inference requests per minute: Number of successful inference requests received by Triton (each request is counted as 1, even if the request contains a batch).
# failed inference requests per minute: Number of failed inference requests received by Triton (each request is counted as 1, even if the request contains a batch).
P99 latency (per minute) (in seconds): 99th percentile request latency. Latency is computed for the total time spent in model inference backends.
P95 latency (per minute) (in seconds): 99th percentile request latency. Latency is computed for the total time spent in model inference backends.
# Triton Instances used
GPU memory (GB)
GPU power utiliation (watts)