> For clean Markdown of any page, append .md to the page URL.
> For a complete documentation index, see https://docs.nvidia.com/aiperf/llms.txt.
> For full documentation content, see https://docs.nvidia.com/aiperf/llms-full.txt.
> For AI client integration (Claude Code, Cursor, etc.), connect to the MCP server at https://docs.nvidia.com/aiperf/_mcp/server.
# Architecture of AIPerf
AIPerf is a modular benchmarking tool for measuring AI inference performance. It generates load against inference endpoints, collects detailed performance metrics, and provides comprehensive analysis of throughput, latency, and resource utilization.
## Architecture Overview
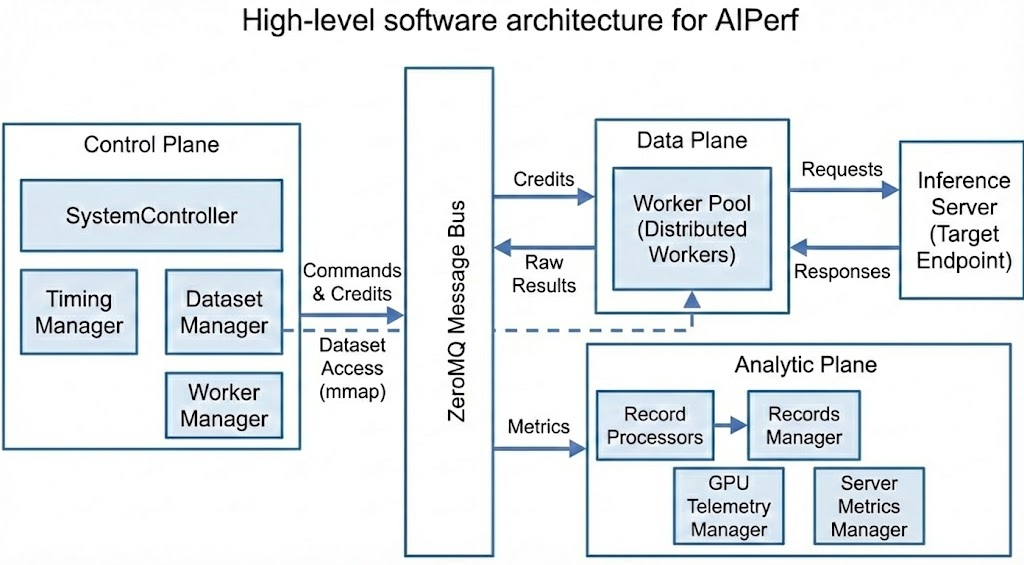
AIPerf is designed as a modular, extensible benchmarking framework that separates concerns across three architectural planes. The system scales horizontally as more workers are added while maintaining centralized orchestration.
### Three-Plane Architecture
| Plane | Components | Purpose |
|-------|-----------|---------|
| **Control Plane** | SystemController, Timing Manager, Dataset Manager, Worker Manager | Decides what, when, and how many requests to send |
| **Data Plane** | Workers, Inference Server | Executes the actual I/O and request/response cycle |
| **Analytic Plane** | Record Processors, Records Manager, GPU Telemetry Manager, Server Metrics Manager | Computes metrics and collects telemetry |
### Request Lifecycle
1. **Initialization**: Dataset Manager loads data, Timing Manager prepares schedule
2. **Warmup** (optional): Workers send warmup requests to prime JIT, caches, and connection pools. Results are discarded.
3. **Profiling**: Workers receive credits, access data, send requests to inference server
4. **Collection**: Workers capture response timing and content
5. **Processing**: Record Processors compute metrics in parallel
6. **Aggregation**: Records Manager collects and exports results
## Core Components
### System Controller
The System Controller is the central orchestrator that manages the lifecycle and coordination of all major modules involved in a benchmarking run.
**Key Responsibilities:**
- Registering and initializing core components
- Orchestrating the start, execution, and shutdown of benchmarking tasks
- Handling configuration, resource allocation, and inter-module communication
- Monitoring the overall progress and health of the benchmarking process
- Managing error handling, cleanup, and graceful termination of all modules
### Dataset Manager
The Dataset Manager handles all aspects of input data management during benchmarking runs.
**Key Responsibilities:**
- Loading datasets from various sources (JSONL, CSV, synthetic generators, trace replay formats)
- Parsing and validating input data to ensure it matches the expected format
- Writing dataset to memory-mapped files, enabling workers to access data directly without message passing
- Supporting custom dataset types, such as MoonCake traces, for advanced benchmarking scenarios
- Managing the lifecycle of datasets, including initialization, iteration, and cleanup
### Timing Manager
The Timing Manager controls and coordinates the timing of requests during benchmarking runs through a credit-based system.
**Key Responsibilities:**
- Scheduling when each request should be sent based on the selected timing mode (fixed schedule, request-rate, or user-centric rate)
- Managing precise timing to accurately reproduce real-world or synthetic load patterns
- Supporting advanced timing scenarios, such as replaying traces with specific inter-arrival times or simulating bursty traffic
- Ensuring that requests are dispatched to workers at the correct intervals for reliable measurement
### Worker Manager
The Worker Manager orchestrates and manages the pool of worker processes that execute benchmarking tasks.
**Key Responsibilities:**
- Coordinating with the system controller to spawn and shut down workers that send requests to the inference server
- Monitoring worker status, progress, and resource usage
- Handling worker lifecycle events, such as startup, shutdown, and error recovery
- Managing worker pool size based on benchmarking requirements
### Workers
Workers are the processes that send HTTP requests to the inference server and measure response times.
**Key Responsibilities:**
- Send HTTP requests to inference servers and measure response timing
- Wait for timing credits before sending requests (enables precise load control)
- Track conversation state for multi-turn interactions
- Report timing measurements to Record Processors for analysis
**Scalability:**
- Run multiple workers (e.g., 10, 50, 100+) to support different workload patterns
- No coordination between workers
- Adding more workers increases load capacity and request rates
### Record Processor
The Record Processor processes and interprets the responses received from the inference server during benchmarking.
**Key Responsibilities:**
- Parsing raw inference results to extract relevant metrics (latency, output tokens, correctness)
- Handling different response formats from various model endpoints (OpenAI, vLLM, Triton, custom APIs)
- Validating and normalizing results to ensure consistency across benchmarking runs
- Computing metrics derived from individual requests (TTFT, ITL, Request Latency, Request Throughput etc.)
- Supporting error detection and handling for malformed or unexpected responses
- Scales horizontally to handle high-volume metric computation
### Records Manager
The Records Manager handles the collection, organization, and storage of benchmarking records and results.
**Key Responsibilities:**
- Aggregating data from the records processors (inference results, timing information, metrics)
- Storing records in memory and/or exporting them to files (CSV, JSON, Parquet) for later analysis
- Providing interfaces for querying, filtering, and summarizing benchmarking results
- Supporting the generation of reports and artifacts for performance evaluation
- Managing the final export of aggregated performance summaries and per-request details
### GPU Telemetry Manager
The GPU Telemetry Manager collects GPU metrics during benchmarking runs via pluggable collectors.
**Key Responsibilities:**
- Collecting GPU metrics (power, utilization, memory, temperature, errors) via two collector backends:
- **DCGM**: Scrapes DCGM Exporter HTTP endpoints (Prometheus format)
- **PyNVML**: Queries NVIDIA GPUs directly via the pynvml Python library (no external endpoint required)
- Auto-discovering DCGM endpoints
- Supporting custom endpoints via `--gpu-telemetry` flag
- Exporting GPU telemetry alongside benchmark results
### Server Metrics Manager
The Server Metrics Manager collects metrics from Prometheus-compatible endpoints during benchmarking runs.
**Key Responsibilities:**
- Collecting metrics from Prometheus-compatible endpoints (inference server application metrics, system metrics, custom metrics)
- Auto-discovering metrics endpoints from configured inference server URLs (`--url`)
- Supporting custom Prometheus endpoints via `--server-metrics` flag
- Parsing any metrics exposed in Prometheus format (gauges, counters, histograms)
- Typical metrics collected: inference server KV cache usage, request counts, latencies, batch sizes, model-specific metrics, and server resource metrics
- Auto-detecting non-Prometheus endpoints (e.g. TRT-LLM serves an iteration-stats JSON array at `/metrics` by default), probing `/prometheus/metrics` once as a fallback, and disabling collection for that endpoint after a single warning if neither path yields parseable Prometheus data — see [Server Metrics Compatibility & auto-disable](/aiperf/dev/server-metrics/server-metrics-collection#compatibility--auto-disable)
- Exporting server metrics alongside benchmark results
## How AIPerf Works
### Credit System & Request Timing
The Timing Manager uses a **credit-based flow control system** to control when requests are sent. This enables accurate load pattern reproduction and prevents server overload.
**How Credits Work:**
- Each credit grants permission to send one request
- The Timing Manager issues credits according to the configured timing mode:
- **Fixed schedule mode**: Replays conversation traces at precise timestamps from dataset metadata
- **Request-rate mode**: Issues credits at a specific rate with configurable arrival patterns (constant, Poisson, gamma, concurrency burst)
- **User-centric rate mode**: Each session acts as a separate user with calculated gaps between turns
**Flow Control Benefits:**
- Prevents overwhelming the inference server
- Enables precise reproduction of load patterns
- Provides natural backpressure when the server slows down
- Allows accurate measurement without artificial delays
**Credit Distribution:**
- Credits are routed to workers via ROUTER/DEALER pattern
- Router selects workers based on sticky sessions (multi-turn conversations) or least-loaded worker selection
- No coordination required between workers
- Scales to large numbers of workers without bottlenecks
- Efficient message routing minimizes overhead
### Data Flow & Messaging
This section describes the end-to-end message flow during a benchmark run, showing how data moves between components through the ZMQ message bus.
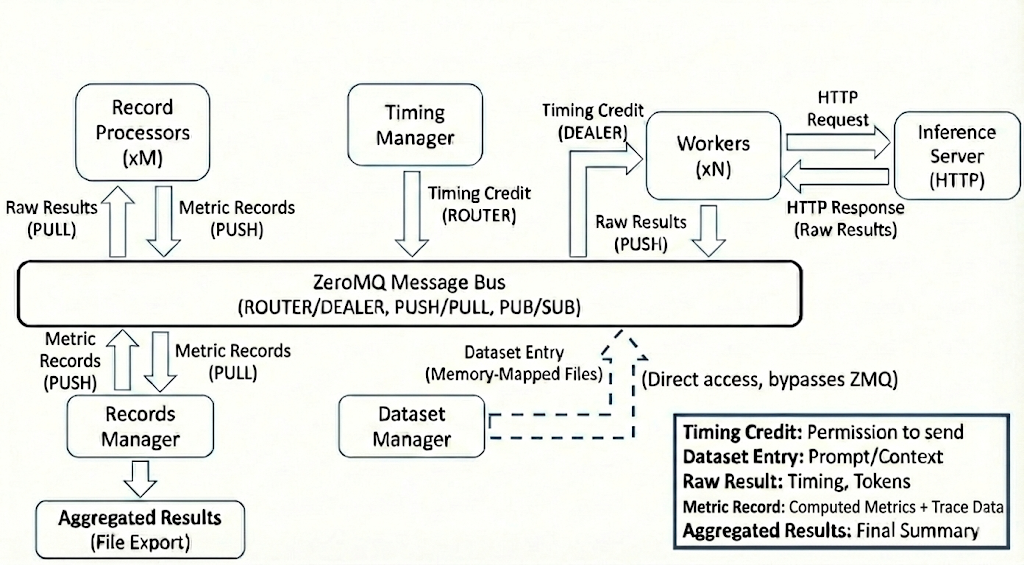
**Key Data Structures:**
- **Timing Credit**: Grants permission to send one request
- **Dataset Entry**: Prompt and conversation context
- **Raw Result**: Request timing, tokens, response text
- **Metric Record**: Per-request computed metrics plus trace data
- **Aggregated Results**: Final performance summary and per-request details
**Message Flow:**
1. Credit Router routes credits to workers via ROUTER/DEALER pattern
2. Workers access dataset entries via memory-mapped files
3. Workers send requests to Inference Server (external HTTP)
4. Workers push raw results to Record Processors
5. Record Processors push metric records to Records Manager
6. Records Manager aggregates and exports final results
## Communication Architecture
AIPerf services communicate internally via a **ZeroMQ (ZMQ) message bus**, designed for low-latency, high-throughput message passing between components.
### Why ZMQ?
AIPerf uses ZMQ to maintain **measurement accuracy** by decoupling orchestration logic from execution:
- **Low-overhead messaging**: Credits are routed directly to workers
- **Asynchronous by design**: No blocking calls between services, ensuring workers spend maximum time on I/O and timing
- **Efficient transport**: ZMQ is designed for low-overhead inter-process communication
- **Scalability**: Supports many local worker processes; Kubernetes is referenced by future-facing code paths, but no Kubernetes service-manager plugin or `ServiceRunType` is registered in this checkout, and distributed Kubernetes execution is not supported
### Communication Patterns
AIPerf uses **ZMQ proxies** for message routing between services and workers:
- Services publish strongly-typed messages to specific topics (Pub/Sub pattern)
- Services subscribe to relevant message types
- Router/Dealer patterns for credit distribution to workers
- Request/Reply patterns for synchronous operations
### State Management
**Stateless design** for scalability:
- **Workers**: No shared state between workers; each maintains only local conversation context for multi-turn requests
- **Services**: All service state is ephemeral and can be reconstructed from configuration
- **Coordination**: Credit distribution happens through the message bus; dataset access via memory-mapped files
- **Results**: Only aggregated results are persistent (exported to files)
## Design Principles
AIPerf is built on three core principles:
- **Separation of Concerns**: Control plane orchestrates, workers execute, record processors compute metrics
- **Scalability**: Horizontal scaling for workers and processors with credit-based flow control
- **Extensibility**: Plugin system for datasets, endpoints, transports, and metrics
## Deployment Modes
AIPerf currently supports one local deployment model:
- **Multiprocess Mode**: Each service runs as a separate process on a single node (default for single-node deployments)
Kubernetes is referenced by future-facing code paths, but no Kubernetes service-manager plugin or `ServiceRunType` is registered in this checkout; do not treat Kubernetes distributed execution as supported.
## Configuration Envelope
The top-level `AIPerfConfig` YAML accepts several optional sibling keys alongside the core `benchmark:` block — `sweep:`, `multi_run:`, `variables:`, `random_seed:`, and `plot:`. Each owns a single concern and is loaded by its own Pydantic model.
The `plot:` envelope describes which plots are rendered after the run. It accepts two forms: a bare-string path reference (e.g. `plot: ./plots/baseline.yaml`, resolved relative to the AIPerf YAML's directory) or an inline mapping mirroring `src/aiperf/plot/default_plot_config.yaml` 1:1. When `plot:` is set it replaces the `~/.aiperf/plot_config.yaml` fallback (the envelope is the spec) and presence implies `artifacts.auto_plot=True` unless the user explicitly sets it to `false`. The auto-plot callback materializes the resolved envelope to `/.aiperf-plot-config.yaml` so `aiperf plot ` later reproduces the same plots without the original YAML. See `src/aiperf/config/plot.py` for the Pydantic models.
## External Dependencies
AIPerf integrates with external systems:
- **Inference Server**: The target system being benchmarked (vLLM, Dynamo, SGLang, etc.)
- **DCGM Exporter**: Optional GPU telemetry source (exposes GPU metrics in Prometheus format). Alternative: PyNVML queries GPUs directly without an external endpoint.
- **Prometheus-compatible endpoints**: Optional server/application metrics source for Server Metrics Manager (inference servers like vLLM expose metrics in Prometheus format at their /metrics endpoint)
## Telemetry Plane
The Telemetry Plane provides real-time streaming of benchmark metrics to OpenTelemetry collectors and MLflow tracking servers. It operates as a sidecar to the Analytic Plane, consuming processed results without affecting the core benchmarking pipeline.
### OTelMetricsResultsProcessor Registration
`OTelMetricsResultsProcessor` is a results processor registered with `RecordsManager`. When `--otel-url` is set (with `--stream` controlling which domains are active), the processor is instantiated and added to the Records Manager's processor chain. It receives every `MetricRecordsData` and `CreditPhaseStats` event that flows through the analytic plane, acting as the entry point into the telemetry pipeline.
The processor does not emit metrics directly. Instead, it delegates to strategy objects that decide whether a given result type is relevant and how to transform it into telemetry events.
### multiprocessing.Queue and Fanout Process
Telemetry export runs in a dedicated child process (`Fanout_Process`) to isolate the benchmarking hot path from network I/O to collectors and tracking servers. Communication between the main process and the fanout process uses a bounded `multiprocessing.Queue`.
**Back-pressure policy:** When the queue is full, the oldest event is dropped and the put is retried once. A `_fanout_dropped_events` counter tracks discards so operators can detect saturation without impacting benchmark accuracy.
The fanout process drains the queue with a configurable `poll_timeout_sec`, batches events through the OTel SDK periodic reader for OTLP export, and optionally forwards metrics to MLflow when `--mlflow-tracking-uri` is set.
### Strategy-Protocol Dispatch via --stream
The `--stream` flag activates strategy-based dispatch inside `OTelMetricsResultsProcessor`. Each strategy implements a two-method protocol:
- `supports(result)` — returns `True` if the strategy handles this result type.
- `process(result)` — transforms the result into one or more telemetry events pushed to the queue.
Two built-in strategies ship with the system:
| Strategy | Triggers on | Emits |
|----------|------------|-------|
| `MetricResultsStrategy` | `MetricRecordsData` | Histogram record events (latency, throughput) |
| `TimingResultsStrategy` | `CreditPhaseStats` | Counter add / UpDownCounter add events |
Strategies are evaluated in registration order; the first whose `supports` returns `True` wins.
### Deferred MLflow Path in ExporterManager
Post-run artifact upload follows a deferred export path. `MLflowDataExporter` is registered as a deferred exporter in `ExporterManager` so it runs after all local exporters (JSON, CSV, Parquet) have written their files. This guarantees that every artifact is available on disk before the upload begins.
The deferred path handles run identity, metric logging, and artifact upload in a single pass:
```mermaid
flowchart TD
A[RecordsManager finishes run] --> B[ExporterManager.export_data]
B --> C[Run local exporters: JSON, CSV, Parquet, ...]
C --> D[Collect deferred_exporters]
D --> E{MLflowDataExporter enabled?}
E -- No --> Z[Done]
E -- Yes --> F[Load mlflow_export.json from output_dir]
F --> G{tracking_uri && benchmark_id match?}
G -- Yes --> H[run_context = resume live run_id]
G -- No --> I[run_context = new MLflow run]
H --> J[Open run]
I --> J
J --> K[log_batch metrics / params / tags]
K --> L[Enumerate artifact files, excluding mlflow_export.json]
L --> M[Compute uploaded_artifact_names]
M --> N[Write FINAL mlflow_export.json to disk with uploaded_artifacts + reused_live_run]
N --> O[log_artifacts one pass: all files incl. mlflow_export.json]
O --> P[Close run]
P --> Z
```
### Data Flow: Record Telemetry
The following diagram shows how per-request metrics flow from workers through the analytic plane into the telemetry pipeline:
```mermaid
sequenceDiagram
participant W as Worker (data plane)
participant RP as RecordProcessor (analytic plane)
participant RM as RecordsManager
participant OP as OTelMetricsResultsProcessor
participant Q as multiprocessing.Queue
participant F as Fanout Process
participant C as OTel Collector
participant M as MLflow Tracking
W->>RP: raw response
RP->>RM: MetricRecordsData
RM->>OP: process_result(MetricRecordsData)
OP->>OP: MetricResultsStrategy.supports -> True
OP->>OP: MetricResultsStrategy.process -> histogram record events
OP->>Q: put_nowait(histogram_record)
Note right of OP: On Full -> drop oldest, retry once, increment _fanout_dropped_events
Q-->>F: event_queue.get(timeout=poll_timeout_sec)
F->>C: OTLP metric export (periodic reader)
F->>M: log_metric (when --mlflow-tracking-uri is set)
```
### Data Flow: Timing Telemetry
Credit-phase timing events follow a similar path but use counters and up-down counters rather than histograms:
```mermaid
sequenceDiagram
participant T as TimingManager
participant RM as RecordsManager
participant OP as OTelMetricsResultsProcessor
participant Q as multiprocessing.Queue
participant F as Fanout Process
participant S as mlflow_gauge_snapshots (in F)
participant C as OTel Collector
participant M as MLflow Tracking
T->>RM: CREDIT_PHASE_{START,PROGRESS,SENDING_COMPLETE,COMPLETE}
RM->>OP: process_result(CreditPhaseStats)
OP->>OP: TimingResultsStrategy.supports -> True
OP->>OP: TimingResultsStrategy.process -> counter_add / up_down_counter_add
OP->>Q: put_nowait(counter_add | up_down_counter_add)
Q-->>F: dispatch event
F->>C: OTel counter.add(delta) / up_down_counter.add(delta)
alt event is up_down_counter_add
F->>S: snapshots[name][attr_key] += delta
F->>M: log_metric(live., snapshots[name][attr_key])
else event is counter_add
F->>M: log_metric(live., delta)
end
```