Introduction
NVIDIA® System Management (NVSM) is an NVIDIA software stack for managing and monitoring NVIDIA-designed servers such as NVIDIA DGX™, CGX, and RTX servers.
NVSM is an “always-on” health monitoring engine which catches issues proactively as opposed to other tools which need to be run post facto. By virtue of having deep knowledge of the underlying platform, NVSM has the optimal list of health checks to make as well as how frequently each check needs to happen.
NVSM CLIs and APIs alleviate the need for users to
Have deep knowledge of tools such as ipmitool, dmidecode, lspci, storcli, mdadm, and lsblk.
Have deep knowledge of platform details such as the intended PCIe hierarchy, storage hierarchy, or error thresholds.
Manually correlate information from several tools; in many cases, the output of one tool needs to be manually parsed to know how to use the next tool. For example, BDF in SEL record vs BDF in lspci just to determine which device is faulty.
NVSM catches issues which some customers might never notice. For example, some PCIe links might be running at lower link width/speed causing jobs to run slow. Without NVSM, customers might suspect something wrong with their jobs OR worse assume that DGX is simply that slow.
NVSM provides
An on-demand health check suite which runs a battery of tests and reports deviations from expected results.
The ability to create a bundle of all relevant system logs required by NVIDIA support when reporting an issue.
A secure REST API interface removing the need for users/scripts to log-into the system. So it is easy to develop remote management SW applications using these APIs.
A Prometheus metrics exporter which can be enabled so an external Prometheus server can pull critical system metrics from the target DGX nodes.
NVSM’s call-home feature, if enabled, creates a support ticket on behalf of the customer automatically in case of platform issues, even before the customer notices it.
In addition, NVSM provides other notification mechanisms like email and PagerDuty.
Currently, NVSM supports the following DGX systems:
DGX servers: Complete NVSM functionality described in this document.
DGX Station: Functionality is limited to using the CLI to check the health of the system and obtain diagnostic information.
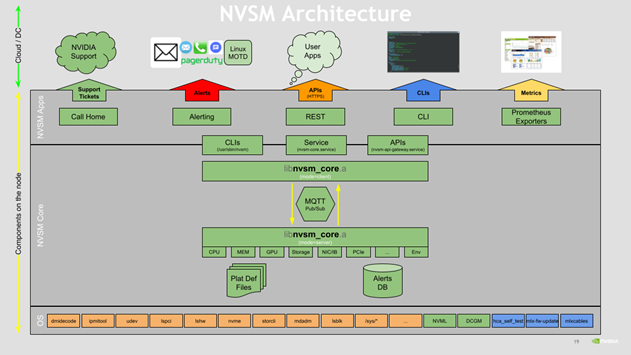
The following is a high level diagram of the NVSM architecture:
Note
“Always on” functionality is not supported on DGX Station.
Configurable “Always On” Features
NVSM contains the following features that you can configure using the NVSM CLI:
Health Monitor Alerts
Health Monitor Policies
Health Monitor Alerts
Alerts are events of significance that require attention. When a health monitor detects such an event in the subsystem that it monitors, it generates an alert to inform the user. The default behavior is to log the alerts in persistent storage as well as to send an E-mail notification to registered users. Refer to the section Using the NVSM CLI for details about configuring users for receiving alert E-mail notifications.
Each alert has a ‘state’. An active alert can be in a ‘critical’ or ‘warning’ state. Here, ‘critical’ implies an event that needs immediate action, and ‘warning’ implies an event that needs user attention. When the alerting condition is removed, the alert state changes to ‘cleared’. Details of how to view the generated alerts recorded in the database are available in the section Using the NVSM CLI.
Health Monitor Alert List
The following table describes each alert ID:
Message and details |
Alert ID |
Component ID |
Severity |
Recommended Action |
|---|---|---|---|---|
Unsupported drive configuration. Affected component URI: {{ index .Params "Uri" }} |
NV-DRIVE-01 |
Drive Slot <> |
Warning |
See Recommended Action A below. |
System entered degraded mode, drive in {{ index .Params "DriveSlot" }} is not supported. |
NV-DRIVE-07 |
Drive Slot <> |
Warning |
See Recommended Action A below. |
Unsupported SED drive configuration. |
NV-DRIVE-09 |
Volume label |
Warning |
See Recommended Action A below. |
Unsupported volume encryption configuration. |
NV-DRIVE-10 |
Volume label |
Critical |
See Recommended Action A below. |
M.2 drive firmware version mismatch. |
NV-DRIVE-11 |
Drive Slot <> |
Warning |
See Recommended Action A below. |
System entered degraded mode, volume {{ index .Params "ComponentName" }} is under rebuild. |
NV-VOL-01 |
Volume name |
Warning |
See Recommended Action A below. |
System entered degraded mode, volume {{ index .Params "ComponentName" }} rebuild failed. |
NV-VOL-02 |
Volume name |
Critical |
See Recommended Action A below. |
System entered degraded mode, volume {{ index .Params "ComponentName" }} is in a degraded state. |
NV-VOL-03 |
Volume name |
Critical |
See Recommended Action A below. |
System entered degraded mode, volume {{ index .Params "ComponentName" }} is inactive or in a failed state. |
NV-VOL-04 |
Volume name |
Critical |
See Recommended Action A below. |
Raid-0 Volume {{ index .Params "ComponentName" }} is misconfigured. |
NV-VOL-05 |
Volume name |
Warning |
See Recommended Action A below. |
Raid-0 data volume for caching is not present. |
NV-VOL-06 |
Informational |
See Recommended Action A below. |
|
EFI partition missing on boot volume. Run ‘blkid’ to check the partition type. |
NV-VOL-09 |
Volume name |
Critical |
See Recommended Action A below. |
Storage Volume {{ index .Params "ComponentName" }} utilization is nearing 90% of {{ index .Params "Capacity" }} bytes. |
NV-VOL-10 |
Volume name |
Critical |
See Recommended Action A below. |
System entered degraded mode, {} is reporting an error. (Power supply module has failed.) |
NV-PSU-01 |
<PSU#> where # is the PSU number. |
Critical |
See Recommended Action A below. |
System entered degraded mode, {} is reporting an error. (Operating temperature exceeds the thermal specifications of the component.) |
NV-PSU-02 |
<PSU#> where # is the PSU number. |
Warning |
See Recommended Action A below. |
System entered degraded mode, {} is reporting an error. (Input to the PSU is missing) |
NV-PSU-03 |
<PSU#> where # is the PSU number. |
Critical |
See Recommended Action A below. |
System entered degraded mode, {} is reporting an error. (Input voltage is out of range for the Power Supply Module) (Input voltage is out of range for the Power Supply Module) |
NV-PSU-04 |
<PSU#> where # is the PSU number. |
Critical |
See Recommended Action A below. |
System entered degraded mode, {} is reporting an error. (PSU is missing) |
NV-PSU-05 |
<PSU#> where # is the PSU number. |
Warning |
See Recommended Action A below. |
Failures in Power supply modules have been detected. (System is operating in degraded performance mode.) |
NV-PSU-06 |
Warning |
Rectify the issues observed on the PSUs. Then see Recommended Action A below. |
|
Failures in Power supply modules have been detected. (System is in power failed state) |
NV-PSU-07 |
Critical |
Rectify the issues observed on the PSUs. Then see Recommended Action A below. |
|
System entered degraded mode, {} is reporting an error. (Operating temperature exceeds the thermal specifications of the component.) |
NV-PDB-01 |
<PDB#> where # is the PDB number |
Critical |
See Recommended Action A below. |
System entered degraded mode, {} is reporting an error. (Fan speed reading has fallen below the expected speed setting.) |
NV-FAN-01 |
<FAN#_F> or <FAN#_R> where # is the fan module number. F is for front fan. R is for rear fan. |
Critical |
See Recommended Action A below. |
System entered degraded mode, {} is reporting an error. (Fan readings are inaccessible.) |
NV-FAN-02 |
<FAN#_F> or <FAN#_R> where # is the fan module number. F is for front fan. R is for rear fan. |
Critical |
See Recommended Action A below. |
System entered degraded mode, {} is reporting an error. (An unrecoverable CPU Internal error has occurred.) |
NV-CPU-01 |
<CPU#> where # is the CPU socket number (CPU0 or CPU1) |
Critical |
See Recommended Action A below. |
System entered degraded mode, {} is reporting an error. (CPU Thermtrip has occurred, processor socket temperature exceeded the thermal specifications of the component.) |
NV-CPU-02 |
<CPU#> where # is the CPU socket number (CPU0 or CPU1) |
Critical |
See Recommended Action A below. |
System entered degraded mode, {} is reporting an error. (Processor socket temperature exceeded the thermal specifications of the component.) |
NV-CPU-03 |
Critical |
See Recommended Action A below. |
|
System entered degraded mode, {} is reporting an error. (Processor socket temperature exceeded the thermal specifications of the component.) |
NV-CPU-04 |
Critical |
See Recommended Action A below. |
|
System entered degraded mode, {} is reporting an error. (Uncorrectable error is reported). |
NV-DIMM-01 |
<CPU#_DIMM_@$> where # = (1, 2) @ = (A, B, C, D, E, F) $ = (1, 2) |
Critical |
See Recommended Action A below. |
System entered degraded mode, {} is reporting an error. (Correctable errors reported exceeds the configured threshold.) |
NV-DIMM-02 |
<CPU#_DIMM_@$> where # = (1, 2) @ = (A, B, C, D, E, F) $ = (1, 2) |
Warning |
See Recommended Action A below. |
System entered degraded mode, {} is reporting an error. (Unrecoverable error is observed on the DIMM, specific details of the error are unavailable.) |
NV-DIMM-03 |
<CPU#_DIMM_@$> where # = (1, 2) @ = (A, B, C, D, E, F) $ = (1, 2) |
Critical |
See Recommended Action A below. |
System entered degraded mode, {} is reporting an error. (DIMM presence is not expected in this slot, please verify the DIMM details.) |
NV-DIMM-04 |
See Recommended Action A below. |
||
System entered degraded mode, GPU is reporting an error (Critical error has been reported by the GPU.) |
NV-GPU-01 |
Critical |
See Recommended Action A below. |
|
GPU{} power Limits are not configured correctly (Expected limits (Power: 200000W, Clock: 1597MHz), Actual limits (Power: 200000W, Clock: 1163MHz).) |
NV-GPU-02 |
Critical |
See Recommended Action A below. |
|
System entered degraded mode, {ID} is reporting an error. (Link speed degradation observed between { BDF1, BDF2}, expected link speed is {} actual link speed is {}) |
NV-PCI-01 |
Warning |
See Recommended Action A below. |
|
System entered degraded mode, {ID} is reporting an error. (Link width degradation observed between {BDF1, BDF2},, expected link width is {} actual link width is {}) |
NV-PCI-02 |
Warning |
See Recommended Action A below. |
|
System entered degraded mode, {ID} is reporting an error. (Correctable errors reported on {BDF}.) |
NV-PCI-03 |
Warning |
See Recommended Action A below. |
|
System entered degraded mode, {ID} is reporting an error. (UnCorrectable errors reported on {BDF}) |
NV-PCI-04 |
Critical |
See Recommended Action A below. |
|
System entered degraded mode, {ID} is reporting an error. (Device is missing on {BDF}) |
NV-PCI-05 |
Critical |
See Recommended Action A below. |
|
System entered degraded mode, {ID} is reporting an error. (Device Error Reporting is disabled on {BDF} for {}) |
NV-PCI-06 |
Critical |
See Recommended Action A below. |
|
System entered degraded mode, {ID} is reporting an error. (Device is disabled on {BDF}) |
NV-PCI-07 |
Critical |
See Recommended Action A below. |
|
System entered degraded mode, controller {{ index .Params "ComponentName" }} is reporting an error. |
NV-CONTROLLER-01 |
Controller name |
Warning |
See Recommended Action A below. |
System entered degraded mode, Storage controller {{ index .Params "ComponentName" }} is reporting a PHY error. |
NV-CONTROLLER-02 |
Controller name |
Warning |
See Recommended Action A below. |
System entered degraded mode, controller {{ index .Params "ComponentName" }} is set at lower than expected speed. |
NV-CONTROLLER-03 |
Controller name |
Warning |
See Recommended Action A below. |
System entered degraded mode, controller {{ index .Params "ComponentName" }} is reporting an error. |
NV-CONTROLLER-04 |
Controller name |
Warning |
See Recommended Action A below. |
System entered degraded mode, controller {{ index .Params "ComponentName" }} is reporting an error. |
NV-CONTROLLER-05 |
Controller name |
Critical |
See Recommended Action A below. |
System entered degraded mode, controller {{ index .Params "ComponentName" }} is reporting an error. |
NV-CONTROLLER-06 |
Controller name |
Critical |
See Recommended Action A below. |
LEDStatus for controller {{ index .Params "ComponentName" }} needs to be cleared. |
NV-CONTROLLER-07 |
Controller name |
Critical |
See Recommended Action A below. |
Link error on {}. (Network Link is down) |
NV-NET-01 |
Warning |
See Recommended Action B below. |
|
Network traffic errors observed on {}. (Rx collision rate of {}, has crossed threshold value of {} on {}network port.) |
NV-NET-02 |
Warning |
See Recommended Action B below. |
|
Network traffic errors observed on {}. (Tx collision rate of {}, has crossed threshold value of {} on {}network port.) |
NV-NET-03 |
Warning |
See Recommended Action B below. |
|
Network traffic errors observed on {}. (CRC error rate of {}, has crossed threshold value of {} on {}network port.) |
NV-NET-04 |
Critical |
See Recommended Action B below. |
|
{} is reporting an error. ({}Network port is disabled.) |
NV-NET-05 |
Critical |
See Recommended Action B below. |
|
Ethernet interface error on port {}. ({}Ethernet health check failing with Online NVRAM test failure.) |
NV-ETH-01 |
Critical |
See Recommended Action B below. |
|
Ethernet interface configuration error on {}. (MAC address is missing on the Ethernet interface of {}.) |
NV-ETH-02 |
Critical |
See Recommended Action B below. |
|
IB driver error. (HCA self test reports IB driver initialization failure.) |
NV-IB-01 |
Critical |
See Recommended Action C below. |
|
Counter errors on IB port {} ({}HCA self test on IB port reports counter error.) |
NV-IB-02 |
Critical |
See Recommended Action B below. |
|
Configuration error on IB port {}. (GUID is missing on {}HCA.) |
NV-IB-03 |
Critical |
See Recommended Action D below. |
|
System entered degraded mode, {} is reporting a fatal error (Critical error has been reported by the NVSwitch Id {} with SXID error {}) |
NV-NVSWITCH-01 |
Critical |
See Recommended Action A below. |
|
System entered degraded mode, {} is reporting a non fatal error (Critical error has been reported by the NVSwitch Id {} with SXID error {}) |
NV-NVSWITCH-02 |
Warning |
See Recommended Action A below. |
Recommended Actions
(A)
Run ‘sudo nvsm dump health’
Open a case with NVIDIA Enterprise Support at this address https://nvid.nvidia.com/dashboard/
Attach this notification and the nvsysinfo log file from /tmp/nvsm-health- <hostname>-<timestamp>.tar.xz
(B)
Check the physical link connection
Open a case with NVIDIA Enterprise Support at https://nvid.nvidia.com/dashboard/
(C)
Check OFED installation troubleshooting
Open a case with NVIDIA Enterprise Support at this address https://nvid.nvidia.com/dashboard/
(D)
Check the status of the Subnet Manager
Open a case with NVIDIA Enterprise Support at this address https://nvid.nvidia.com/dashboard/
Health Monitor Policies
Users can tune certain aspects of health monitor behavior using health monitor policies. This includes details such as email related configuration for alert notification, selectively disabling devices to be monitored, etc. Details of the supported policies and how to configure them using the CLI are provided in the section Using the NVSM CLI.
Verifying the Installation
Before using NVSM, you can verify the installation to make sure all the services are present.
Verifying NVSM Services with systemctl
NVSM is part of the DGX OS image and is launched by systemd when DGX boots. The following are the services running under NVSM:
nvsm-api-gateway.servicenvsm-core.servicenvsm-mqtt.servicenvsm-notifier.servicenvsm.service
You can verify if each NVSM service is up and running using the systemctl command. For example, the following command verifies the core service:
$ sudo systemctl status nvsm-core
You can view all the NVSM services and their status with the following command:
$ sudo systemctl status -all nvsm*
Verifying NVSM Services with nvsm status
The nvsm status command displays the NVSM services and their status, example output:
$ sudo nvsm status
SERVICE                   ENABLED  ACTIVE  SUB       DESCRIPTION
================================================================================
nvsm-mqtt.service         enabled    active  running         MQTT broker for NVSM API for signaling within NVSM API components
nvsm-core.service         enabled    active  running         NVSM Core Service for System Management
nvsm-api-gateway.service  enabled    active  running         NVSM API Server to provide DGX System Management APIs
nvsm-notifier.service     enabled    active  running         NVSM Notifier service.

Overall
================================================================================
Overall Health: Healthy
Overall Status: Active
If you run nvsm status while NVSM is starting, the output resembles the following example:
$ sudo nvsm status
SERVICE                   ENABLED  ACTIVE     SUB         DESCRIPTION
================================================================================
nvsm-mqtt.service         enabled  active     running     MQTT broker for NVSM API for signaling within NVSM API components
nvsm-core.service         enabled  activating start-post  NVSM Core Service for System Management
nvsm-api-gateway.service  enabled  inactive   dead        NVSM API Server to provide DGX System Management APIs
nvsm-notifier.service     enabled  inactive   dead        NVSM Notifier service.

Overall
================================================================================
Overall Health: Transient
Overall Status: Starting

Recommendations:
================================================================================
0. NVSM is starting, this state should be transient, please try again later
1. nvsm-core.service is activating. If it stay in this state, please run "journalctl -fu nvsm-core.service" for more details
Note
The nvsm CLI command works only if all NVSM services are up and running.
If any sub service fails or stuck in starting, run the following command to get additional information:
sudo systemctl status <service-name>
For example:
sudo systemctl status nvsm-core.service