Troubleshoot the Redfish listener
Categories:
Start with Kubernetes readiness, then check listener configuration, ZAPP Aggregator connectivity, Redfish access, and telemetry validation.
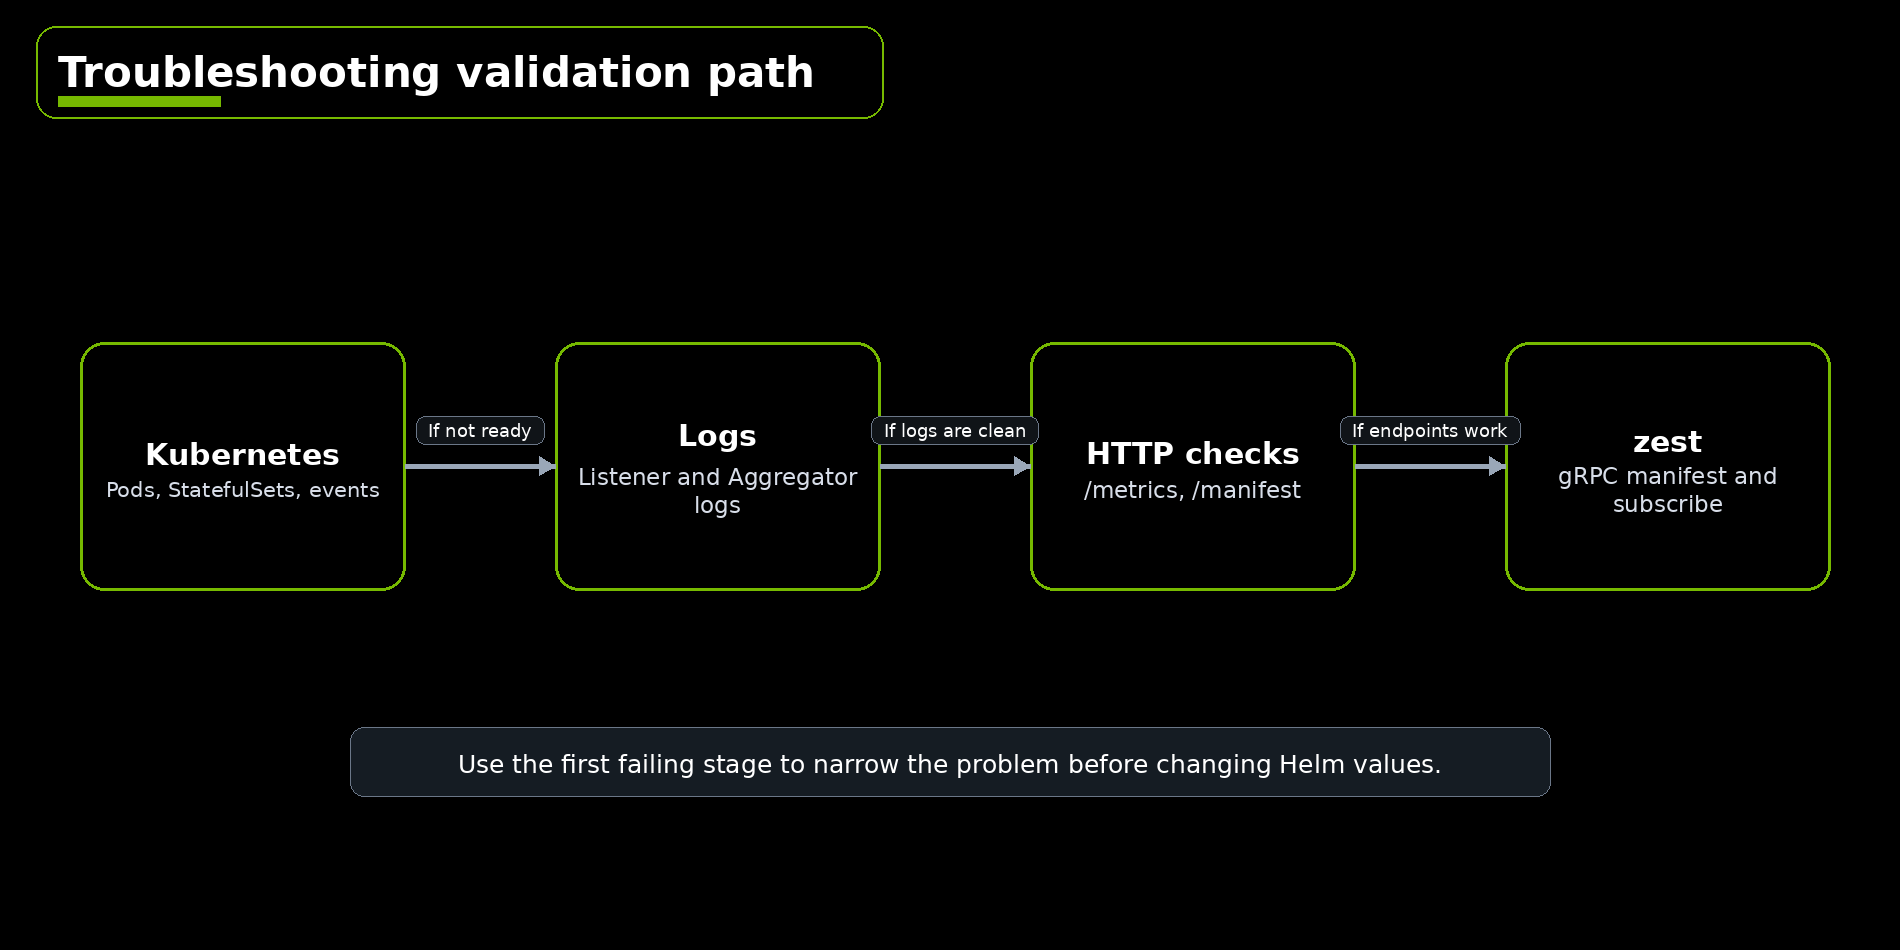
Use Kubernetes checks, HTTP monitoring endpoints, and zest to isolate Redfish listener deployment problems.
Check pods and releases
helm list --namespace <namespace>
kubectl get pods --namespace <namespace>
kubectl get statefulsets --namespace <namespace>
If a pod is not ready, describe it and inspect recent events:
kubectl describe pod <pod-name> --namespace <namespace>
kubectl get events --namespace <namespace> --sort-by=.lastTimestamp
Check listener logs
kubectl logs statefulset/zapp-listener-redfish --namespace <namespace> --tail=200
Look for errors related to:
- Missing or malformed secret files
- Missing
${secrets.<name>}values - Redfish endpoint authentication
- Redfish TLS certificate verification
- Missing
envPlugins.sensorPipeline.redfishDevices - ZAPP Aggregator connection failures
Check ZAPP Aggregator logs
kubectl logs statefulset/zapp-aggregator --namespace <namespace> --tail=200
Look for listener connection events, UDP telemetry ingest errors, and subscriber gRPC server errors.
Validate metrics and manifest endpoints
Port-forward the ZAPP Aggregator metrics service:
kubectl --namespace <namespace> port-forward svc/zapp-aggregator-metrics 8888:8888
Check metrics:
curl http://localhost:8888/metrics
Check the manifest:
curl http://localhost:8888/manifest.json
If /metrics works but /manifest is unavailable, confirm manifestUI: true in the chart values or the --manifest-ui flag.
Validate telemetry with zest
Use zest after the ZAPP Aggregator pod is ready and the ZAPP Aggregator client gRPC service is reachable.
Port-forward the ZAPP Aggregator client gRPC service:
kubectl --namespace <namespace> port-forward svc/zapp-aggregator-client 19999:9999
Print the sensor manifest:
./target/dist/zest_linux_amd64_v1/zest grpc \
  --address localhost:19999 \
  sensormanifest
Subscribe to telemetry with a filter:
./target/dist/zest_linux_amd64_v1/zest grpc \
  --address localhost:19999 \
  subscribe "Unit=='PowerW'"
If sensormanifest returns sensors but subscribe does not show telemetry, focus on the listener pipeline, Redfish polling, and payload forwarding. If zest cannot connect, focus on the ZAPP Aggregator client gRPC service, port-forwarding, and gRPC transport security settings.
Common fixes
Use these checks for common deployment issues:
| Symptom | Check |
|---|---|
| Listener chart fails to render | Set zapp.aggregatorHost when any listener is enabled |
| Listener pod starts then exits | Check secret file keys and pipeline YAML expansion |
| Redfish discovery fails | Check the baseboard management controller URL, credentials, network reachability, and TLS settings |
| Manifest is empty | Check envPlugins.sensorPipeline.redfishDevices and listener logs |
| Metrics work but manifest page is disabled | Set manifestUI: true |
zest cannot connect | Port-forward svc/zapp-aggregator-client and verify client gRPC port 9999 |