


NVIDIA CUDA-X Libraries for Data Science Visualization Guide#
NVIDIA CUDA-X libraries for data science can easily fit in visualization workflows. This catalog of featured libraries offer direct cuDF support or easy integration.
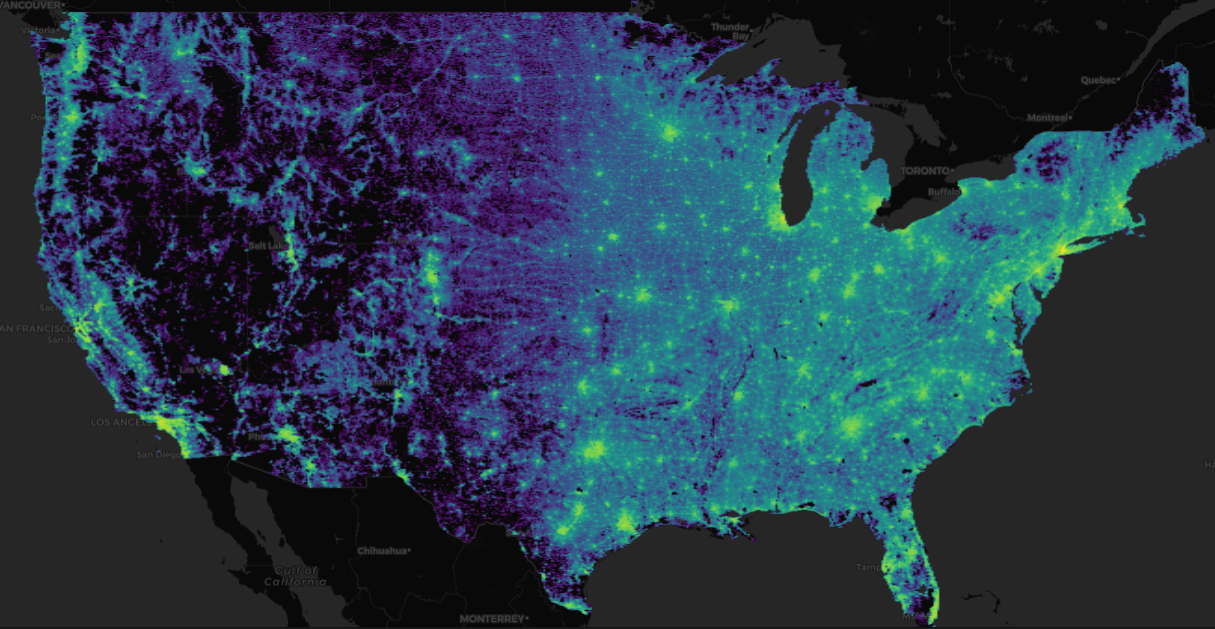
330 million+ datapoints rendered in under 1.5s with cuDF and Plotly Dash in the 2020 Census demo
Featured Libraries#
HoloViews: Declarative objects for quickly building complex interactive plots from high-level specifications. Directly uses cuDF.
hvPlot: Quickly return interactive plots from cuDF, Pandas, Xarray, or other data structures. Just replace
.plot()with.hvplot().Datashader: Rasterizing huge datasets quickly as scatter, line, geospatial, or graph charts. Directly uses cuDF.
Plotly: Charting library that supports Plotly Dash for building complex analytics applications.
Bokeh: Charting library for building complex interactive visualizations.
Seaborn: Static single charting library that extends matplotlib.
Other Notable Libraries#
GPU Accelerated Interaction#
The below libraries directly use NVIDIA cuDF/Dask-cuDF and/or cuSpatial to create charts that support accelerated crossfiltering or rendering:
Note
Web Hosted vs Local Hosted Chart Interaction
When interacting with this page through a website, the interactive examples below are all static and use pre-computed data.
Featured Libraries#

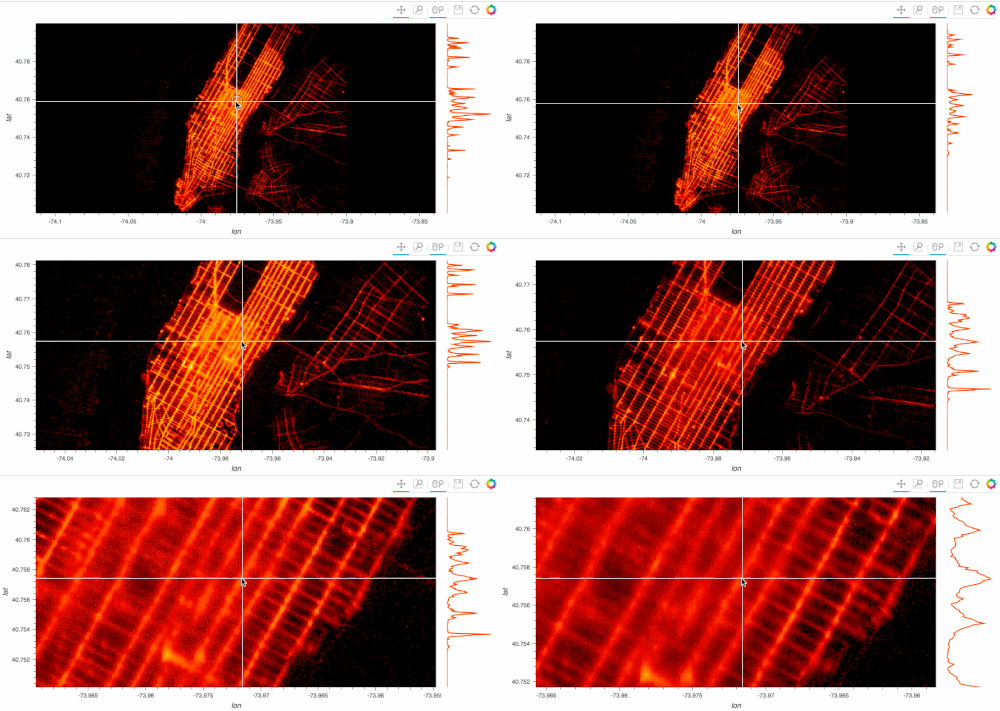
HoloViews is an open-source Python library designed to make data analysis and visualization seamless and simple. See this diagram for an excellent architecture overview.
With HoloViews, you can usually express what you want to do in very few lines of code, letting you focus on what you are trying to explore and convey, not on the process of plotting.
Read about Holoviews at holoviews.org and explore its gallery holoviews.org/gallery/.
Read about CUDA-X libraries for data science compatibility.
Run an interactive example and cpu / gpu code comparison below:

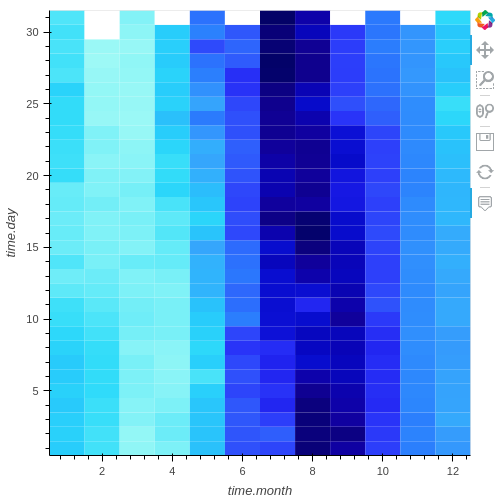
hvPlot provides an alternative for the static plotting API provided by Pandas and other libraries, with an interactive plotting API. Just replace
.plot()with.hvplot().hvPlot can integrate neatly with the individual libraries if an extension mechanism for the native plot APIs is offered, or it can be used as a standalone component.
Read about hvPlot at holoviews.org and explore its gallery hvplot.holoviz.org/reference/index.html.
Read about CUDA-X libraries for data science compatibility.
Run an interactive example and cpu / gpu code comparison below:

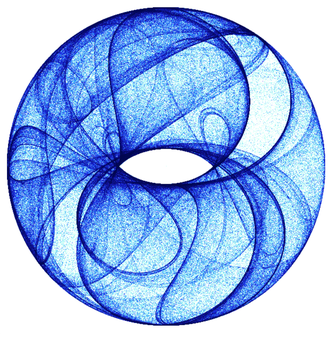
Datashader is a graphics pipeline system for creating meaningful representations of large datasets quickly and flexibly.
Datashader is able to render a variety of chart types statically, and interactively when combined with other libraries like HoloViews.
Read about Datashader at datashader.org and explore its examples.
Read about CUDA-X libraries for data science compatibility.
Run an interactive example and cpu / gpu code comparison below:

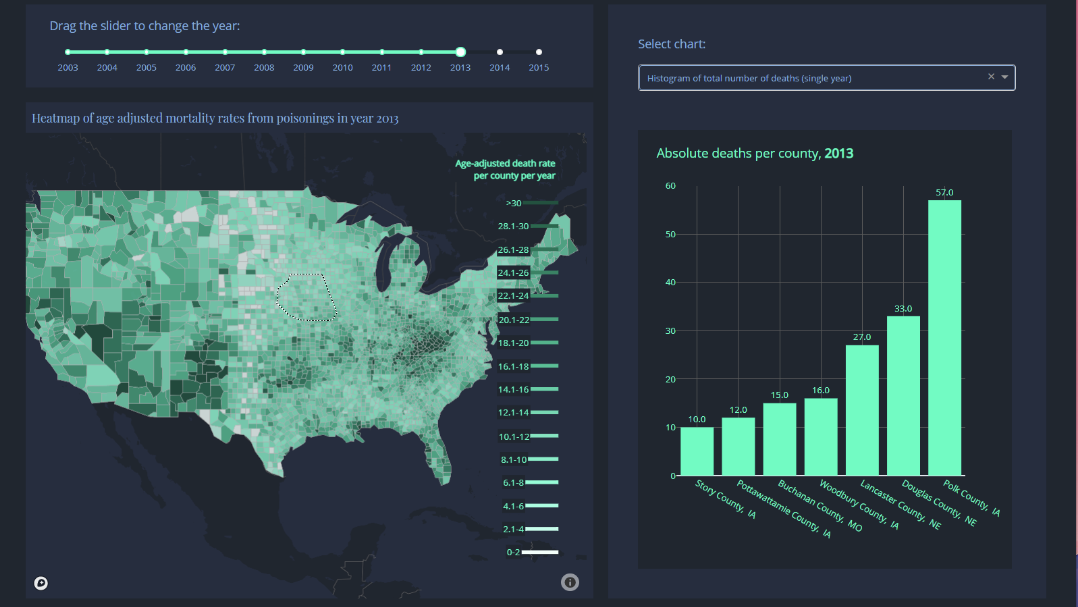
Plotly provides browser based graphing, analytics, and statistics tools to create powerful applications.
Read about Plotly’s Python charting library at plotly.com/python/ and explore the Plotly Dash gallery ash.gallery/Portal/.
Read about NVIDIA Data Science compatibility.
Run an interactive example and cpu / gpu code comparison below:

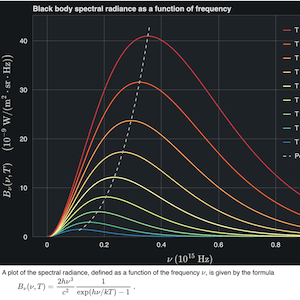
Bokeh makes it simple to create common interactive plots, but also can handle custom or specialized use-cases with tools and widgets.
Plots, dashboards, and apps can be published in web pages or Jupyter notebooks.
Read about Bokeh at bokeh.org/ and explore its demo page demo.bokeh.org/.
Further Documentation.
Run an interactive example and cpu / gpu code comparison below:

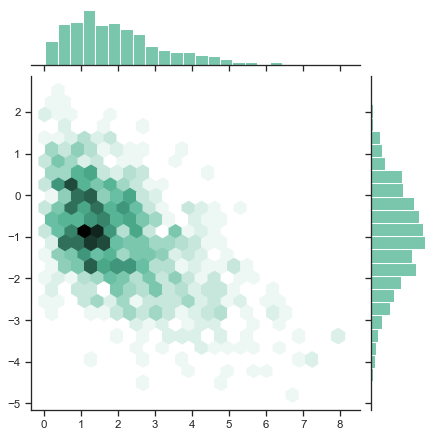
Seaborn is a Python data visualization library based on matplotlib. It provides a high-level interface for drawing static charts.
Although not directly accelerated with GPU usage, it provides a base example of using a popular Python based visualization library with NVIDIA Data Science libraries.
Read about Seaborn at seaborn.pydata.org/ and explore its gallery seaborn.pydata.org/examples/index.html.
Further Documentation.
Run an interactive example and cpu / gpu code comparison below:
Other Notable Libraries#

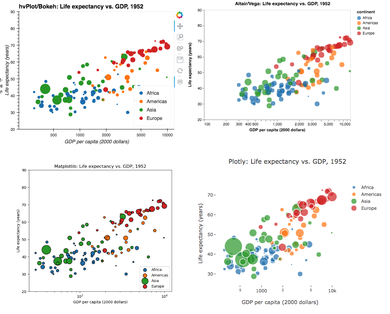
Panel is a Python library that lets you create custom interactive web apps and dashboards by connecting user-defined widgets to plots, images, tables, or text.
Panel -like holoViews, hvPlot, and datashader- is part of the HoloViz Ecosystem.
Panel works well within the Python visualization ecosystem and is what powers the interactive tools on this page.
Read more about Panel at panel.holoviz.org/ and explore its gallery panel.holoviz.org/reference/.
Further Documentation.

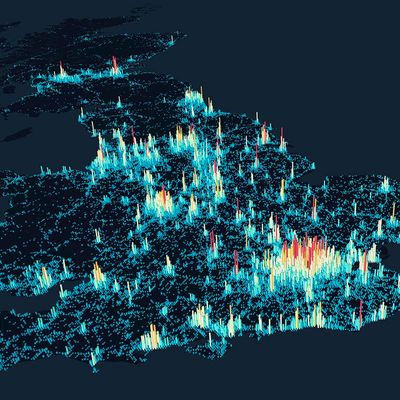
The pyDeck library is a set of Python bindings for making spatial visualizations with deck.gl, optimized for a Jupyter environment.
Learn more about its core deck.gl webGL based library a deck.gl.
Read about pyDeck at pydeck.gl/ and explore its gallery pydeck gallery.
Further Documentation.