COCO Reader with augmentations
Reader operator that reads a COCO dataset (or subset of COCO), which consists of an annotation file and the images directory.
In [1]:
from nvidia.dali.pipeline import Pipeline
import nvidia.dali.ops as ops
import nvidia.dali.types as types
import numpy as np
from time import time

subset = "val"
file_root = "/data/coco/coco-2017/coco2017/" + subset + "2017"
annotations_file = "/data/coco/coco-2017/coco2017/annotations/instances_" + subset + "2017.json"
num_gpus = 1
batch_size = 16
Create reader, decoder and flip operator for images and bounding boxes
In [1]:
class COCOPipeline(Pipeline):
    def __init__(self, batch_size, num_threads, device_id):
        super(COCOPipeline, self).__init__(batch_size, num_threads, device_id, seed = 15)
        self.input = ops.COCOReader(file_root = file_root, annotations_file = annotations_file,
                                     shard_id = device_id, num_shards = num_gpus, ratio=True, ltrb=True)
        self.decode = ops.nvJPEGDecoder(device = "mixed", output_type = types.RGB)
        self.flip = ops.Flip(device = "gpu")
        self.bbflip = ops.BbFlip(device = "cpu", ltrb=True)
        self.paste_pos = ops.Uniform(range=(0,1))
        self.paste_ratio = ops.Uniform(range=(1,2))
        self.coin = ops.CoinFlip(probability=0.5)
        self.coin2 = ops.CoinFlip(probability=0.5)
        self.paste = ops.Paste(device="gpu", fill_value=(32,64,128))
        self.bbpaste = ops.BBoxPaste(device="cpu", ltrb=True)
        self.prospective_crop = ops.RandomBBoxCrop(device="cpu",
                                                   aspect_ratio=[0.5, 2.0],
                                                   thresholds=[0.1, 0.3, 0.5],
                                                   scaling=[0.8, 1.0],
                                                   ltrb=True)
        self.slice = ops.Slice(device="gpu")

    def define_graph(self):
        rng = self.coin()
        rng2 = self.coin2()

        inputs, bboxes, labels = self.input()
        images = self.decode(inputs)

        # Paste and BBoxPaste need to use same scales and positions
        ratio = self.paste_ratio()
        px = self.paste_pos()
        py = self.paste_pos()
        images = self.paste(images, paste_x = px, paste_y = py, ratio = ratio)
        bboxes = self.bbpaste(bboxes, paste_x = px, paste_y = py, ratio = ratio)

        crop_begin, crop_size, bboxes, labels = self.prospective_crop(bboxes, labels)
        images = self.slice(images, crop_begin, crop_size)

        images = self.flip(images, horizontal = rng, vertical = rng2)
        bboxes = self.bbflip(bboxes, horizontal = rng, vertical = rng2)

        return (images, bboxes, labels)
In [1]:
start = time()
pipes = [COCOPipeline(batch_size=batch_size, num_threads=2, device_id = device_id)  for device_id in range(num_gpus)]
for pipe in pipes:
    pipe.build()
total_time = time() - start
print("Computation graph built and dataset loaded in %f seconds." % total_time)
Computation graph built and dataset loaded in 0.806041 seconds.
In [1]:
pipe_out = [pipe.run() for pipe in pipes]

images_cpu = pipe_out[0][0].asCPU()
bboxes_cpu = pipe_out[0][1]
labels_cpu = pipe_out[0][2]
Bounding boxes returned by the operator are lists of floats containing
composed of [x, y, width, height] (ltrb is set to False by
default).
In [1]:
img_index = 4

bboxes = bboxes_cpu.at(4)
bboxes
Out[1]:
array([[0.35708272, 0.21298414, 0.352189  , 0.7121075 ],
       [0.37862933, 0.71613264, 0.09204113, 0.06887318],
       [0.6494654 , 0.7192394 , 0.10438591, 0.08285372],
       [0.78857094, 0.8646966 , 0.00974649, 0.02165389],
       [0.8066002 , 0.7938396 , 0.0078176 , 0.01560879],
       [0.47354117, 0.7297014 , 0.03550252, 0.04429971],
       [0.799645  , 0.75910354, 0.03041941, 0.03426814],
       [0.7725954 , 0.7599083 , 0.01058605, 0.02788615],
       [0.1961242 , 0.6791882 , 0.15198362, 0.20955788],
       [0.3789811 , 0.71845335, 0.09318709, 0.06655245],
       [0.33182585, 0.7102747 , 0.04951525, 0.07387023],
       [0.8793073 , 0.8202472 , 0.00593411, 0.00645685]], dtype=float32)
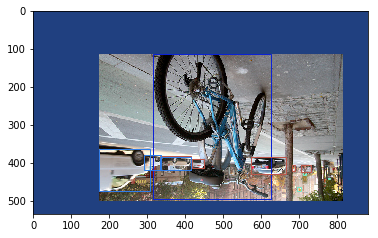
Let’s see the ground truth bounding boxes drawn on the image.
In [1]:
import matplotlib.pyplot as plt
import matplotlib.patches as patches
import random

img = images_cpu.at(img_index)

H = img.shape[0]
W = img.shape[1]
fig,ax = plt.subplots(1)

ax.imshow(img)
bboxes = bboxes_cpu.at(img_index)
labels = labels_cpu.at(img_index)
categories_set = set()
for label in labels:
    categories_set.add(label[0])

category_id_to_color = dict([ (cat_id , [random.uniform(0, 1) ,random.uniform(0, 1), random.uniform(0, 1)]) for cat_id in categories_set])

for bbox, label in zip(bboxes, labels):
    rect = patches.Rectangle((bbox[0]*W,bbox[1]*H),bbox[2]*W,bbox[3]*H,linewidth=1,edgecolor=category_id_to_color[label[0]],facecolor='none')
    ax.add_patch(rect)

plt.show()