COCO Reader
Reader operator that reads a COCO dataset (or subset of COCO), which consists of an annotation file and the images directory.
[1]:
from __future__ import print_function
from nvidia.dali.pipeline import Pipeline
import nvidia.dali.ops as ops
import nvidia.dali.types as types
import numpy as np
from time import time
import os.path

test_data_root = os.environ['DALI_EXTRA_PATH']
file_root = os.path.join(test_data_root, 'db', 'coco', 'images')
annotations_file = os.path.join(test_data_root, 'db', 'coco', 'instances.json')

num_gpus = 1
batch_size = 16
[2]:
class COCOPipeline(Pipeline):
    def __init__(self, batch_size, num_threads, device_id):
        super(COCOPipeline, self).__init__(batch_size, num_threads, device_id, seed = 15)
        self.input = ops.COCOReader(file_root = file_root, annotations_file = annotations_file,
                                     shard_id = device_id, num_shards = num_gpus, ratio=True)
        self.decode = ops.ImageDecoder(device = "mixed", output_type = types.RGB)

    def define_graph(self):
        inputs, bboxes, labels = self.input()
        images = self.decode(inputs)
        return (images, bboxes, labels)
[3]:
start = time()
pipes = [COCOPipeline(batch_size=batch_size, num_threads=2, device_id = device_id)  for device_id in range(num_gpus)]
for pipe in pipes:
    pipe.build()
total_time = time() - start
print("Computation graph built and dataset loaded in %f seconds." % total_time)
Computation graph built and dataset loaded in 0.182731 seconds.
[4]:
pipe_out = [pipe.run() for pipe in pipes]

images_cpu = pipe_out[0][0].as_cpu()
bboxes_cpu = pipe_out[0][1]
labels_cpu = pipe_out[0][2]
Bounding boxes returned by the operator are lists of floats containing composed of [x, y, width, height] (ltrb is set to False by default).
[5]:
bboxes = bboxes_cpu.at(4)
bboxes
[5]:
array([[0.18020679, 0.3982103 , 0.06942393, 0.55480987]], dtype=float32)
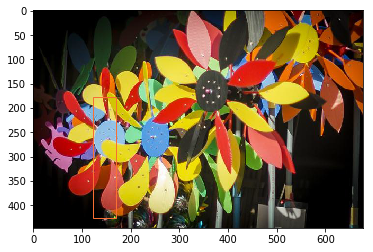
Let’s see the ground truth bounding boxes drawn on the image.
[6]:
import matplotlib.pyplot as plt
import matplotlib.patches as patches
import random

img_index = 4

img = images_cpu.at(img_index)

H = img.shape[0]
W = img.shape[1]

fig,ax = plt.subplots(1)

ax.imshow(img)
bboxes = bboxes_cpu.at(img_index)
labels = labels_cpu.at(img_index)
categories_set = set()
for label in labels:
    categories_set.add(label[0])

category_id_to_color = dict([ (cat_id , [random.uniform(0, 1) ,random.uniform(0, 1), random.uniform(0, 1)]) for cat_id in categories_set])

for bbox, label in zip(bboxes, labels):
    rect = patches.Rectangle((bbox[0]*W,bbox[1]*H),bbox[2]*W,bbox[3]*H,linewidth=1,edgecolor=category_id_to_color[label[0]],facecolor='none')
    ax.add_patch(rect)

plt.show()