Export Settings
Export your logs and metrics data to your own storage.
DGX Cloud Lepton provides a way to export your logs and metrics data to your own storage or analytics platform.
Only workspace admins can set up the export settings.
How to Set Up
- Login to the DGX Cloud Lepton Dashboard.
- Navigate to the Observability settings page
- You can see two export configurations:
- Logs Export: Exports logs for all workloads created in this workspace. Logs are streamed in real time to the specified external destination.
- Metrics Export: Collects and exports all custom metrics instrumented by developers within their applications from workloads created in this workspace.
Logs Configuration
Destination Type
Currently, we only support exporting logs to Datadog.
Endpoint URL
The endpoint URL is the URL of your Datadog instance. Learn more about obtaining the endpoint URL from the Datadog documentation.
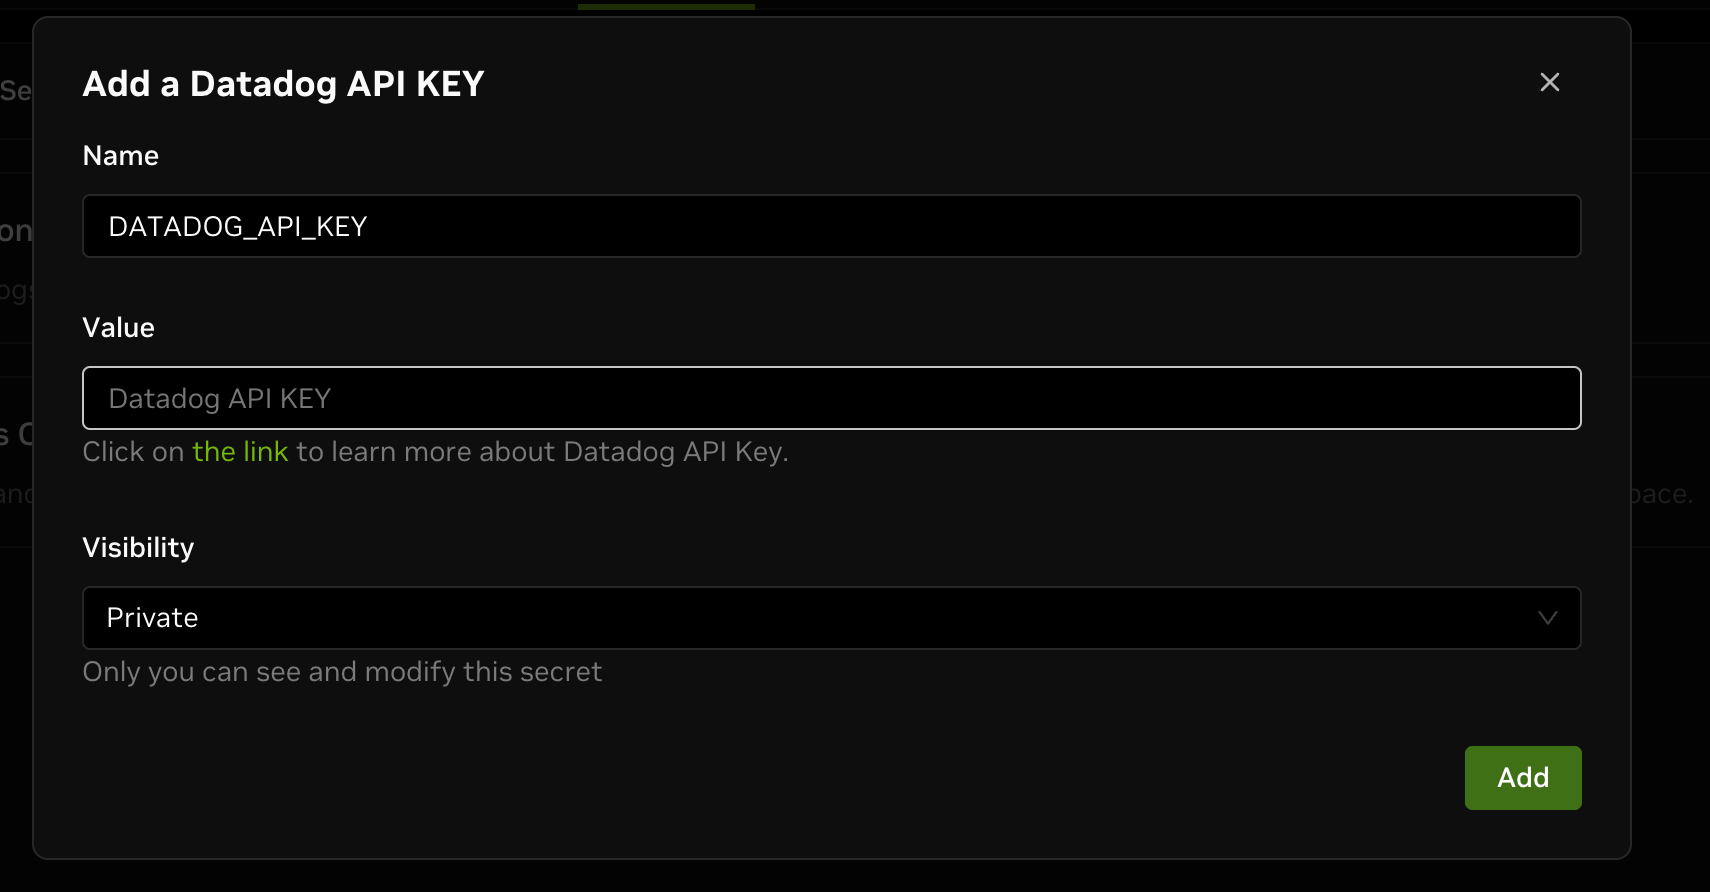
Secret Key
Select the secret key for your Datadog instance. You can add the secret key directly here or under Settings -> Secrets in the DGX Cloud Lepton dashboard. Refer to this guide for more details.
For Datadog secret key, refer to the official documentation for more details.
Metrics Configuration
Destination Type
Currently, we only support exporting metrics to Datadog.
Endpoint URL
The endpoint URL is the URL of your Datadog instance. Learn more about obtaining the endpoint URL from the Datadog documentation.
Secret Key
Select the secret key of your Datadog instance. You can add the secret key directly here or under Settings -> Secrets in the DGX Cloud Lepton dashboard. Refer to this guide for more details.
For Datadog secret key, refer to the official documentation for more details.
Enable Metrics Export When Creating Workload
To collect and export metrics from workloads, enable metrics export when creating the workload and specify the export port and path.
You can specify the export port and path under Advanced Configuration when creating the workload.
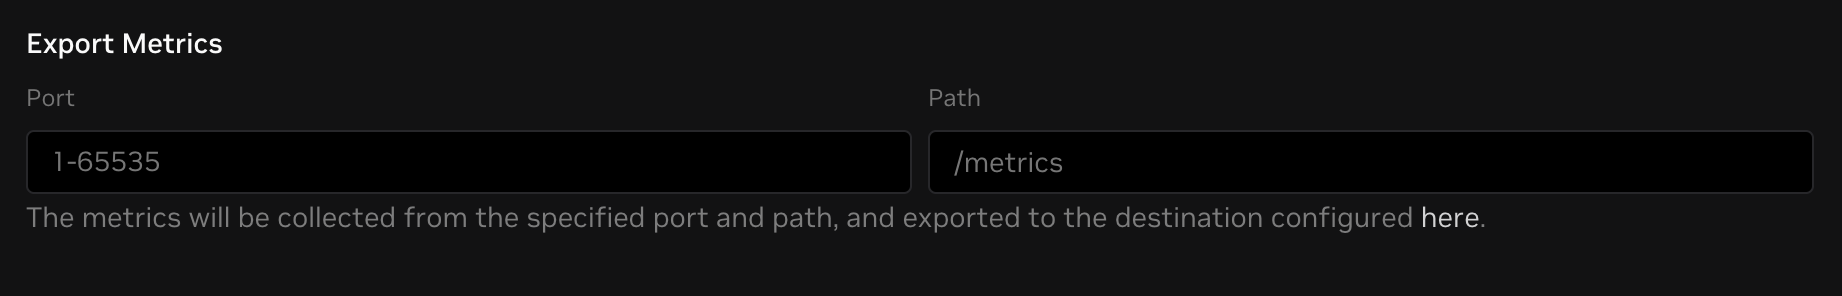
The DGX Cloud Lepton platform expects your workload application provide an HTTP endpoint that serves metrics in Prometheus format on the specified port and path. Most applications use the official Prometheus library.
For Python applications, handle HTTP requests as shown in the example below. Configure the export port as 8080 and the path as /metrics.
Example output from the endpoint includes:
http_response_time_seconds is a metric emitted by the above application.
Find more details about the Prometheus Python library in the official documentation.
Labels of logs and metrics
This table contains DGX Cloud Lepton platform-specific labels attached to exported logs and metrics. These labels are available in the export destination (for example, Datadog) and can be used for filtering logs and metrics.
| Label | Description |
|---|---|
lepton_job_name | Job name, only available for metrics from lepton job |
lepton_deployment_name | Deployment name, only available for metrics from lepton endpoint and dev pod |
lepton_replica_id | Replica ID |
lepton_workspace | Lepton workspace ID |