|
|
DriveWorks SDK Reference| 0.6.67 Release |
|
|
DriveWorks SDK Reference| 0.6.67 Release |
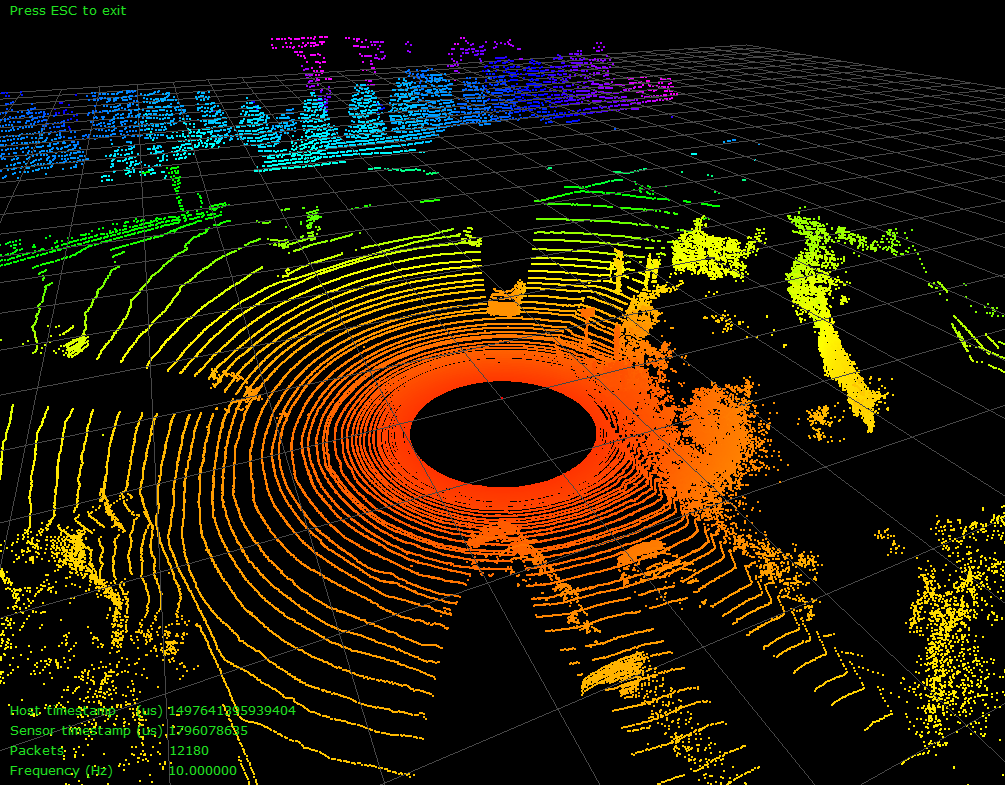
The Lidar Replay sample demonstrates how to connect to a Lidar and visualizes the generated point cloud in 3D.
The command line for the sample to display live Lidar point clouds is:
./sample_lidar_replay --protocol=[lidar protocol] --params=device=[type of device],ip=[lidar IP address],port=[lidar port],scan-frequency=[valid frequency] (--show-intensity=[true])
The command line for the sample to display live Lidar point clouds is:
./sample_lidar_replay --file=[lidar file]
The sample opens an X window to display a 3D point cloud. Use the mouse to interact with the visualization:
Color is rendered by 2D distance from the origin where red is near and blue is far. An alternative hue based rendering mode is available by setting –show-intensity=true flag in the commnand line. This mode renders intensity porportional to wavelength with higher intensities in blue and lower intensities in red