Introduction to NVIDIA Nsight Graphics
NVIDIA Nsight Graphics™ is a standalone application for the debugging, profiling, and analysis of graphics applications. NVIDIA Nsight Graphics supports applications built with DirectCompute, Direct3D (11, 12), OpenGL, Vulkan, Oculus SDK, and OpenVR.
This documentation is separated up into different sections to help you understand how to get started using the software, understand activities, and offer a reference on the user interface.
-
Getting Started - Offers a brief introduction on how to use the tools.
-
Activities - NVIDIA Nsight Graphics Supports multiple activities to target your workload to the need of your work at a particular point in time. This section documents each of these activities in detail.
-
User Interface Reference - Provides a deep view of all of the user interface elements and views that NVIDIA Nsight Graphics offers.
-
Appendix - Contains a selection of topics on concerns not covered by any other section.
Getting Started
This section describes an approach to using the NVIDIA Nsight Graphics tools.
Expected Workflow
When debugging or profiling, it is important to narrow your investigation to the path that provides the most impactful and actionable data for you to make conclusions and solve problems. NVIDIA Nsight Graphics provides a number of tools to fit each of these workflow scenarios.
When debugging a rendering problem, NVIDIA Nsight Graphics's Frame Debugger is the tool of choice. This tool enables the inspection of events, API state, resource values, and dependencies to understand where your application might have issues. For more information on the Frame Debugger, see Frame Debugger.
When profiling a graphical application, the first step is to determine if you are CPU or GPU bound. If you are CPU bound, you will not be able to issue enough work to the GPU to take full advantage of its full processing power. If you are GPU bound, the GPU is not able to process the work it is issued fast enough and your engine may stall. One way of making the determination of which aspect is limiting you is to use Nsight Systems™. Nsight Systems is a system-wide performance analysis tool designed to visualize an application’s algorithms, help you select the largest opportunities to optimize, and tune to scale efficiently across any quantity of CPUs and GPUs in your computer. NVIDIA also provides a system analysis and trace tool within Nsight Visual Studio Edition; for more information on that tool see this site.
If you have determined that you are CPU bound, you will want to use a CPU profiling tool to discover how you can eliminate inefficiencies to issue work faster to the GPU. You may also want to look into the overhead of the API constructs you are using and determine if there are more lighter weight constructs that can offer the same effect at less cost. The Frame Debugger tool is an excellent resource while you are making these adjustments to your engine.
When GPU bound, you will want to determine where and how you are limited by the GPU. NVIDIA Nsight Graphics 's profiling tools can offer you this information. For a quick, high-level evaluation of your GPU performance, the real-time frame performance graphs that NVIDIA Nsight Graphics provides can offer you a continuous look at your performance as you navigate your scene. For a detailed, per-range analysis of your GPU performance, you can use the Range Profiler to gather this information. This analysis can help you to determine whether you need to optimize your shaders, render target and texture usage, or memory configuration.
The GPU Trace activity within NVIDIA Nsight Graphics allows for analysis of a few different GPU bound scenarios. GPU Trace offers a deep analysis of your SM's performance by tracing the execution of your shaders on the SM across a series of frames. Another key technique in optimizing performance is to take advantage of the GPUs ability to process parallel work by using techniques to achieve simultaneous compute and graphics (SCG), also known as async compute. GPU Trace allows you to both see opportunities for async compute as well as to confirm and measure the impact of async compute on your frame.
How to Launch and Connect to Your Application
To analyze an application, NVIDIA Nsight Graphics requires the launching of applications through its launching facilities.
Upon starting Nsight Graphics, you are presented with the option to create a project. If you are using NVIDIA Nsight Graphics for the first time, skip project creation by selecting continue under Quick Launch.
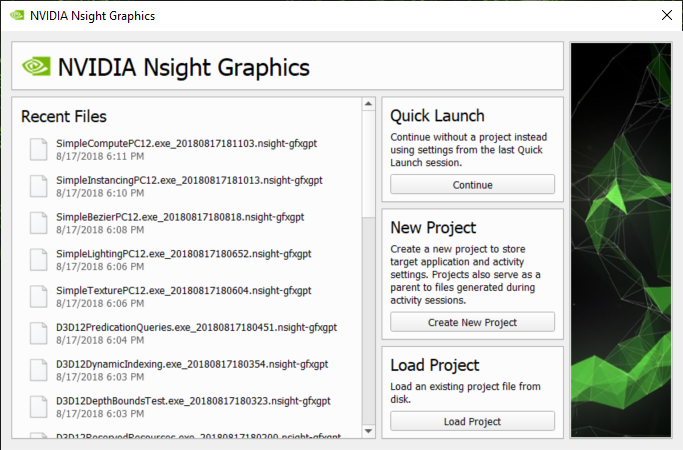
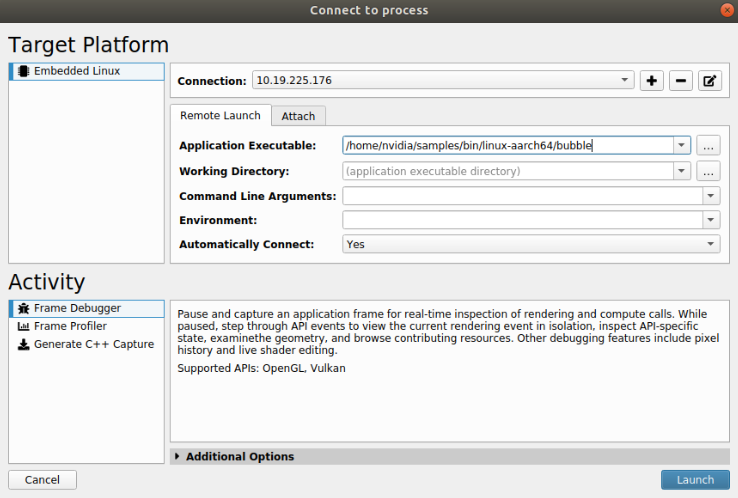
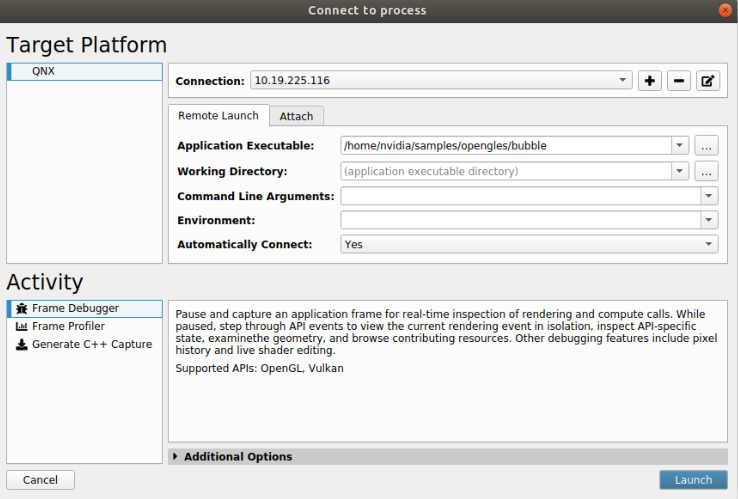
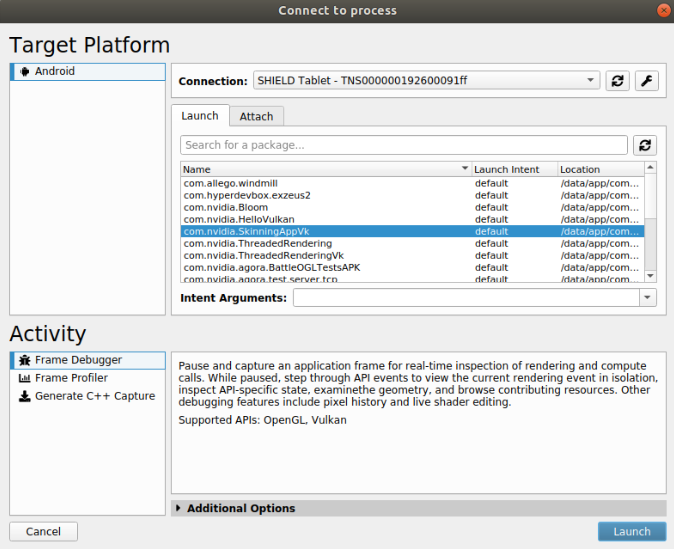
Once selected, you will be presented with a target-specific dialog that allows you to configure the application to launch. Browse and select the activity you wish to run and then proceed to the target-specific instructions below to configure the application to analyze.
Process Launch and Connection on Windows Targets
Launching a Native, Single-Process Application
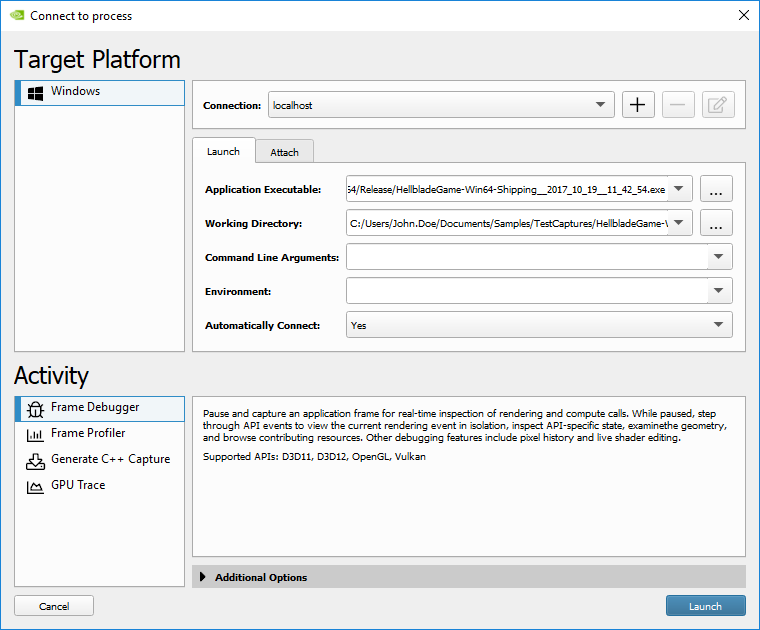
Launching a single-process application is simple. To launch a native, single-process application:
-
Set the application executable to the path of your application.
-
If your application requires a working directory that is different from your application's directory, adjust it now.
-
Adjust the environment (if necessary).
-
Leave Automatically Connect as Yes.
-
Click Launch.
Once launched, you will be presented with a dialog that notes the launching and attaching of your application. After the launch completes, you are ready to begin your analysis.
Launching a Native, Multi-Process Application
Launching a multi-process application requires that you select the child process that you wish to attach to. To launch a native, multi-process application:
-
Set the application executable to the path of your application.
-
If your application requires a working directory that is different from your application's directory, adjust it now.
-
Adjust the environment (if necessary).
-
Set Automatically Connect to No.
-
Click Launch.
-
You will be presented with a dialog that notes the launching of your batch file. Once launched, go to the Attach tab.
-
Select the application you wish to analyze in the attach tab and click Attach.
After the launch completes you are ready to being your analysis.
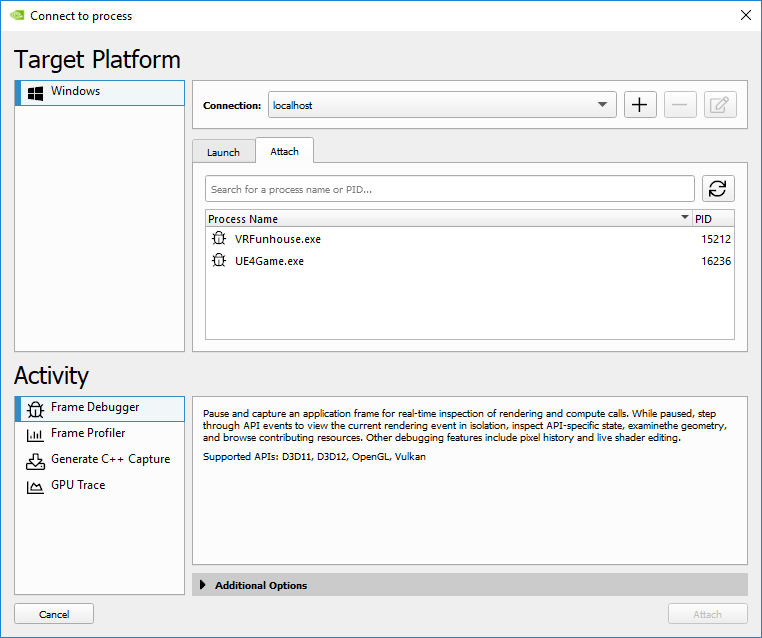
In the example image above, VRFunhouse.exe is a child process of the UE4Game.exe launcher. Selecting VRFunhouse.exe and clicking Attach would allow you to analyze the primary application.
Launching a Batch File
Launching a batch file is supported through launching by way of Windows' command prompt application. To launch a batch file:
-
Set the application executable to C:\Windows\system32\cmd.exe
-
Set the working directory to the one in which your batch file is expected to be launched.
-
Set the command line arguments to: /c fullpathto/yourscript.bat
where fullpathto/yourscript.bat is the full path to your script.
-
Set Automatically Connect to No.
-
Click Launch.
-
You will be presented with a dialog that notes the launching of your batch file. Once launched, go to the Attach tab.
-
Select the application you wish to analyze in the attach tab and click Attach.
Launching a Steam Game
Launching a Steam game requires that Steam be launched through NVIDIA Nsight Graphics before the game is launched. To launch a Steam game:
-
Ensure that all existing Steam processes are closed.
-
Set the application executable to C:\Program Files (x86)\Steam\Steam.exe
-
Set Automatically Connect to No.
-
You will be presented with a dialog that notes the launching of your batch file. Once launched, go to the Attach tab.
-
Select the application you wish to analyze in the attach tab and click Attach.
After the launch completes you are ready to begin your analysis.
Launching an Origin Game
Launching an Origin game requires that Origin be launched through NVIDIA Nsight Graphics before the game is launched. To launch an Origin game:
-
Ensure that all existing Origin processes are closed.
-
Set the application executable to
C:\Program Files (x86)\Origin\Origin.exe
-
Set Automatically Connect to No.
-
You will be presented with a dialog that notes the launching of your batch file. Once launched, go to the Attach tab.
-
Select the application you wish to analyze in the attach tab and click Attach.
After the launch completes you are ready to begin your analysis.
Remote Launching
Remote debugging is supported on NVIDIA Nsight Graphics on Windows through use of the Nsight Remote Monitor. This is a process that runs on a target machine to allow connections to be started on that machine.
To run the remote monitor, install NVIDIA Nsight Graphics on the target machine. Then, launch the remote monitor on that machine by Start > NVIDIA Corporation > Nsight Remote Monitor.
Once the monitor is launched on the remote machine, you need to add the remote monitor as a connection in NVIDIA Nsight Graphics. By default, launches will be done on the localhost machine. To add another machine, click the + button.

This brings up a dialog in which you can add a machine name or IP address.
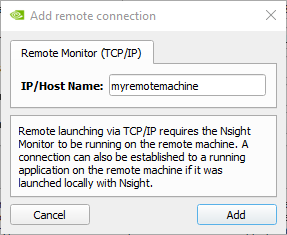
Enter the machine name in IP/Host Name. Click Add to add the connection. The machine you just added will be listed as the target connection at this time.

Any number of connections may be added; connections can be removed by clicking - on the selected connection. The connections may be switched between any of the added connections before launch or attach. Connections are globally persisted and may be applied to any project once they are added.
Process Launch and Connection on Linux Targets
Remote debugging on Linux is supported through SSH connections. Enter your SSH information when establishing the connection to connect to the target machine.
Process Launch from a Command Line
NVIDIA Nsight Graphics offers a command line launcher to facilitate launching on applications for which the environment setup can be complex to transfer to the host application. This executable is located in the host application folder:
Windows
<install directory>/host/windows-desktop-nomad-x64/nv-nsight-launcher.exe
Linux
<install directory>/host/linux-desktop-nomad-x64/nv-nsight-launcher.bin
Command Line Tool Arguments Details
To understand how to launch, start by launching the command line tool with the --help argument. This will display what a options the command line tool has.
Several of these arguments are optional, while some are required. The full argument list is the following:
-
--help: Display all available arguments.
-
--activity: Select target activity to use. Note: "activity name" must be exact name in "Activity" section of connection dialog.
-
--platform: Select target platform to use. Note: "platform name" must be exact name in "Target Platform" section of connection dialog.
-
--hostname: Select which device to launch application. Default value is "localhost".
-
--exe: Set executable path on target device.
-
--dir: Set working directory of the application to be launched.
-
--env: Set additional environments of the application to be launched.
-
--args: Set arguments passed to the application to be launched.
To launch succesfully, --exe is always required, --hostname is required if trying to launch application in a machine with nv-nsight-remote-monitor running, --activity and --platform is recommended to be set, otherwise they'll use values on NVIDIA Nsight Graphics UI.
Example:
nv-nsight-launcher.exe --activity="Frame Debugger" --platform="Windows"
--hostname=192.168.1.10 --exe=D:\Bloom\bloom.exe
After a Process is Connected
After a process is connected, it is ready to be analyzed. For many activities, a default set of windows will come up that offer an impactful set of tools for analysis that pertains to the activity. You can also add additional windows to the application by selecting a view from the menu bar. See the User Interface Reference for a detailed discussion of each view and tool window.
For the Frame Debugger activity that was started above, there are both live analysis and capture utilities. After experimenting with the live analysis tools, proceed into capture by selecting Capture for Live Analysis from the main toolbar. In NVIDIA Nsight Graphics, a number of views will open. On the target application, the HUD will appear with the toolbar and scrubber. This UI allows you to view an exhaustive amount of information on the state, resources, and synchronization of your application.
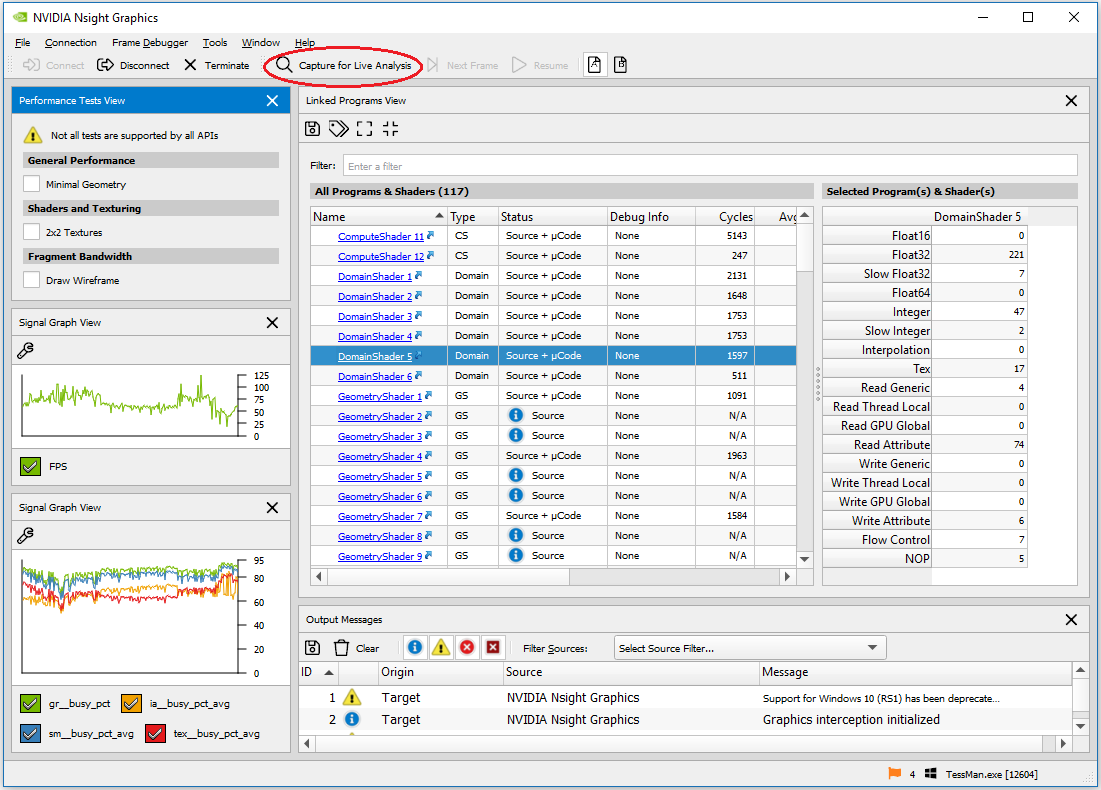
With such an expansive set of information available, debugging a rendering problem is made easier.
Configuring Your Application for Optimal Analysis
In order for your application to work well with the analysis tools provided by NVIDIA Nsight Graphics, there are a number of details you should consider when configuring your application.
Using Performance Markers
Performance markers are integral to nearly all workflows. We recommend that your application always run with perf markers when running under tools analysis.
Performance markers are most commonly used to delineate sections of events and note where in your application they begin and end. They can also be nested to show sub-sections of events. Perf markers are generally used to measure the amount of time that an inner portion of algorithm will take.
There are multiple different types of perf markers that are supported in NVIDIA Nsight Graphics:
-
D3D9 perf markers are supported for all D3D applications.
-
ID3DUserDefinedAnnotation may be used for D3D11 or D3D12 applications. See ID3DUserDefinedAnnotation interface on MSDN.
-
Perf markers made available by Microsoft's PIXBeginEvent/PixEndEvent APIs are supported for D3D12. See https://devblogs.microsoft.com/pix/winpixeventruntime/.
-
Vulkan applications may use either VK_EXT_debug_utils or VK_EXT_debug_marker.
-
OpenGL applications use the KHR_debug group, glPushDebugGroup and glPopDebugGroup.
-
The NVTX tools extension library provides API-agnostic perf markers and may be used with all applications.
Shader Compilation
NVIDIA Nsight Graphics works best when you have the full shader source available for debugging, as this . Follow the steps below to set up your application for optimal configuration.
D3D Configuration
NVIDIA Nsight Graphics works best with access to the original HLSL source code of your shaders. There are a few ways to accomplish this task. The first is to submit the HLSL source at startup time and compile your shaders, using D3DXCompileShader, etc. NVIDIA Nsight Graphics can intercept these calls to gain access to the HLSL source code and display it for debugging.
Alternatively, you can precompile the shaders into binary format using the same functions and saving the results out to a file, or use the offline compiler, fxc.exe, provided by the DirectX SDK. However, using this method, you need to specify some flags in order for the HLSL debug information to be embedded in the binary output, outlined below:
Naming Objects and Threads
Many of NVIDIA Nsight Graphics's views and analysis benefits from naming API objects and threads. Similar to perf markers, these names can help offer increased context for your analysis. The tables below list the supported methods for naming objects and threads.
| API | Method |
|---|---|
|
D3D11 |
No programmatic method; use Nsight-generated names |
|
D3D12 |
|
|
OpenGL |
|
|
Vulkan |
vkDebugMarkerSetObjectNameEXT or vkSetDebugUtilsObjectNameEXT |
How To Setup and Inspect GPU Crash Dumps
This section describes how to use NVIDIA Nsight Aftermath Monitor to generate GPU crash dumps for applications using the Direct3D 12 API, and how to open and inspect those GPU crash dumps with the crash dump inspector plug-in in NVIDIA Nsight Graphics.
Workflow
The general workflow for working with Nsight Aftermath GPU crash dumps is to:
-
Run the NVIDIA Nsight Aftermath GPU Crash Dump Monitor.
-
Configure GPU crash dump features.
-
Optional: if you want to collect additional information via event markers or to enable source-level shader mappings, you can optionally instrument the graphics application with Aftermath Library.
-
Run the graphics application for which to capture GPU crash dumps and reproduce the crash/TDR, allowing the monitor to collect the crash dump.
-
Open the GPU crash dump in NVIDIA Nsight Graphics.
-
Configure GPU Crash Dump Inspector settings.
-
Inspect the crash dump data using the NVIDIA Nsight Graphics crash dump inspector.
See the sections below for details on each step of this process.
The GPU Crash Dump Monitor
The NVIDIA Nsight Aftermath Crash Dump Monitor provides the means to capture GPU crash dump files for GPU crashes or GPU hangs, and to modify the driver configuration settings related to crash dump generation.
Running the GPU Crash Dump Monitor
The NVIDIA Nsight Aftermath Monitor nv-aftermath-monitor.exe is installed to the NVIDIA Nsight Graphics host directory. Typically this is:
C:\Program Files\NVIDIA Corporation\NVIDIA Nsight Graphics \host\windows-desktop-nomad-x64The crash dump monitor application will by default start in the background. Its user interface is accessible through the NVIDA Nsight Aftermath Monitor icon in the Microsoft Windows system notification area (system tray).
Configuring the GPU Crash Dump Monitor
All configuration options related to GPU crash dump creation are available through the GPU Crash Dump Monitor Settings dialog.
-
Set up directory where crash dump files are stored.
-
Set up directory where shader debug information files are stored.
-
Enable Aftermath GPU Crash Dump collection. Either set Aftermath mode to Global to enable crash dumps for all applications using the D3D12 API or selectively enable it for one or more applications by managing an application Whitelist.
-
Enable the desired Aftermath tracking features, like
-
Generate Shader Debug Information to generate DXIL-level or source level shader debug information to map GPU addresses of active shader warps at the time of a crash to DXIL shader line or HLSL source shader line.
-
Enable Resource Tracking to enable additional driver-side resource tracking to map GPU Virtual Addresses in page faults to still available or already released resources.
-
Enable Call Stack Capturing to enable additional driver-side tracking for draw calls, dispatches, or copies, including capturing call stacks. NOTE: As with other crash dumps, like Windows minidump files, when this feature is enabled the GPU crash dump file may contain the file path for the crashing applications executable as well as the file paths for all DLLs loaded by the application.
Modifying Aftermath settings requires Windows Administrator privileges. Therefore, when any of these settings are modified and applied, a User Account Control confirmation window may pop-up asking for permission to modify system settings.
-
The GPU Crash Dump Inspector
The NVIDIA Nsight Aftermath Crash Dump Inspector provides the means to open, inspect, and analyze GPU crash dump files created by the NVIDIA Nsight Aftermath Monitor.
Loading GPU Crash Dump Files
GPU crash dump files use the .nv-gpudmp file extension and can be loaded through File > Open File... This will bring up a GPU Crash Dump Inspector window displaying the crash dump file's content.
Configuring the GPU Crash Dump Inspector
In order to use all functionality provided by the GPU crash dump inspector, the following configuration settings should be made in the GPU Crash Dump Settings.
-
Add the directories where HLSL shader source files are stored to Shader Source Paths. If the shader sources cannot be found, the Shader View will not be able to display HLSL shader source.
-
Add the directories where binary shader files are stored to Shader Object Paths. If the binary shaders cannot be found, the Shader View will not be able to display DXIL shader code.
-
Add the directories where the shader debug info files written by the GPU crash dump monitor are stored to Shader Debug Info Paths. If the shaders debug info cannot be found, the Shader View will not be able to map GPU addresses of Active Warps to DXIL or HLSL shader code.
-
Add the directories where to find the PDB files for the application for which the GPU crash dump has been captured to PDB Search Paths. This allows the Aftermath Marker Call Stack View to resolve addresses to functions and source locations.
-
Add the directories where to find the PDB files for the application for which the GPU crash dump has been captured to PDB Search Paths. This allows the Aftermath Marker Call Stack View to resolve addresses to functions and source locations.
Inspecting GPU Crash Dump Files
Use the GPU Crash Dump Inspector to analyze crash reasons. This is not an exhaustive tutorial on how to analyze GPU crash dumps, because every crash or hang is different, but it should provide some hints to get started.
After loading a crash dump file, it is usually a good start to check the Exception Summary on the Dump Info tab. This will show a high-level fault reason, e.g. whether the graphics device was hung or an error like a page fault has occurred.
In case of a hang it makes sense to check if there is an Active Warps section on the Dump Info tab showing shader activity. This could point towards an issue with very long running shader warps or shader warps being stuck in an infinite loop. In that case the Shader View may help to root cause the problem.
If the device state indicates there was a memory fault, the next step would be to look for a Page Fault section on the Dump Info tab. This may help to pin point problems with out-of-bounds resource access or accessing an already deleted resource.
If the application was instrumented with Aftermath Event markers, a Aftermath Markers section should be available on the Dump Info tab. This may help to pin point the draw or dispatch call that caused problems.
If Call Stack Capturing was enabled when capturing the GPU crash dump, Call Stack links should be available in the Aftermath Markers section, pointing to the draw, dispatch, or copy call that may be related to the problem.
Last, the GPU State section on the Dump Info tab may provide some hints about which parts of the graphics pipeline were active or have faulted when the crash occurred.
Instrumenting Applications With The Aftermath API
The NVIDIA Nsight Aftermath SDK provides the Aftermath API that can be used by developers to instrument their applications. The latest version can be downloaded from:
By default, the latest version of the SDK package available at the time of a NVIDIA Nsight Graphics release is installed together with NVIDIA Nsight Graphics in:
C:\Program Files\NVIDIA Corporation\NVIDIA Nsight Graphics 2019.5\SDKs\NsightAftermath Detailed information about the functionality provided by the library and how to use it in an application can be found in the Readme.md that comes with the SDK package and the header files.
Aftermath Event Markers
The Aftermath event marker API (GFSDK_Aftermath_SetEventMarker) can be used to inject event markers with user defined data directly into the graphics command stream. If the application is instrumented with event markers, information about the last event markers that were processed by the GPU for each command stream will be captured into the GPU crash dump, including the user provided event data.
Source Shader Debug Information
For mapping shader addresses to high-level shader source (HLSL) shaders need to be compiled with debug information and this debug information must be available during the shader compilation process in the driver. To enable shader source mapping the following steps are necessary:
-
When precompiling shaders with the Microsoft DirectX Shader Compiler (dxc.exe) the /Zi flag needs to be set and the unstripped (DXIL) shader binary needs to be stored on disk in a location accessible when running the application. If the application compiles shaders on-the-fly it needs to store the unstripped DXIL shader blobs to disk, too.
-
The application needs to be instrumented with the Aftermath API and call GFSDK_Aftermath_DX12_Initialize with both the GFSDK_Aftermath_FeatureFlags_GenerateShaderDebugInfo and the GFSDK_Aftermath_FeatureFlags_EnableShaderSourceTracking flags set. Furthermore, it needs to call the GFSDK_Aftermath_SetShaderDebugInfoPaths function before any shader is loaded to provide the disk location(s) where the unstripped binary (DXIL) shader files can be found.
Notices
Notice
THE INFORMATION IN THIS GUIDE AND ALL OTHER INFORMATION CONTAINED IN NVIDIA DOCUMENTATION REFERENCED IN THIS GUIDE IS PROVIDED “AS IS.” NVIDIA MAKES NO WARRANTIES, EXPRESSED, IMPLIED, STATUTORY, OR OTHERWISE WITH RESPECT TO THE INFORMATION FOR THE PRODUCT, AND EXPRESSLY DISCLAIMS ALL IMPLIED WARRANTIES OF NONINFRINGEMENT, MERCHANTABILITY, AND FITNESS FOR A PARTICULAR PURPOSE. Notwithstanding any damages that customer might incur for any reason whatsoever, NVIDIA’s aggregate and cumulative liability towards customer for the product described in this guide shall be limited in accordance with the NVIDIA terms and conditions of sale for the product.
THE NVIDIA PRODUCT DESCRIBED IN THIS GUIDE IS NOT FAULT TOLERANT AND IS NOT DESIGNED, MANUFACTURED OR INTENDED FOR USE IN CONNECTION WITH THE DESIGN, CONSTRUCTION, MAINTENANCE, AND/OR OPERATION OF ANY SYSTEM WHERE THE USE OR A FAILURE OF SUCH SYSTEM COULD RESULT IN A SITUATION THAT THREATENS THE SAFETY OF HUMAN LIFE OR SEVERE PHYSICAL HARM OR PROPERTY DAMAGE (INCLUDING, FOR EXAMPLE, USE IN CONNECTION WITH ANY NUCLEAR, AVIONICS, LIFE SUPPORT OR OTHER LIFE CRITICAL APPLICATION). NVIDIA EXPRESSLY DISCLAIMS ANY EXPRESS OR IMPLIED WARRANTY OF FITNESS FOR SUCH HIGH RISK USES. NVIDIA SHALL NOT BE LIABLE TO CUSTOMER OR ANY THIRD PARTY, IN WHOLE OR IN PART, FOR ANY CLAIMS OR DAMAGES ARISING FROM SUCH HIGH RISK USES.
NVIDIA makes no representation or warranty that the product described in this guide will be suitable for any specified use without further testing or modification. Testing of all parameters of each product is not necessarily performed by NVIDIA. It is customer’s sole responsibility to ensure the product is suitable and fit for the application planned by customer and to do the necessary testing for the application in order to avoid a default of the application or the product. Weaknesses in customer’s product designs may affect the quality and reliability of the NVIDIA product and may result in additional or different conditions and/or requirements beyond those contained in this guide. NVIDIA does not accept any liability related to any default, damage, costs or problem which may be based on or attributable to: (i) the use of the NVIDIA product in any manner that is contrary to this guide, or (ii) customer product designs.
Other than the right for customer to use the information in this guide with the product, no other license, either expressed or implied, is hereby granted by NVIDIA under this guide. Reproduction of information in this guide is permissible only if reproduction is approved by NVIDIA in writing, is reproduced without alteration, and is accompanied by all associated conditions, limitations, and notices.
Trademarks
NVIDIA, the NVIDIA logo, and cuBLAS, CUDA, CUDA-GDB, CUDA-MEMCHECK, cuDNN, cuFFT, cuSPARSE, DIGITS, DGX, DGX-1, DGX Station, NVIDIA DRIVE, NVIDIA DRIVE AGX, NVIDIA DRIVE Software, NVIDIA DRIVE OS, NVIDIA Developer Zone (aka "DevZone"), GRID, Jetson, NVIDIA Jetson Nano, NVIDIA Jetson AGX Xavier, NVIDIA Jetson TX2, NVIDIA Jetson TX2i, NVIDIA Jetson TX1, NVIDIA Jetson TK1, Kepler, NGX, NVIDIA GPU Cloud, Maxwell, Multimedia API, NCCL, NVIDIA Nsight Compute, NVIDIA Nsight Eclipse Edition, NVIDIA Nsight Graphics, NVIDIA Nsight Systems, NVLink, nvprof, Pascal, NVIDIA SDK Manager, Tegra, TensorRT, Tesla, Visual Profiler, VisionWorks and Volta are trademarks and/or registered trademarks of NVIDIA Corporation in the United States and other countries. Other company and product names may be trademarks of the respective companies with which they are associated.