Planner Benchmark Example#
This guide shows an example of benchmarking LocalPlanner performance with synthetic data. In this example, we focus on 8x H100 SXM GPU and deepseek-ai/DeepSeek-R1-Distill-Llama-8B model with TP1 prefill and decode engine.
Warning
Bare metal deployment with local connector is deprecated. The only option to deploy planner is via k8s. We will update the examples in this document soon.
Synthetic Data Generation#
We first generate synthetic data with varying request rate from 0.75 to 3 using the provided generate_synthetic_data.py script.
python sin_synth.py \
    --time-duration 600 \
    --request-rate-min 5 \
    --request-rate-max 20 \
    --request-rate-period 150 \
    --isl1 3000 \
    --osl1 150 \
    --isl2 3000 \
    --osl2 150
This generates a mooncake style trace with
duration = 600 seconds
isl/osl = 3000/150
request rate varies sinusoidally from 0.75 to 3 requests with a period of 150 seconds
For other models and GPU SKUs, adjust the request rate ranges accordingly to match the load.
Run the Benchmark#
To measure the performance of dynamo with planner, we start from a 1p1d deployment and set planner to make adjustments every 10 seconds:
cd examples/llm
dynamo serve graphs.disagg_router:Frontend -f disagg_1p1d.yml

# in terminal 2
genai-perf profile \
    --tokenizer deepseek-ai/DeepSeek-R1-Distill-Llama-8B \
    -m deepseek-ai/DeepSeek-R1-Distill-Llama-8B \
    --endpoint-type chat \
    --url http://localhost:8000 \
    --streaming \
    --input-file payload:sin_b512_t600_rr5.0-20.0-150.0_io3000150-3000150-0.2-0.8-10.jsonl
To view the performance metrics and planner decisions, launch tensorboard with
tensorboard --logdir log
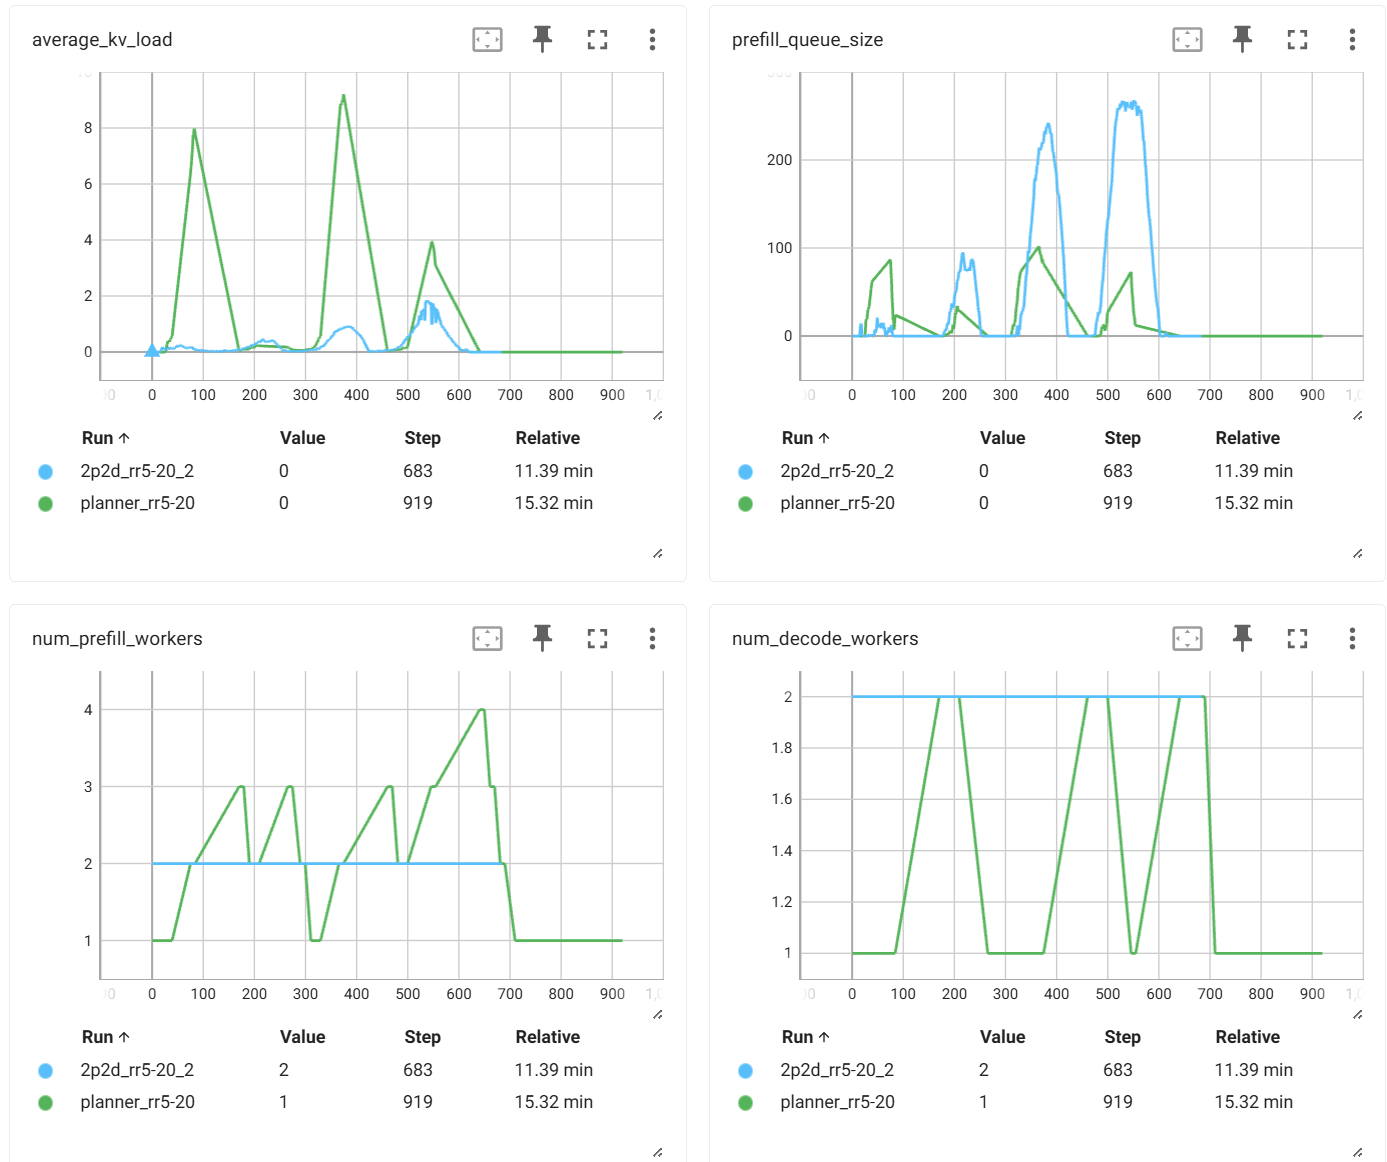
and open http://localhost:6006 in your browser. The following metrics are available:
average_kv_load: the average KV load in decode workersprefill_queue_size: the size of the prefill queuenum_queued_request: the number of requests queued in decode workersnum_prefill_workers: the number of prefill workersnum_decode_workers: the number of decode workersnum_gpu: the total number of GPUs used
The benchmark results are printed out in terminal 3 that runs the genai-perf command.
In this example, we use a fixed 2p2d engine as baseline. Planner provides a --no-operation flag to watch and log the metrics without making any adjustments:
# in terminal 1
dynamo serve graphs.disagg_router:Frontend -f disagg_2p2d.yml

# in terminal 2
genai-perf profile --tokenizer deepseek-ai/DeepSeek-R1-Distill-Llama-8B -m deepseek-ai/DeepSeek-R1-Distill-Llama-8B --service-kind openai --endpoint-type chat --url http://localhost:8000 --streaming --input-file payload:sin_b512_t600_rr5.0-20.0-150.0_io3000150-3000150-0.2-0.8-10.jsonl
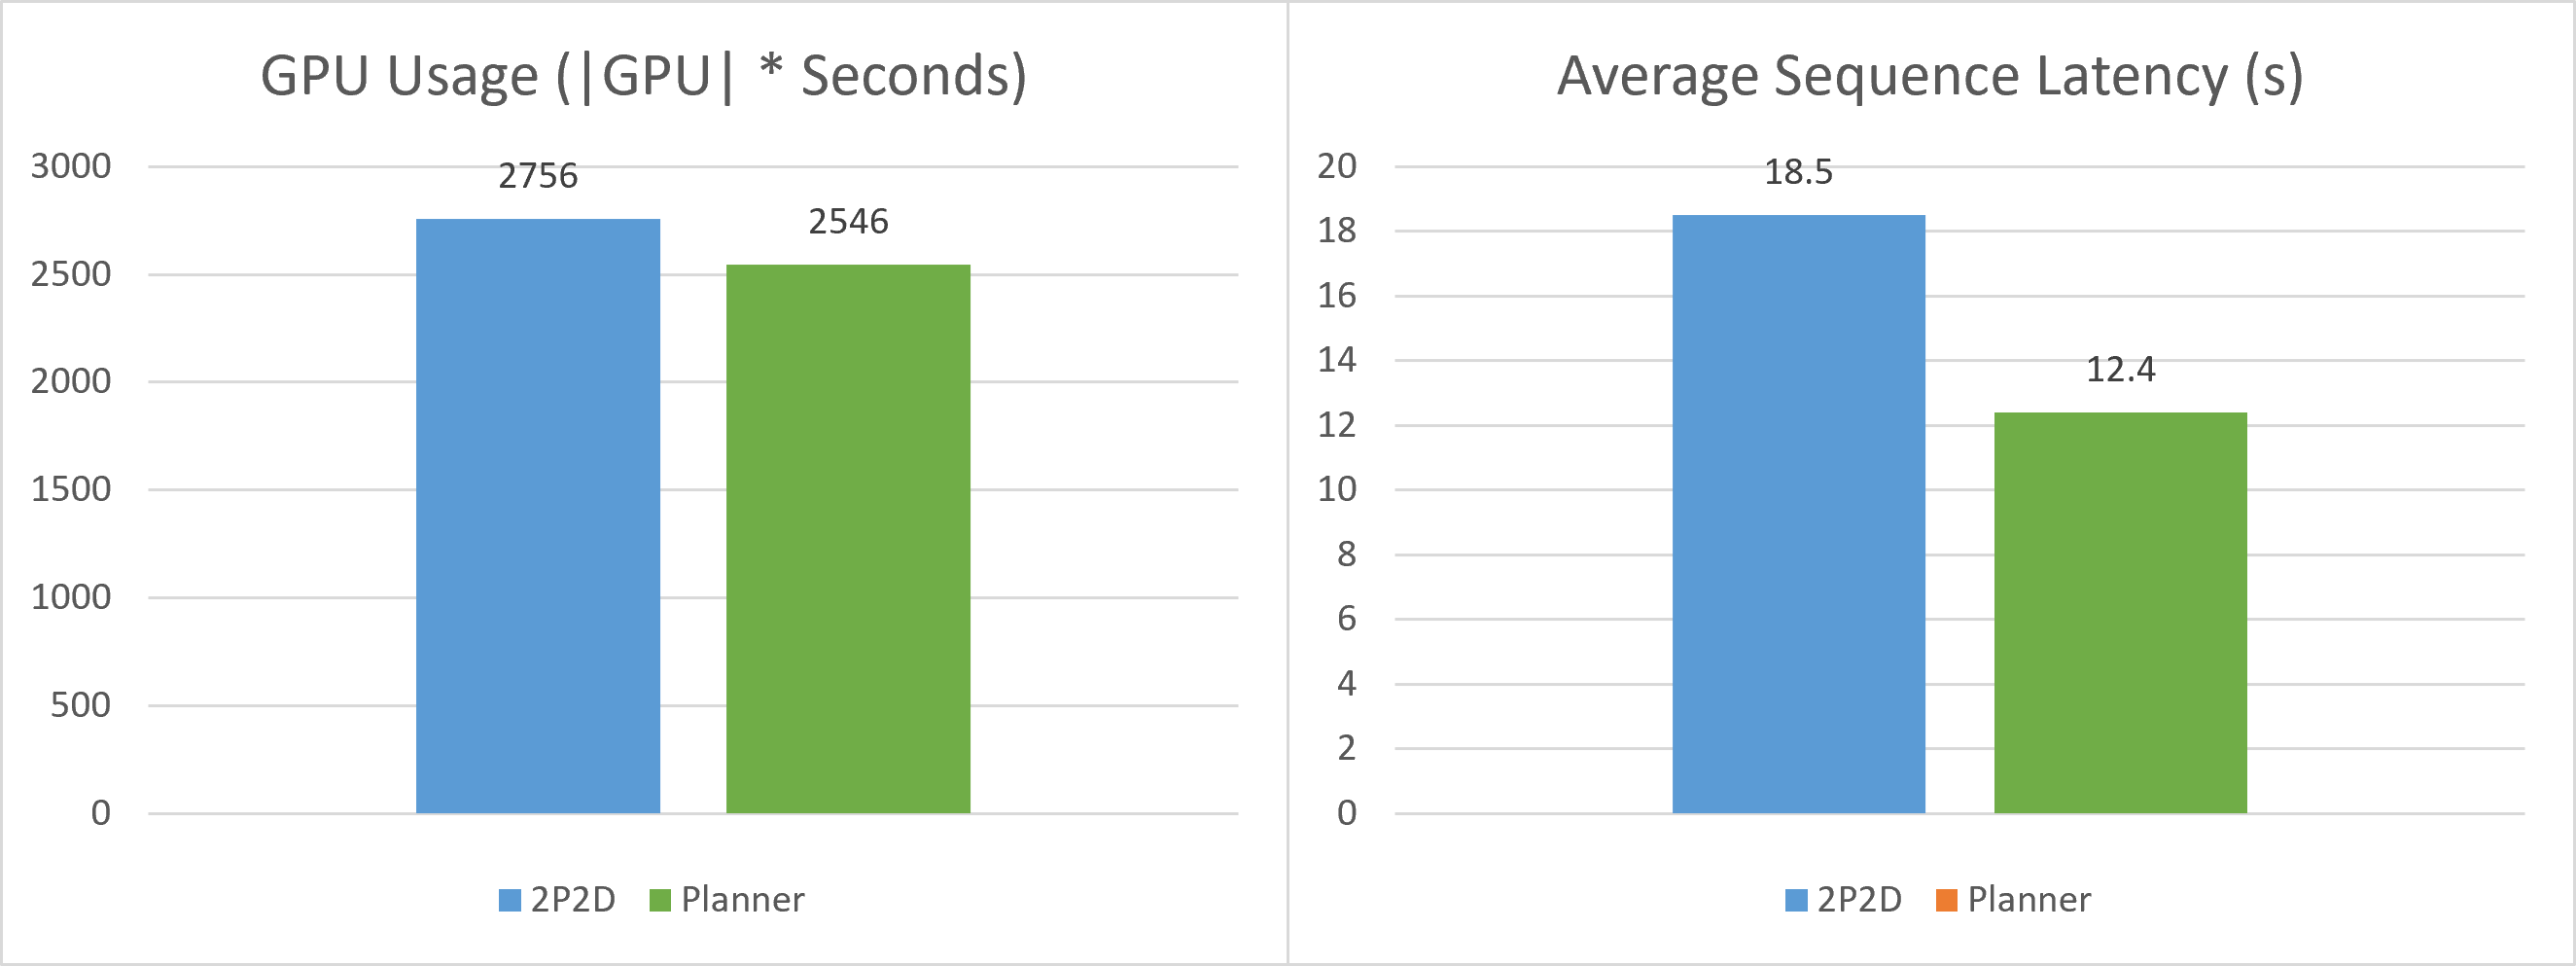
Results#
The below two figures show the performance comparison between planner and the baseline 2p2d deployment. Planner achieves 1.5x speedup while using 7.4% less GPU resources.