---
title: Profiler Guide
---
## Overview
The Dynamo Profiler analyzes model inference performance and generates optimized deployment configurations (DynamoGraphDeployments). Given a model, hardware, and SLA targets, it determines the best parallelization strategy, selects optimal prefill and decode engine configurations, and produces a ready-to-deploy DGD YAML.
The profiler accepts a `DynamoGraphDeploymentRequestSpec` (DGDR) as input and uses [AI Configurator (AIC)](https://github.com/ai-dynamo/aiconfigurator) for performance simulation, candidate enumeration, and configuration picking. When the planner is enabled, the profiler additionally generates engine interpolation curves used for runtime autoscaling.
## Workflow
- **What** model you want to deploy (`model`)
- **How** it should perform (SLA targets: `sla.ttft`, `sla.itl`)
- **Where** it should run (optional GPU preferences via `hardware`)
- **Which** backend to use (`backend`: auto, vllm, sglang, or trtllm)
- **Which** image to use (`image`)
The profiler follows this pipeline:
```mermaid
flowchart TD
Input["DGDR Spec"] --> Validate["Validate + Gate Checks"]
Validate --> Strategy{searchStrategy?}
Strategy -->|rapid| AICCheck{"AIC supports\nmodel/hw/backend?"}
Strategy -->|thorough| Enumerate["Enumerate candidates\nvia AIC"]
AICCheck -->|yes| Simulate["AIC Simulation\n+ Picking"]
AICCheck -->|no| Naive["Naive Config\nGeneration"]
Enumerate --> Deploy["Deploy + Benchmark\neach candidate"]
Deploy --> Pick["AIC Picking"]
Simulate --> DGDGen["DGD Generation"]
Pick --> DGDGen
Naive --> DGDGen
DGDGen --> Interpolation["Interpolation\nCurves"]
Interpolation --> MockerCheck{mocker?}
MockerCheck -->|yes| MockerBase["generate_mocker_config()"]
MockerCheck -->|no| PlannerCheck
MockerBase --> PlannerCheck{planner?}
PlannerCheck -->|yes| AddPlanner["add_planner_to_config()"]
PlannerCheck -->|no| ProfileCheck
AddPlanner --> ProfileCheck{"needs profile data?\n(mocker or throughput\nplanner enabled)"}
ProfileCheck -->|yes| AddProfile["add_profile_data_to_config()"]
ProfileCheck -->|no| Final
AddProfile --> Final["final_config.yaml"]
```
### Stage-by-stage walkthrough
1. **Validation**: The DGDR spec is validated — required fields checked (`image`, `hardware.gpuSku`, `hardware.numGpusPerNode`), SLA targets verified, and gate checks applied (see [Gate Checks](#gate-checks-and-constraints)).
2. **Search Strategy**: The profiler branches based on `searchStrategy`:
- **Rapid**: Uses AIC simulation to estimate performance across parallelization configs. No GPUs needed, completes in ~30 seconds.
- **Thorough**: Enumerates candidate parallelization configs via AIC, deploys each on real GPUs, benchmarks with AIPerf, then picks the best. Takes 2-4 hours, disagg mode only.
3. **Picking**: The profiler selects the best configuration using one of three modes, determined automatically from the DGDR spec (see [Picking Modes](#picking-modes)).
4. **DGD Generation**: The picked configuration is rendered into a complete DGD YAML via AIC's generator pipeline, including correct parallelization, replica counts, container image, and PVC mounts.
5. **Interpolation** (throughput planner/mocker): When the planner is enabled, the profiler generates detailed performance interpolation curves — TTFT vs ISL for prefill, ITL vs KV-cache utilization for decode. These are stored as NPZ files and later packaged into a ConfigMap during final assembly.
6. **Final Assembly** (3 composable layers):
1. **Mocker base**: If mocker is enabled, the base DGD is swapped for the mocker DGD template (`generate_mocker_config`). Otherwise the AIC-picked DGD is kept.
2. **Planner service**: If the planner is enabled, the Planner pod and its planner-config ConfigMap are injected into the DGD (`add_planner_to_config`).
3. **Profile data**: If mocker is enabled or planner throughput-based scaling is enabled, the interpolation data ConfigMap is created and mounted into all consumers — the Planner service and/or mocker workers (`add_profile_data_to_config`).
The result is written to `final_config.yaml`.
## Search Strategies
### Rapid
Uses AIC's performance simulation to estimate optimal configurations without deploying real engines. Completes in ~30 seconds.
```yaml
searchStrategy: rapid
```
- Supports all backends: vLLM, SGLang, TensorRT-LLM
- If the model/hardware/backend combination is not supported by AIC, falls back to a naive config (memory-fit TP calculation)
- No GPU resources consumed during profiling
### Thorough
Enumerates candidate parallelization configs, deploys each as a real K8s workload, and benchmarks with AIPerf.
```yaml
searchStrategy: thorough
```
- Only disaggregated mode is supported
- Does not support `auto` backend — specify `vllm`, `sglang`, or `trtllm`
- Takes 2-4 hours depending on the number of candidates
- Provides highest accuracy since measurements come from real hardware
## Picking Modes
The profiler automatically selects a picking mode based on the DGDR spec:
### Autoscale
Triggered when the **planner is enabled** (scaling enabled in `features.planner`). Picks prefill and decode engines independently, each with 1 replica. The planner handles scaling at runtime.
### Load Match
Triggered when a **target load** is specified (`workload.requestRate` or `workload.concurrency`). Finds the configuration that serves the target load with the minimum number of GPUs under SLA.
```yaml
workload:
requestRate: 5.0 # target 5 req/s
```
### Default
Triggered when there is **no planner and no target load**. Maximizes throughput for the available GPU budget under SLA.
## Planner Integration
When the planner is enabled, the profiler generates engine interpolation data needed for throughput-based autoscaling. The `pre_deployment_sweeping_mode` field controls how this data is produced:
```yaml
features:
planner:
pre_deployment_sweeping_mode: rapid # rapid | thorough | none
enable_throughput_scaling: true
```
- **rapid**: Uses AIC simulation to generate interpolation curves (~30s, no GPUs)
- **thorough**: Deploys the selected engine config on real GPUs and sweeps across ISL/concurrency ranges (2-4h)
- **none**: Skips interpolation. Only valid when using load-based scaling without throughput-based scaling.
The profiler saves two ConfigMaps into the generated DGD:
- **planner-config-XXXX**: Serialized `PlannerConfig` JSON (with `profile_results_dir` pointing to the profiling data mount)
- **planner-profile-data-XXXX**: Prefill and decode interpolation data (JSON)
See the [Planner Guide](/dynamo/components/planner/planner-guide) for the full `PlannerConfig` reference.
## Mocker
When `features.mocker.enabled: true`, the profiler outputs a mocker DGD that simulates engine behavior without real GPUs. This is useful for testing planner behavior and validating configurations at scale.
Mocker requires pre-deployment sweeping to generate simulated performance profiles — `pre_deployment_sweeping_mode` cannot be `none` when mocker is enabled.
## Gate Checks and Constraints
The profiler enforces these rules at startup:
| Condition | Behavior |
|-----------|----------|
| `searchStrategy: thorough` + `backend: auto` | Rejected. Specify a concrete backend. |
| AIC unsupported + `enable_throughput_scaling: true` | Rejected. Throughput planner requires AIC support. |
| AIC unsupported + `pre_deployment_sweeping_mode: rapid` | Falls back to `none` with a warning. |
| `e2eLatency` provided without `ttft: null, itl: null` | Rejected by SLA validator. When using `e2eLatency`, explicitly null out `ttft` and `itl`. |
| SLA unachievable | Warning logged, SLA updated to best achievable value. |
| Load-match needs more GPUs than available | Warning logged. |
## Support Matrix
| Backend | Dense Models | MoE Models |
|---------|-------------|------------|
| vLLM | ✅ | 🚧 |
| SGLang | ✅ | ✅ |
| TensorRT-LLM | ✅ | 🚧 |
The profiler sweeps over the following parallelization mappings for prefill and decode:
| Model Architecture | Prefill Parallelization Mapping | Decode Parallelization Mapping |
|---------|-------------|------------|
| MLA+MoE (DeepseekV3ForCausalLM, DeepseekV32ForCausalLM) | TEP, DEP | TEP, DEP |
| GQA+MoE (Qwen3MoeForCausalLM) | TP, TEP, DEP | TP, TEP, DEP |
| Other Models | TP | TP |
Exact model x parallelization mapping support is dependent on the backend. The profiler does not guarantee that the recommended P/D engine configuration is supported and bug-free by the backend.
## Deployment
### Kubernetes Deployment (DGDR)
The recommended deployment method is through DGDRs. Sample configurations are provided in `components/src/dynamo/profiler/deploy/`:
| Sample | Description |
|--------|-------------|
| `profile_sla_dgdr.yaml` | Standard online profiling with AIPerf |
| `profile_sla_aic_dgdr.yaml` | Fast offline profiling with AI Configurator |
| `profile_sla_moe_dgdr.yaml` | MoE model profiling (SGLang) |
#### Container Images
Each DGDR requires a container image for profiling and deployment:
- **`image`** (Optional): Container image for the profiling job. Must contain the profiler code and dependencies.
```yaml
spec:
image: "nvcr.io/nvidia/ai-dynamo/vllm-runtime:1.0.0"
```
#### Quick Start: Deploy with DGDR
**Step 1: Create Your DGDR**
Use a sample configuration or create your own:
```yaml
apiVersion: nvidia.com/v1beta1
kind: DynamoGraphDeploymentRequest
metadata:
name: my-model-profiling
spec:
model: "Qwen/Qwen3-0.6B"
backend: vllm
image: "nvcr.io/nvidia/ai-dynamo/dynamo-frontend:1.0.0"
```
**Step 2: Apply the DGDR**
```bash
export NAMESPACE=your-namespace
kubectl apply -f my-profiling-dgdr.yaml -n $NAMESPACE
```
**Step 3: Monitor Progress**
```bash
# View status
kubectl get dgdr -n $NAMESPACE
# Detailed status
kubectl describe dgdr my-model-profiling -n $NAMESPACE
# Watch profiling job logs
kubectl logs -f job/profile-my-model-profiling -n $NAMESPACE
```
**DGDR Status Phases:**
- `Pending`: Initial state, preparing to profile
- `Profiling`: Running profiling job (20-30 seconds for AIC, 2-4 hours for online)
- `Ready`: Profiling complete, generated DGD spec available in status
- `Deploying`: Generating and applying DGD configuration
- `Deployed`: DGD successfully deployed and running
- `Failed`: Error occurred (check events for details)
**Step 4: Access Your Deployment**
```bash
# Find the frontend service
kubectl get svc -n $NAMESPACE | grep frontend
# Port-forward to access locally
kubectl port-forward svc/-frontend 8000:8000 -n $NAMESPACE
# Test the endpoint
curl http://localhost:8000/v1/models
```
DGDRs are **immutable**. To update SLAs or configuration, delete the existing DGDR and create a new one.
## Profiling Method
The profiler follows a 5-step process:
1. **Hardware Setup**: Uses defaults or user-specified hardware configuration. Optionally, cluster-scoped operators can enable automatic GPU discovery to detect specifications from cluster nodes.
2. **Identify Sweep Ranges**: Automatically determine minimum and maximum number of GPUs per engine. Minimum is determined by the model size and GPU VRAM. Maximum is set to one node for dense models and 4 nodes for MoE models.
3. **Parallelization Mapping Sweep**: Test performance of engines with different parallelization mappings using the input ISL and OSL.
- For dense models, test different TP sizes for both prefill and decode.
- For MoE models (SGLang), evaluate both TEP and DEP as candidates for prefill and decode.
- **Prefill**:
- TP/TEP: Measure TTFT with batch size = 1 (assuming ISL is long enough to saturate compute) without KV reuse.
- DEP: Attention uses data parallelism. Send a single burst with total concurrency `attention_dp_size × attn_dp_num_req_ratio` (defaults to 4) and compute the reported TTFT as `time_to_first_token.max / attn_dp_num_req_ratio` from the AIPerf summary of that burst.
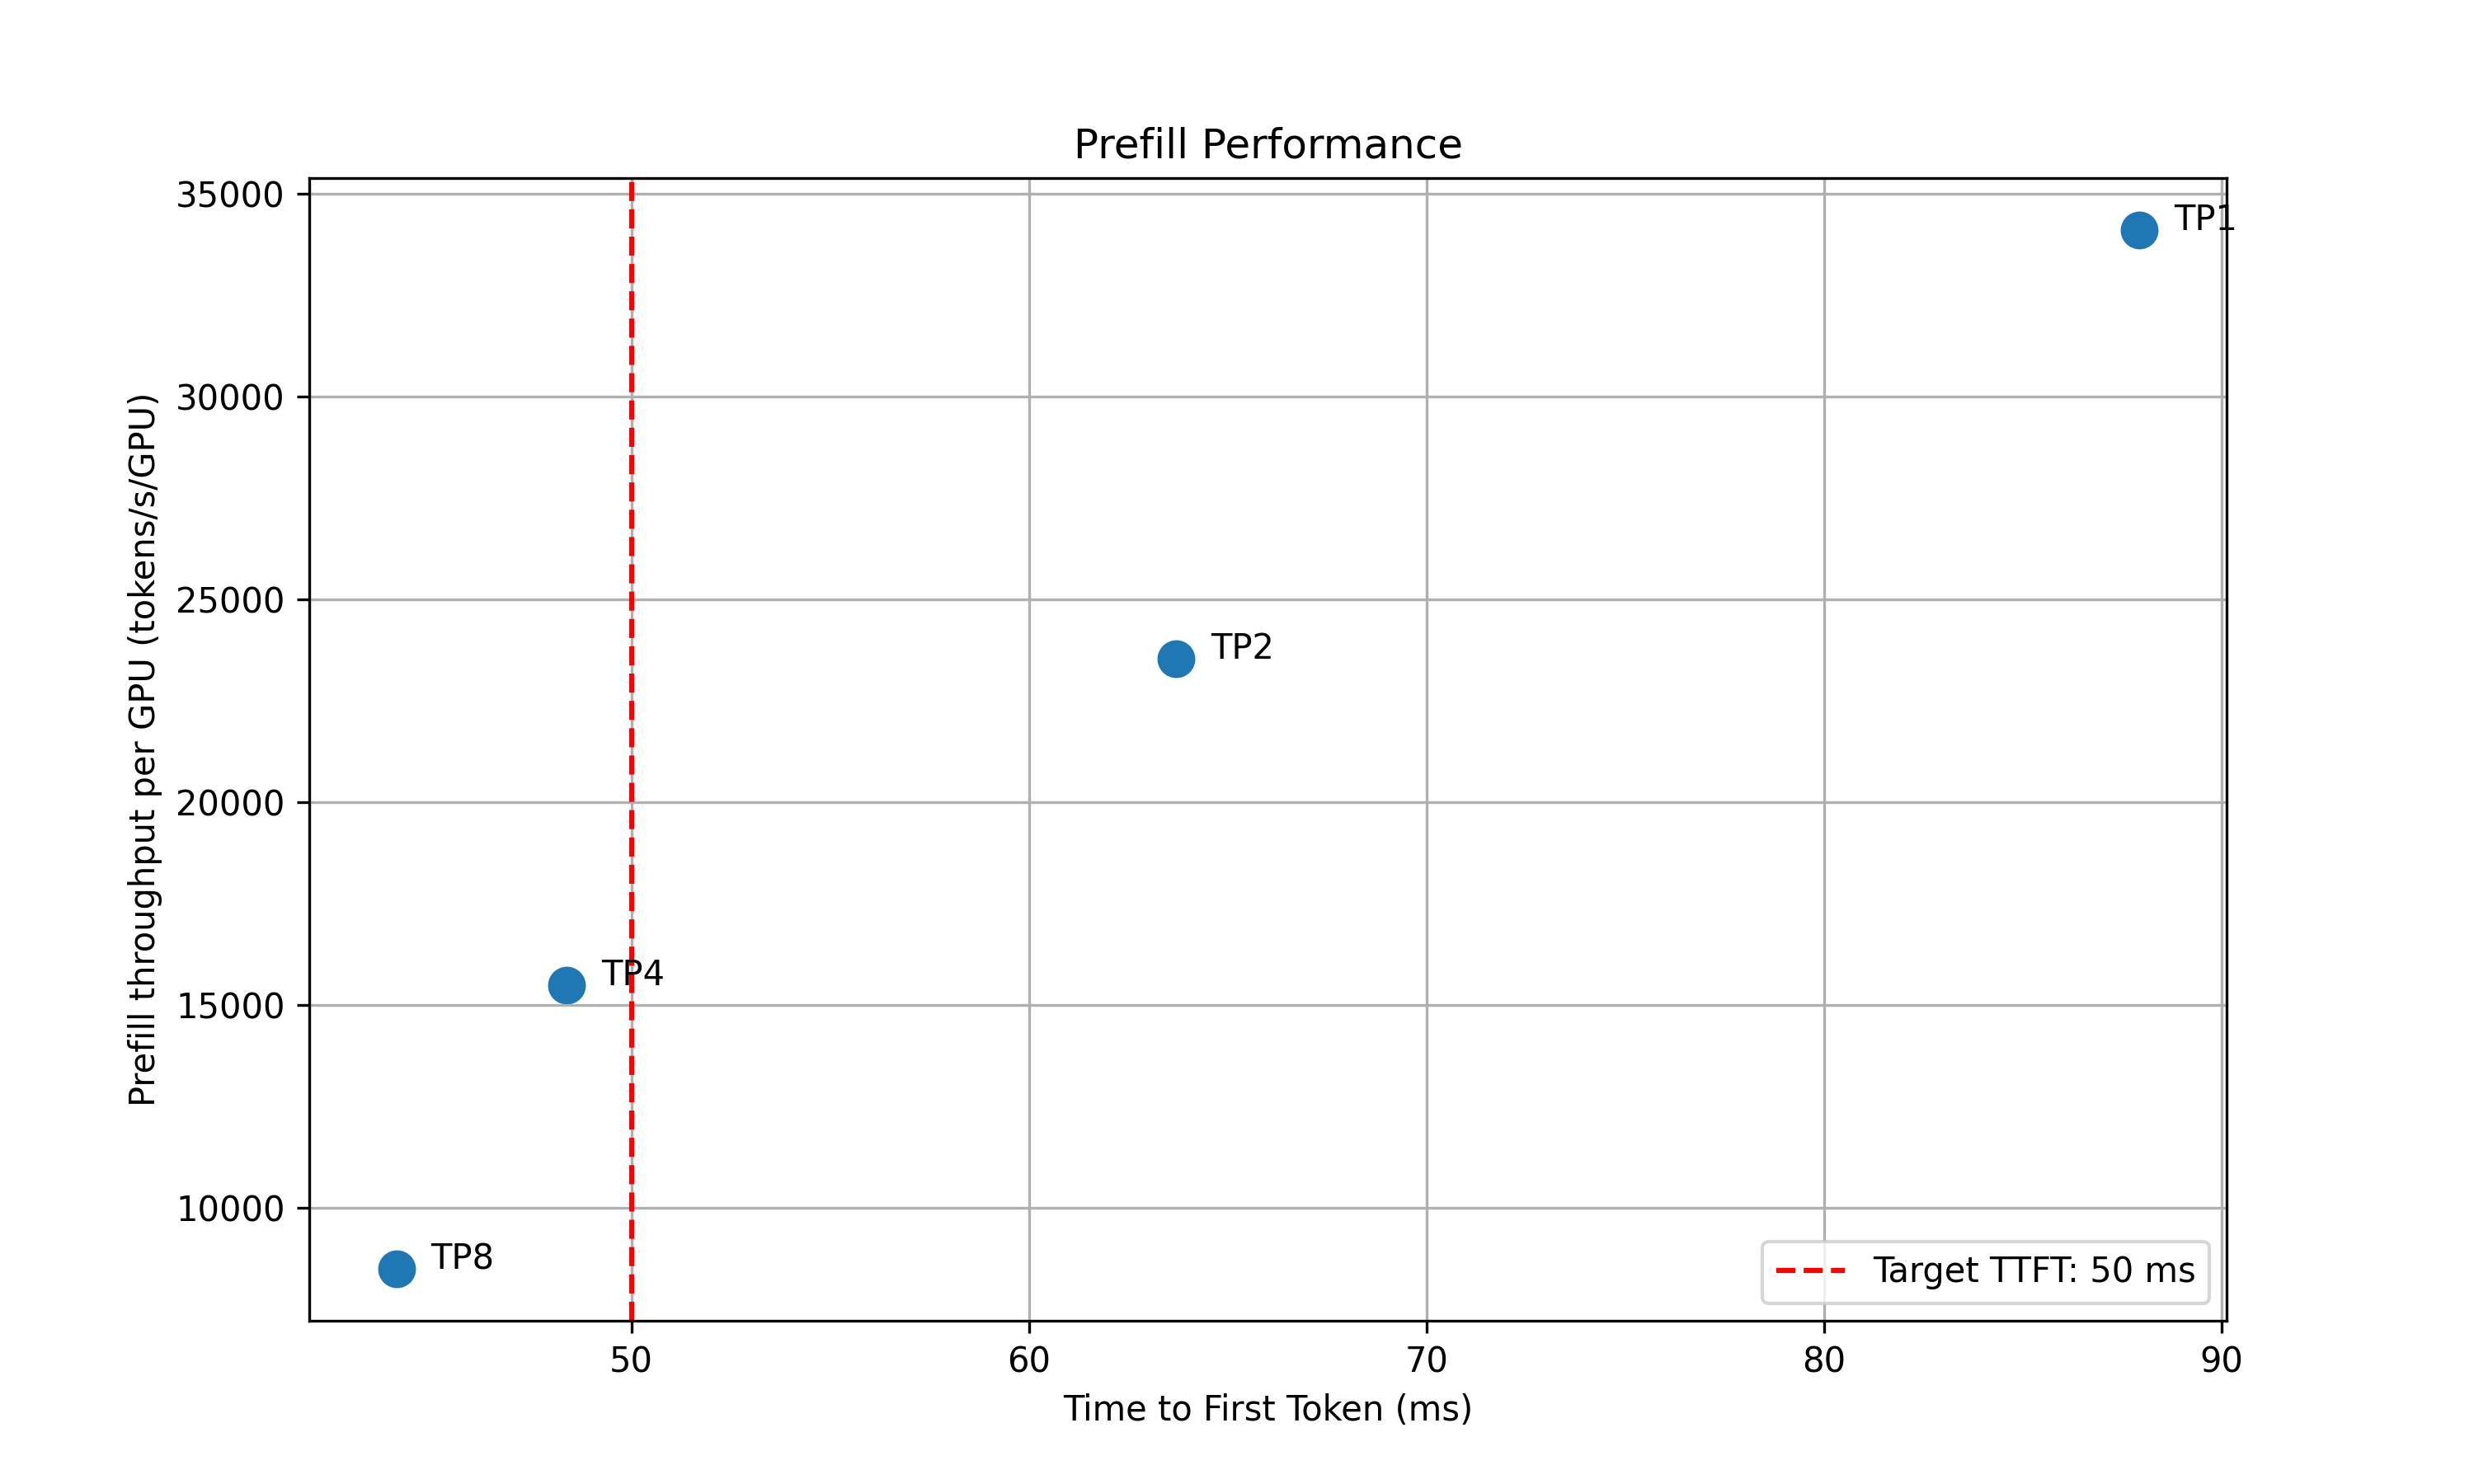
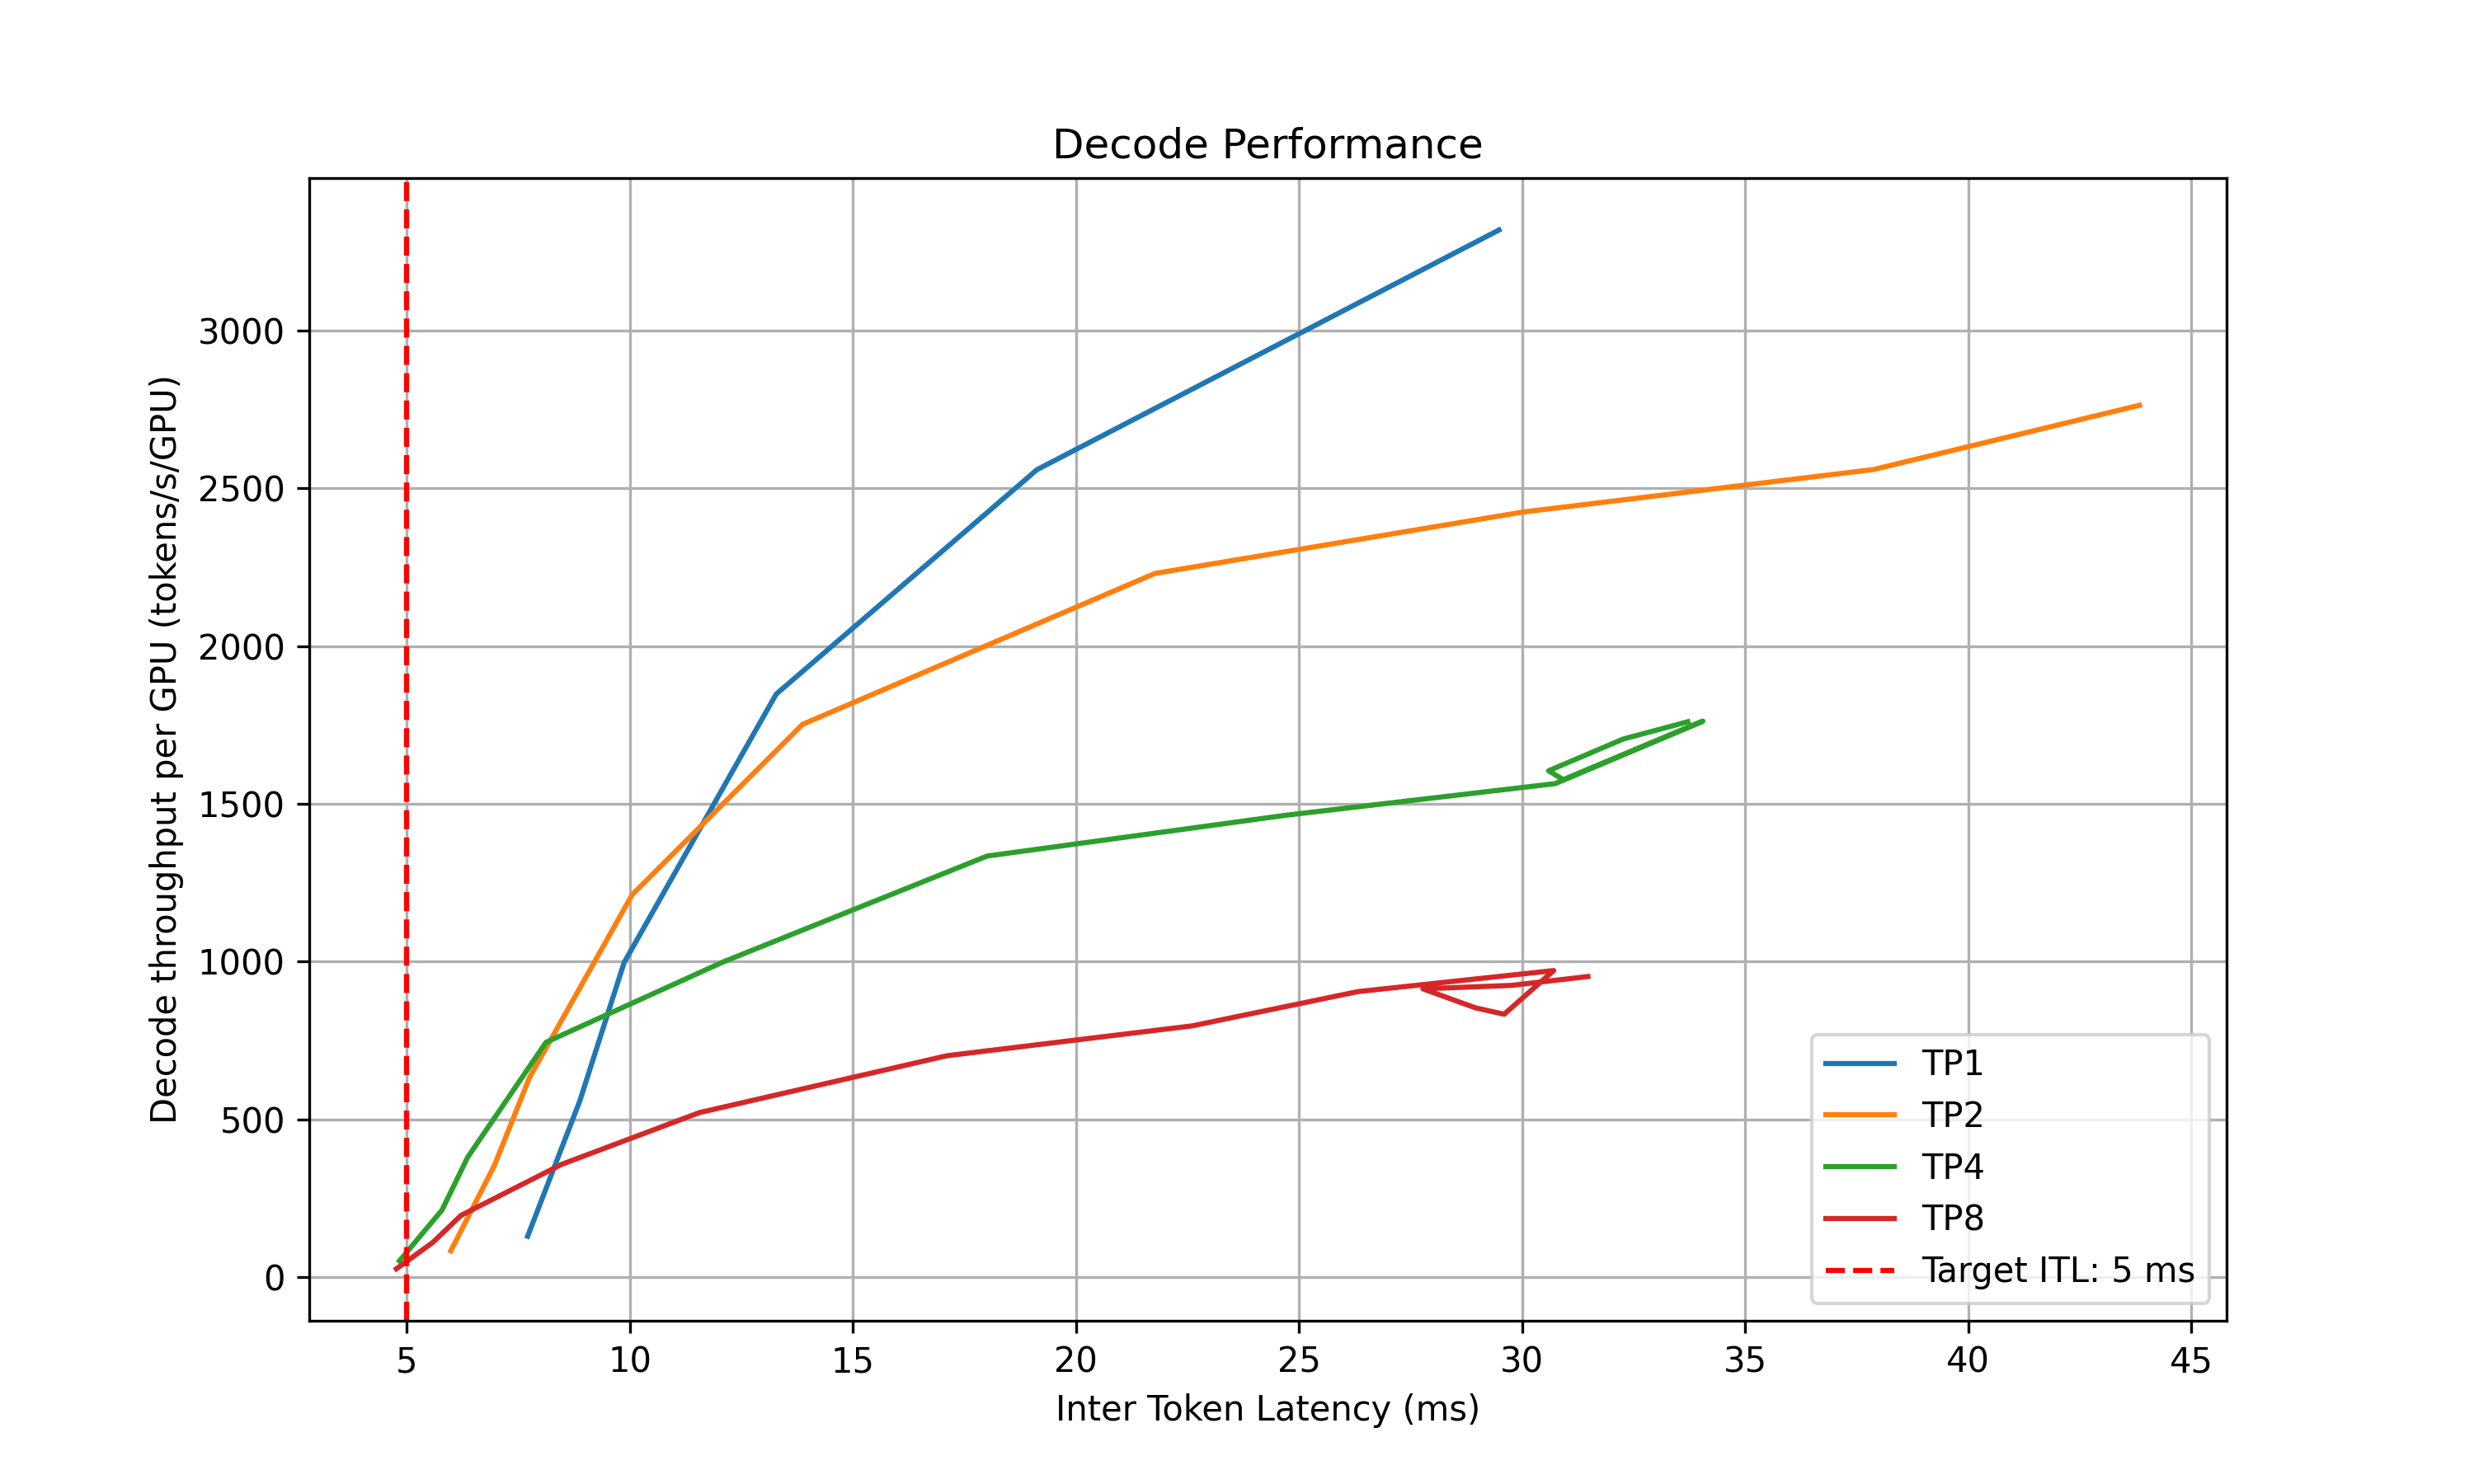
- **Decode**: Measure the ITL under different numbers of in-flight requests, from 1 to the maximum the KV cache can hold. To measure ITL without being affected by piggy-backed prefill requests, the script enables KV-reuse and warms up the engine by issuing the same prompts before measuring.
4. **Recommendation**: Select optimal parallelization mapping for prefill and decode that achieves the highest per-GPU throughput while adhering to the SLA on TTFT and ITL.
5. **In-Depth Profiling on the Recommended P/D Engine**: Interpolate TTFT with ISL and ITL with active KV cache and decode context length for more accurate performance estimation.
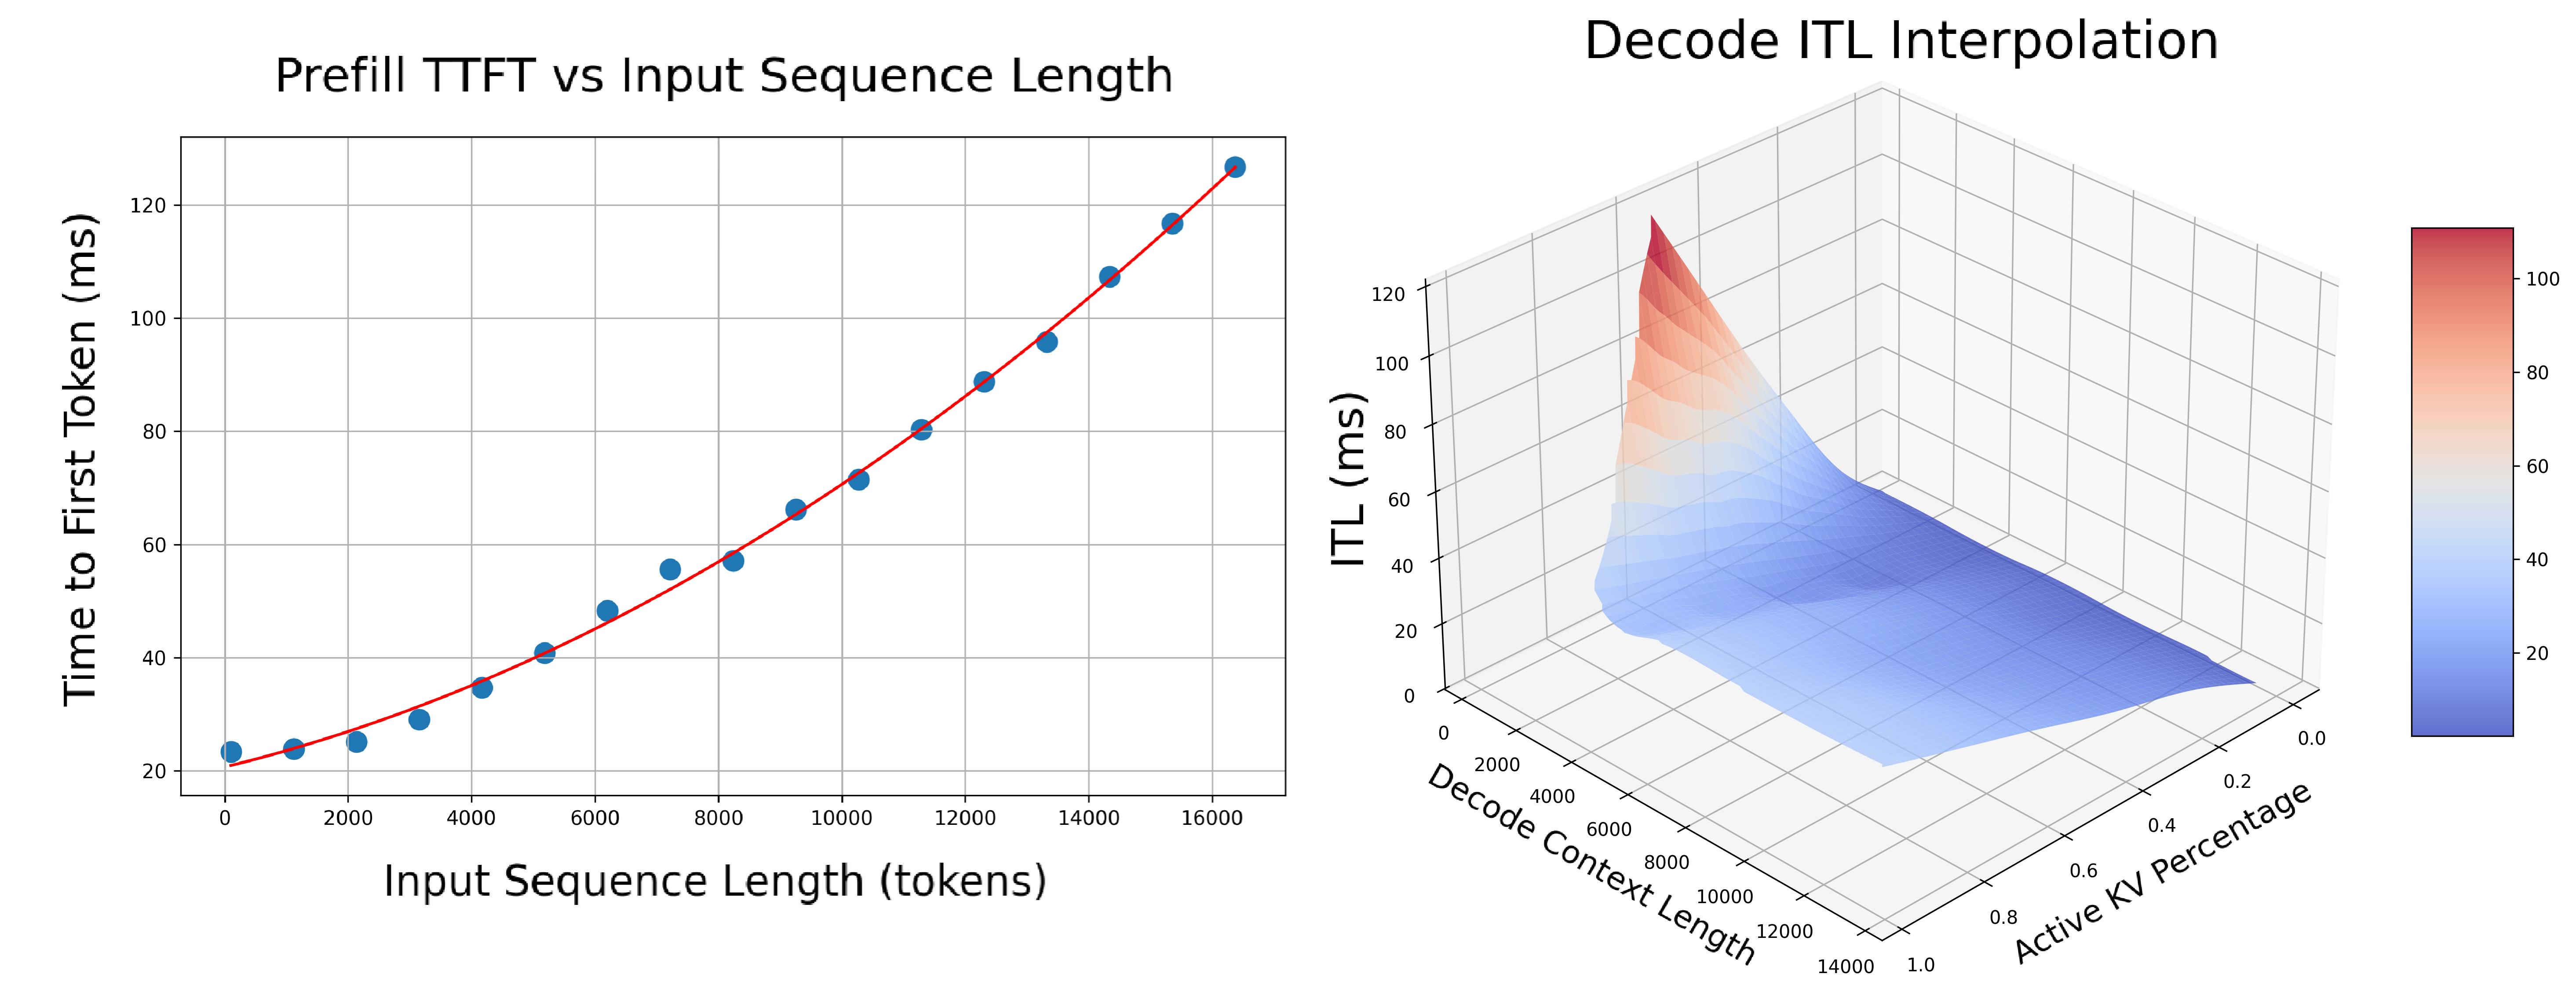
- **Prefill**: Measures TTFT and throughput per GPU across different input lengths with batch size=1.
- **Decode**: Measures ITL and throughput per GPU under various KV cache loads and decode context lengths.
### AIPerf on Real Engines
Profiles your model by creating real test deployments in Kubernetes and measuring their performance.
- **Duration**: 2-4 hours
- **Accuracy**: Highest (real measurements)
- **GPU Requirements**: Full access to test different parallelization mappings
- **Backends**: vLLM, SGLang, TensorRT-LLM
AIPerf-based profiling is the default behavior. Use `searchStrategy: thorough` for comprehensive real-engine profiling:
```yaml
spec:
searchStrategy: thorough # Deep exploration with real engine profiling
```
### AI Configurator Simulation
Uses performance simulation to rapidly estimate optimal configurations without running real deployments.
- **Duration**: 20-30 seconds
- **Accuracy**: Estimated (may have errors for unusual configurations)
- **GPU Requirements**: None
- **Backends**: TensorRT-LLM only (vLLM/SGLang coming soon)
AI Configurator is used by default with `searchStrategy: rapid`:
```yaml
spec:
searchStrategy: rapid # Fast profiling with AI Configurator simulation (default)
```
`aicBackendVersion` specifies the TensorRT-LLM version that AI Configurator simulates. See the [AI Configurator supported features](https://github.com/ai-dynamo/aiconfigurator#supported-features) for available versions.
**Currently supports:**
- **Backends**: TensorRT-LLM (versions 0.20.0, 1.0.0rc3, 1.0.0rc6)
- **Systems**: H100 SXM, H200 SXM, B200 SXM, GB200 SXM, A100 SXM
- **Models**: Wide range including GPT, Llama, Mixtral, DeepSeek, Qwen, and more
See [AI Configurator documentation](https://github.com/ai-dynamo/aiconfigurator#supported-features) for the full list.
### Automatic GPU Discovery
The operator automatically discovers GPU resources from cluster nodes, providing hardware info (GPU model, VRAM, GPUs per node) and automatic profiling search space calculation.
**Requirements:**
- **Cluster-scoped operators**: Have node read permissions by default
- **Namespace-scoped operators**: GPU discovery is enabled by default when installing via Helm — the chart provisions the required ClusterRole/ClusterRoleBinding automatically
**For namespace-scoped operators**, GPU discovery is controlled by a Helm value:
```bash
# GPU discovery enabled (default) — Helm provisions read-only node access automatically
helm install dynamo-platform ... --set dynamo-operator.gpuDiscovery.enabled=true
# GPU discovery disabled — you must provide hardware config manually in each DGDR
helm install dynamo-platform ... --set dynamo-operator.gpuDiscovery.enabled=false
```
If GPU discovery is disabled, provide hardware config manually in the DGDR:
```yaml
spec:
hardware:
numGpusPerNode: 8
gpuSku: "H100-SXM5-80GB"
vramMb: 81920
```
If GPU discovery is disabled and no manual hardware config is provided, the DGDR will be rejected at admission time.
## Configuration
### DGDR Configuration Structure
All profiler configuration is provided through the v1beta1 DGDR spec fields:
```yaml
apiVersion: nvidia.com/v1beta1
kind: DynamoGraphDeploymentRequest
metadata:
name: my-deployment
spec:
model: "Qwen/Qwen3-0.6B"
backend: vllm
image: "nvcr.io/nvidia/ai-dynamo/vllm-runtime:1.0.0"
searchStrategy: rapid # or thorough
autoApply: true
workload: { ... }
sla: { ... }
hardware: { ... }
features: { ... }
overrides: { ... }
```
### SLA Configuration (Optional)
```yaml
workload:
isl: 3000 # Average input sequence length (tokens)
osl: 150 # Average output sequence length (tokens)
sla:
ttft: 200.0 # Target Time To First Token (milliseconds)
itl: 20.0 # Target Inter-Token Latency (milliseconds)
```
- **ISL/OSL**: Based on your expected traffic patterns
- **TTFT**: First token latency target (lower = more GPUs needed, affects prefill engine)
- **ITL**: Token generation latency target (lower = more GPUs needed, affects decode engine)
- **Trade-offs**: Tighter SLAs require more GPU resources
### Hardware Configuration (Optional)
```yaml
hardware:
gpuSku: h200_sxm # GPU SKU identifier (auto-detected)
vramMb: 81920 # VRAM per GPU in MiB
totalGpus: 16 # Total GPUs available in the cluster
numGpusPerNode: 8 # GPUs per node (for multi-node MoE)
```
- **numGpusPerNode**: Determine the upper bound of GPUs per node for dense models and configure Grove for multi-node MoE engines
- **gpuSku**: GPU SKU identifier, auto-detected by the controller
If you don't specify hardware constraints, the controller auto-detects based on your model size and available cluster resources.
### Search Strategy (Optional)
Controls the profiling search depth:
```yaml
spec:
searchStrategy: rapid # "rapid" (default) for fast sweep; "thorough" for deeper exploration
```
- **rapid**: Performs a fast sweep over parallelization mappings (default)
- **thorough**: Explores more configurations for potentially better results
### Planner Configuration (Optional)
Pass arguments to the SLA planner via the features section:
```yaml
features:
planner:
planner_min_endpoint: 2 # Minimum endpoints to maintain
planner_adjustment_interval: 60 # Adjustment interval (seconds)
planner_load_predictor: linear # Load prediction method
```
Planner arguments use `planner_` prefix. See [SLA Planner documentation](/dynamo/components/planner/planner-guide) for full list.
### Model Cache PVC (Advanced)
For large models, use a pre-populated PVC containing model weights instead of downloading from HuggingFace:
```yaml
modelCache:
pvcName: "model-cache"
pvcModelPath: "hub/models--deepseek-ai--DeepSeek-R1"
pvcMountPath: "/opt/model-cache"
```
Requirements:
- The PVC must exist in the same namespace as the DGDR
- The model weights must be accessible at `{mountPath}/{pvcPath}`
### Engine Configuration (Auto-configured)
The controller automatically handles model and backend configuration from high-level fields:
```yaml
# You specify:
spec:
model: "Qwen/Qwen3-0.6B"
backend: vllm
# Controller auto-injects into the profiling job
```
You should **not** manually set model or backend in profiling config overrides.
### Using Existing DGD Configs
Provide a base DGD config via the overrides section:
```yaml
overrides:
dgd:
apiVersion: nvidia.com/v1alpha1
kind: DynamoGraphDeployment
metadata:
name: my-dgd
spec:
# ... your base DGD spec
```
The profiler uses the DGD config as a **base template**, then optimizes it based on your SLA targets.
## Integration
### With SLA Planner
The Profiler generates interpolation data that the SLA Planner uses for autoscaling decisions.
**Prefill Interpolation** (`selected_prefill_interpolation/raw_data.npz`):
- `prefill_isl`: 1D array of input sequence lengths tested
- `prefill_ttft`: 1D array of TTFTs (ms) at each ISL
- `prefill_thpt_per_gpu`: 1D array of throughput (tokens/s/GPU) at each ISL
**Decode Interpolation** (`selected_decode_interpolation/raw_data.npz`):
- `max_kv_tokens`: Total KV tokens capacity in decode engine
- `x_kv_usage`: 1D array of active KV usage percentages [0, 1]
- `y_context_length`: 1D array of average context lengths tested
- `z_itl`: 1D array of ITLs (ms) at each (KV usage, context length) point
- `z_thpt_per_gpu`: 1D array of throughput (tokens/s/GPU) at each point
### With Dynamo Operator
When using DGDR, the Dynamo Operator:
1. Creates profiling jobs automatically
2. Stores profiling data in ConfigMaps (`planner-profile-data`)
3. Generates optimized DGD configurations
4. Deploys the DGD with SLA Planner integration
The generated DGD is tracked via labels:
```yaml
metadata:
labels:
dgdr.nvidia.com/name: my-deployment
dgdr.nvidia.com/namespace: your-namespace
```
### With Observability
Monitor profiling jobs:
```bash
kubectl logs -f job/profile- -n $NAMESPACE
kubectl describe dgdr -n $NAMESPACE
```
## Advanced Topics
### Manual Deployment Control
Disable auto-deployment to review the generated DGD before applying:
```yaml
spec:
autoApply: false
```
Then manually extract and apply:
```bash
# Extract generated DGD from DGDR status
kubectl get dgdr my-deployment -n $NAMESPACE -o jsonpath='{.status.profilingResults.selectedConfig}' | kubectl apply -f -
# Or save to file for review
kubectl get dgdr my-deployment -n $NAMESPACE -o jsonpath='{.status.profilingResults.selectedConfig}' > my-dgd.yaml
```
### Mocker Deployment
Deploy a mocker deployment that simulates engines without GPUs:
```yaml
spec:
model:
backend: trtllm
features:
mocker:
enabled: true # Deploy mocker instead of real backend
autoApply: true
```
Profiling still runs against the real backend to collect performance data. The mocker uses this data to simulate realistic timing behavior. Useful for large-scale experiments, testing Planner behavior, and validating configurations.
### Accessing Profiling Artifacts
By default, profiling data is stored in ConfigMaps. For detailed artifacts (plots, logs, raw data), attach a PVC via overrides:
```yaml
overrides:
profilingJob:
template:
spec:
volumes:
- name: profiling-output
persistentVolumeClaim:
claimName: "dynamo-pvc"
```
**ConfigMaps (always created):**
- `dgdr-output-`: Generated DGD configuration
- `planner-profile-data`: Profiling data for Planner (JSON)
**PVC artifacts (optional):**
- Performance plots (PNGs)
- DGD configurations for each profiled deployment
- AIPerf profiling artifacts
- Raw profiling data (`.npz` files)
- Profiler logs
Access PVC results:
```bash
kubectl apply -f deploy/utils/manifests/pvc-access-pod.yaml -n $NAMESPACE
kubectl wait --for=condition=Ready pod/pvc-access-pod -n $NAMESPACE --timeout=60s
kubectl cp $NAMESPACE/pvc-access-pod:/data ./profiling-results
kubectl delete pod pvc-access-pod -n $NAMESPACE
```
### Output Performance Plots
The profiler generates plots to visualize performance data:
**Parallelization Mapping Sweep Plots:**
- `prefill_performance.png`: TTFT vs Parallelization Mapping size
- `decode_performance.png`: ITL vs Parallelization Mapping size and in-flight requests
**In-Depth Profiling Plots:**
- `selected_prefill_interpolation/prefill_ttft_interpolation.png`: TTFT vs ISL
- `selected_prefill_interpolation/prefill_throughput_interpolation.png`: Throughput vs ISL
- `selected_decode_interpolation/decode_itl_interplation.png`: ITL vs KV usage and context length
- `selected_decode_interpolation/decode_throughput_interpolation.png`: Throughput vs KV usage and context length
## Runtime Profiling (SGLang)
SGLang workers expose profiling endpoints for runtime performance analysis:
```bash
# Start profiling
curl -X POST http://localhost:9090/engine/start_profile \
-H "Content-Type: application/json" \
-d '{"output_dir": "/tmp/profiler_output"}'
# Run inference requests...
# Stop profiling
curl -X POST http://localhost:9090/engine/stop_profile
```
View traces using Chrome's `chrome://tracing`, [Perfetto UI](https://ui.perfetto.dev/), or TensorBoard.
## Troubleshooting
### SLA Cannot Be Met
The profiler logs a warning and updates the SLA to the best achievable value. To improve results:
- Relax SLA targets (increase TTFT/ITL)
- Add more GPU resources
- Try a different backend
- Use a smaller or quantized model
### Profiling Takes Too Long
- Use `searchStrategy: rapid` for ~30s profiling
- Reduce interpolation granularity
- Reduce the GPU search space via hardware constraints
### Out of Memory During Profiling
- Reduce `max_batch_size` in engine config
- Skip larger TP configurations by constraining hardware
- Use a quantized model variant
### Image Pull Errors
Ensure image pull secrets are configured in your namespace for the container registry.
## See Also
- [Profiler README](/dynamo/components/profiler) — Quick overview and feature matrix
- [Profiler Examples](/dynamo/components/profiler/profiler-examples) — Complete DGDR YAML examples
- [Planner Guide](/dynamo/components/planner/planner-guide) — PlannerConfig reference and scaling modes
- [DGDR API Reference](/dynamo/additional-resources/api-reference-k-8-s) — Full DGDR specification