When using the Frame Debugger feature of Linux Graphics Debugger, you may wish to do a deep dive into a specific draw call, in order to analyze your application further. To do this, go to the Frame Debugger menu and select API Inspector. The API Inspector view will open.
The available pipeline stages for a Vulkan application are detailed below.
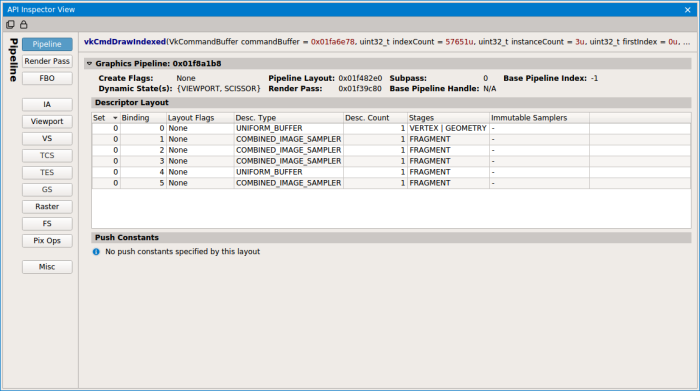
The Pipeline page shows information about the currently bound pipeline object including: create info, pipeline layout, and push constant ranges.
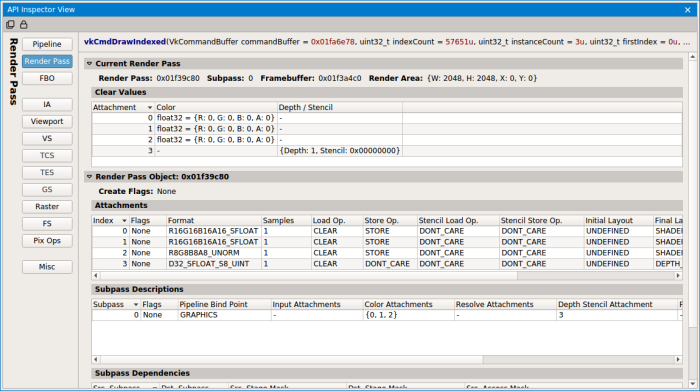
The Render Pass page shows information about the current render pass including: clear values, attachments operations, and sub-pass dependencies.
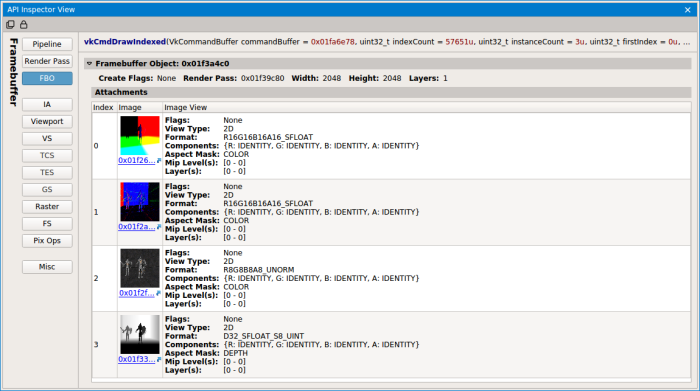
The Frame Buffer Object page shows information about the current frame buffer object including: the creation flags, image view attachments, and the current state of the associated textures.
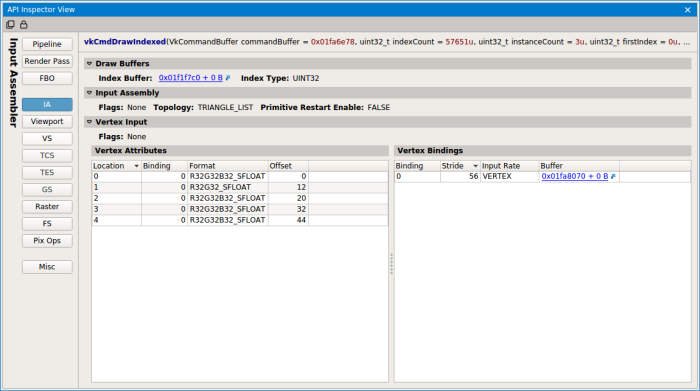
The Input Assembler page shows the layout of your vertex buffers and index buffers, as well as the vertex bindings and attribute information.
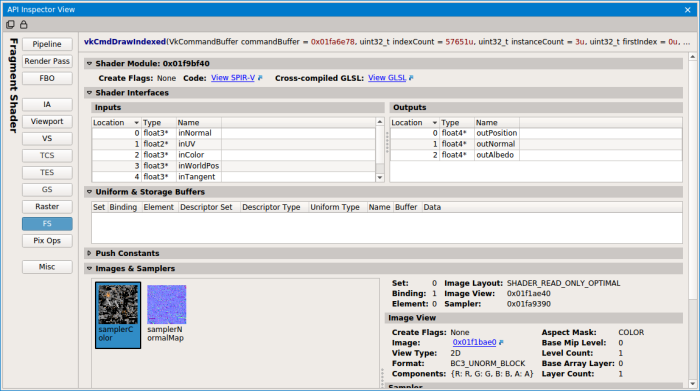
The various shader pages display all of the shader modules, including: creation information, human readable SPIR-V source, current push constants, current bound descriptor sets, associated buffers, associated images and samples, and associated texel buffer views for this stage.

|
NOTE: A future release of Linux Graphics Debugger will add reflection information to these views, to correlate shader information with resources. |
| VS (Vertex Shader) | Vertex shader state, including attributes, samplers, uniforms, etc. |
| TCS (Tessellation Control Shader) | Tessellation control shader state, including attributes, samplers, uniforms, control state, etc. |
| TES (Tessellation Evaluation Shader) | Tessellation evaluation shader state, including attributes, samplers, uniforms, evaluation state, etc. |
| GS (Geometry Shader) | Geometry shader state, including attributes, samplers, uniforms, geometry state, etc. |
| FS (Fragment Shader) | Fragment shader state, including attributes, samplers, uniforms, etc. |
| CS (Compute Shader) | All of the shader resource and unordered access views and constant buffers bound to the Compute Shader stage, as well as links to the source code and other shader information. |
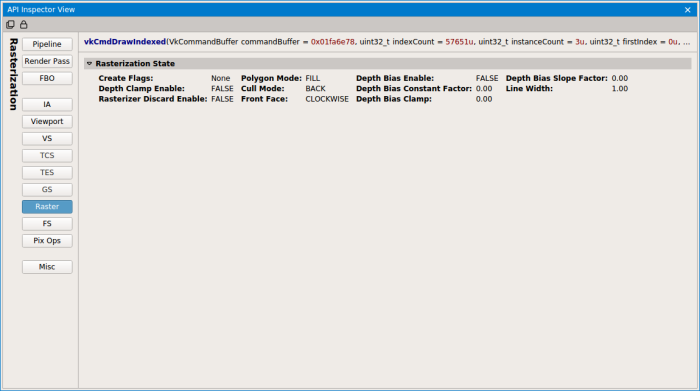
The Raster page shows all rasterization information associated with pipeline object include: polygons modes, cull modes, depth bias, and line widths.
The Pixel Operations page displays information associated with the current pixel state including: depth/stencil state, multi-sample state, and blending state.
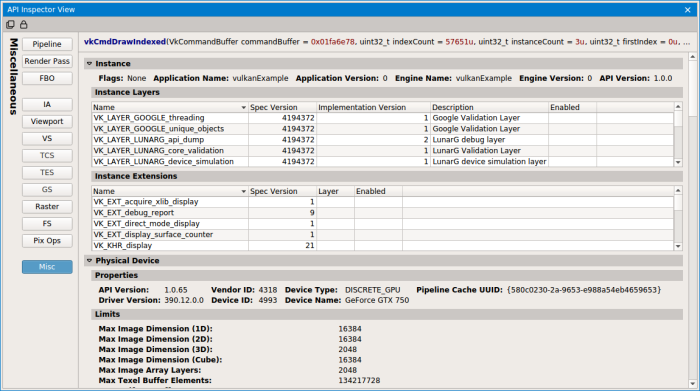
The Miscellaneous Information page shows information related to the instance, physical device(s), logical device(s), and queue(s)

NVIDIA® GameWorks™ Documentation Rev. 1.0.180426 ©2014-2018. NVIDIA Corporation. All Rights Reserved.