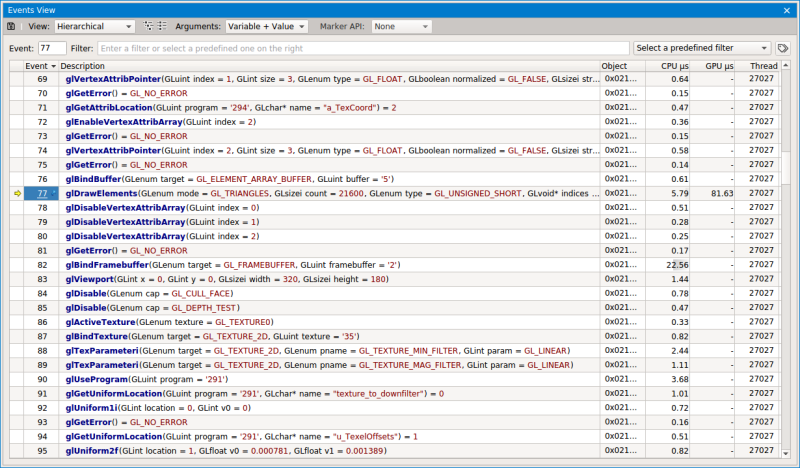
The Events View shows all API calls in a captured frame. It also displays both CPU and GPU activity, as a measurement of how much each call "cost."
You can select whether to view the events in a hierarchical or flat view. If multiple performance marker types are used, you can select the correct one, as well as varying levels of verbosity for the call display (variable + value, value, or none). You can also filter the results to locate a specific event by name and sort by columns by clicking on the column header.
When host memory has updates (i.e., mapped buffer, client side vertex data/index data, etc.), an additional message will be displayed in the Events View.
The Issues column in the Events view shows any issues that were detected in the captured frame, and can vary in severity from warning to error. The types of issues that may be displayed

|
OpenGL errors show a red stop warning in the Issues column. |

|
Redundant state changes — This will warn you that the call to set the state resulted in no change to the state vector. This could be that the state was set to the desired value in some frame before, or it was set back-to-back with no different value in between. |

|
Ineffective draw calls — This warning alerts you to any draw calls that wrote no fragments. Note that this determination may present false negatives when stencil or alpha tests discard fragments, or when fragments are discarded in the fragment shader. |

|
Ineffective clear calls — You may be calling clear buffers that have no effect. This could be that they have done back-to-back clears, or there are no draw calls that actually land different color data to the target. |
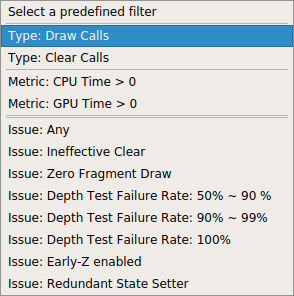
The Filter control can perform basic text matching to filter the events to something in which you might be interested; for example, all glDraw calls. You can also specify Regex matching in the combo box to the right, to do more interesting filtering — like glDraw|glUseProgram — to determine how many draw calls executed for each program.
You can also select one of the predefined filters available in the drop-down menu.
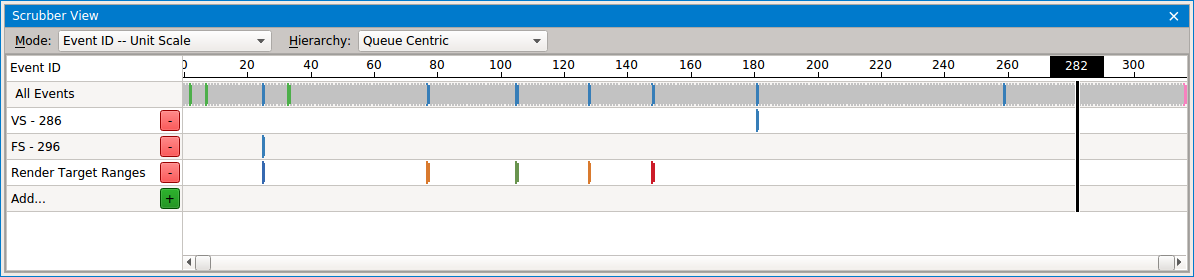
From the results, you can select View in Scrubber, and a new row will appear in the frame scrubber that displays your filtered events.

NVIDIA® GameWorks™ Documentation Rev. 1.0.180426 ©2014-2018. NVIDIA Corporation. All Rights Reserved.