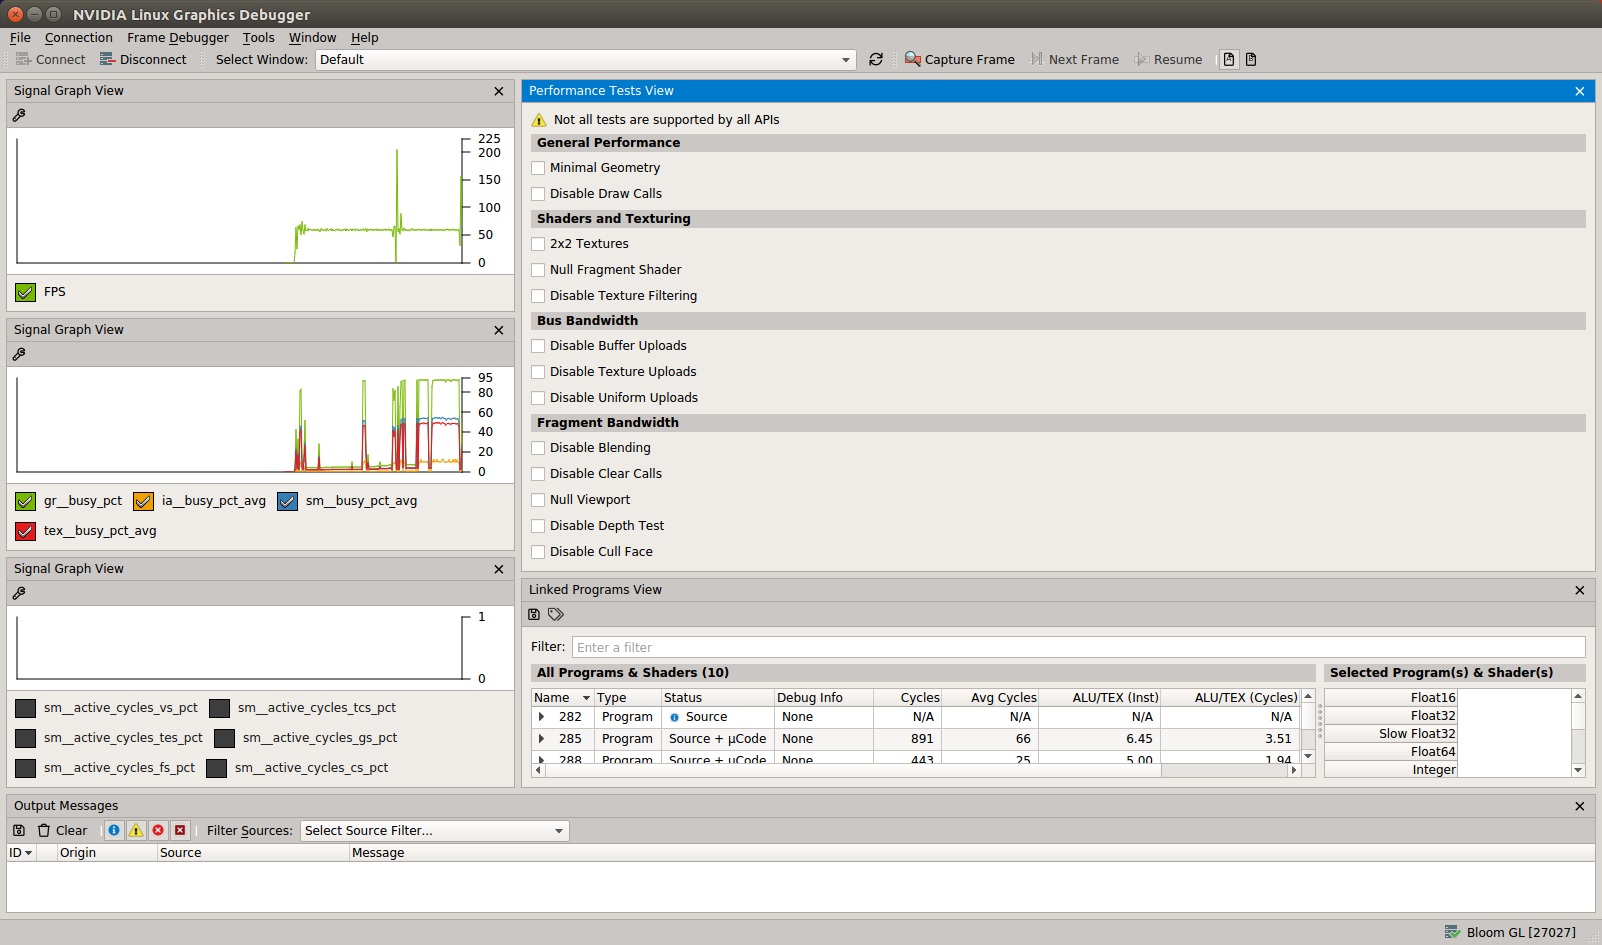
The Performance Dashboard provides a view of application performance, in relation to CPU and GPU activity.
On the left side of the Performance Dashboard, you will see Signal Graphs, which are tool windows that allow you to view various counters given by Linux Graphics Debugger. The graphs can all be customized to host any signal; the data is categorized as the following:
On the right side of the Performance Dashboard, you will see Performance Tests, which should be the first port of call when examining any application's performance. These tests facilitate a quick, high-level identification of performance issues, while the application is still running.
The following Performance Tests are available to use with Linux Graphics Debugger:
This test reduces the amount of geometry submitted to one triangle per draw call. If the frame rate does not go up significantly, the application is likely CPU-bound.
This will bypass every draw call at the API level and then return, resulting in no draws submitted to the driver. This should show significant performance improvement; if not, the application is CPU-bound.
All 2D and Cubemap textures are instantly replaced with small 2x2 textures. If the frame rate goes up, then the texture unit is a likely bottleneck for the scene.
Significant response to this test usually indicates missing mipmaps, heavyweight texture formats, and/or expensive filter modes.
This test shows best-possible performance, if all fragment shaders are optimized to one cycle.
A large delta indicates that the application is fragment-bound; most Tegra applications will fall in this category.
Keep in mind that this test also neutralizes texture-fetch bandwidth. The 2x2 texture test can be used to help identify which factor is key, if there is any doubt which is the primary bottleneck.
This test is used to forcibly disable texture filtering. For applications that use texture filtering extensively, this test will significantly improve performance.
This test shows if CPU-to-GPU buffer transfers (via
glMapBufferorglBufferData) are adversely affecting the application's performance.
This test shows if CPU-to-GPU texture transfers (via the
glTexImagefamily of functions) are adversely affecting the application's performance. GPU-to-CPU transfers and GPU-to-GPU transfers, such as those usingGL_PIXEL_UNPACK_BUFFER, are not affected.
This test shows if CPU-to-GPU uploads of OpenGL uniform variables are adversely affecting the application's performance.
This test shows if pixel overdraw is adversely affecting the application's performance. Using this, all drawing will be performed, but alpha blending modes will be disabled.
This test shows if clearing the frame buffer is causing a performance bottleneck. Using this, all drawing will be performed, but clear calls will be disabled.
This test shows best-possible performance when no fragments are rendered. For example, when all geometry is processed (vertices are shaded, triangles are clipped).
If there is no performance improvement from this test, the application is likely vertex bound.
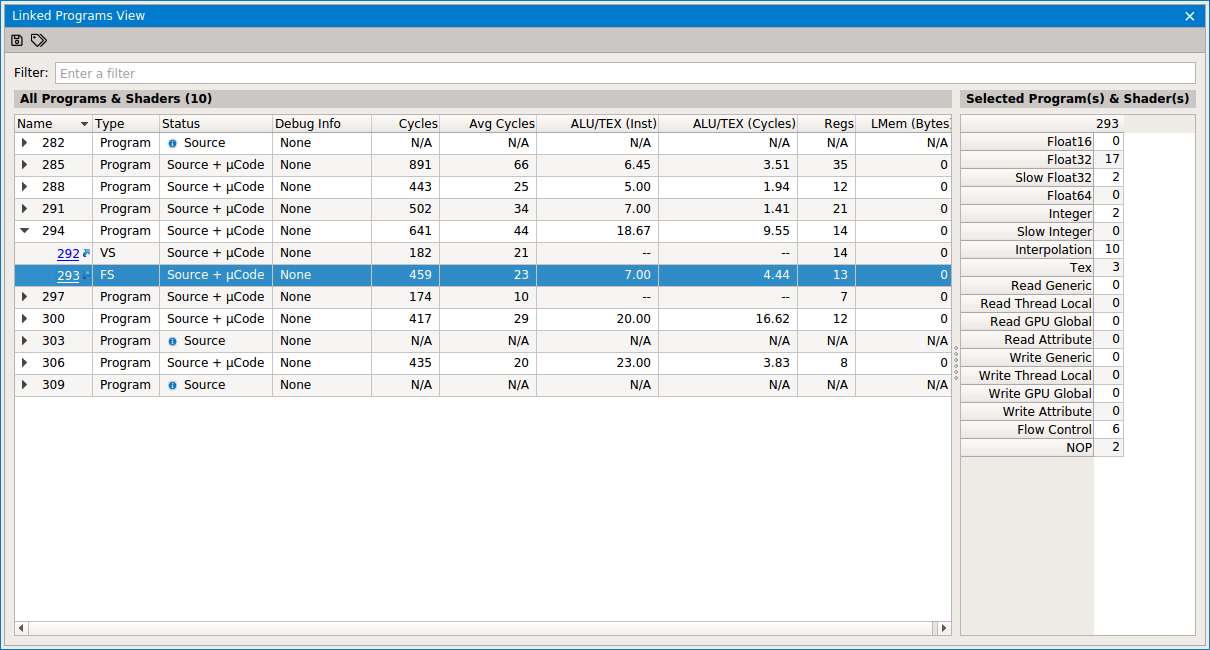
Below the Performance Tests is the Linked Programs View. This view lists all of the linked programs in the application, with their constituent shaders. Note that if the program hasn’t been used by the application yet, it will show up as Waiting…, and if the program has been used but the statistics are being calculated, it will show up as Calculating…. You can view the individual shaders by pressing the plus button the left of the program name you are interested in. The list also contains a number of statistics:
At the top left of the view, next to the save button, there is an icon to show shader usage; clicking this button will create a new row on the scrubber that highlights where in the scene that particular shader is used.
This is a field that can be attached to the program or shader using the
KHR_debugextension, specifically theglObjectLabelcall.
This value is the absolute cost for a single primitive (vertex, tessellation control point, fragment, etc.) to execute through the shader. The value takes into account latency for memory accesses, but it does not take branching or loops into account. The values are summed up at the program level to show the absolute cycle count for a single fragment to be rendered on the screen.
Since primitives are submitted in large groups, this gives an average cycle cost for a single primitive, assuming it is submitted as a larger block of work (for instance, many fragments from the same object with the shame shader). The values are summed up at the program level.
This gives the ratio of ALU to texture instructions for the shader. The values are averaged at the program level.
Since not all ALU calls are the same cost in terms of cycles, this value gives the ratio of cycles spent in ALU versus texture instructions. The values are averaged at the program level.
This column gives the number of registers used by the program. Register count impacts occupancy/threads in flight so if the value gets too high you will get closer to the Cycles value than the Avg Cycles value.
This is the number of bytes of local memory used by the shader. Similar to registers, this can impact occupancy and contribute to a lower overall throughput of primitives running this shader.
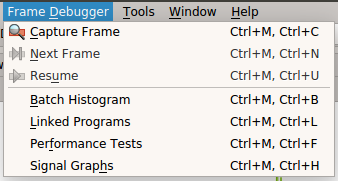
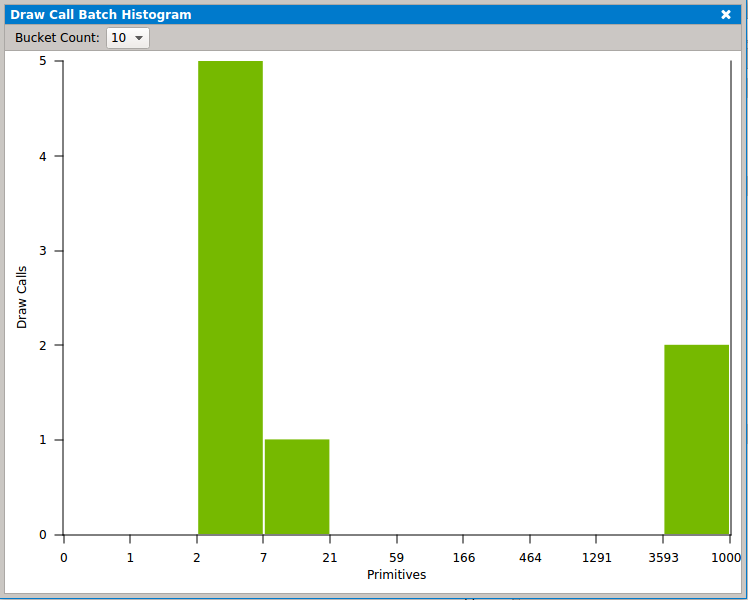
From the Frame Debugger menu, you can select the Batch Histogram view.
The Batch Histogram view is used to visualize draw call buckets, based on primitive count..
The buckets in this view are refreshed every 1.5 seconds.

NVIDIA® GameWorks™ Documentation Rev. 1.0.180426 ©2014-2018. NVIDIA Corporation. All Rights Reserved.