By default, the application project set as the startup project will be debugged. To set a project for startup, right-click on it and select Set as Startup Project. A different project can also be debugged by right-clicking on the project and selecting the Debug > Start new instance menu.
An application can be installed, run, and debugged on the device using the Start Debugging button or menu. By default, Visual Studio will prompt to build the project if it is out of date. This can be changed using the Project and Solutions > Build and Run > On Run, when projects are out of date option.
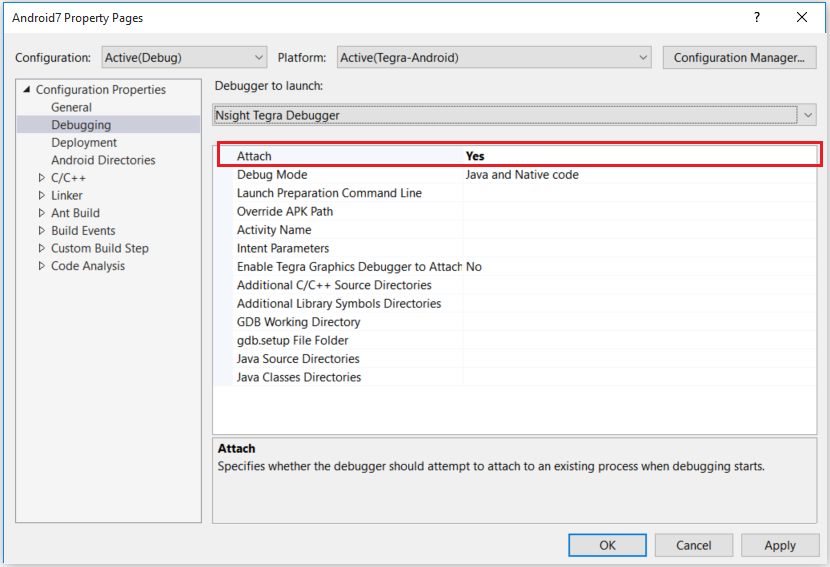
By default when a project is started it will install, run, and attach to the application process on the device. If the application has already been installed and is running on the device, the debugger can be set to attach to the existing process. This can be selected in the project’s Debugging properties.
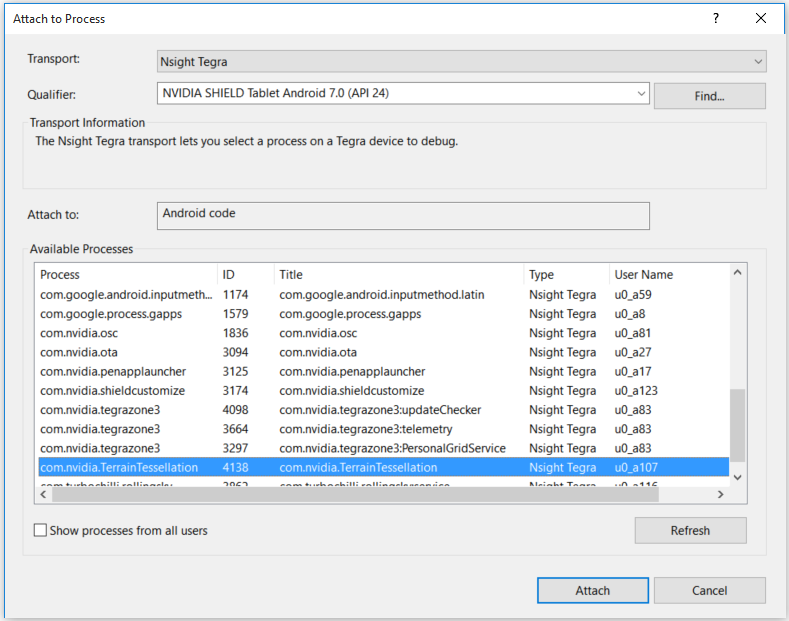
An existing process can also be attached by using the Debug > Attach to Process… menu. This will open the Visual Studio Attach to Process dialog.
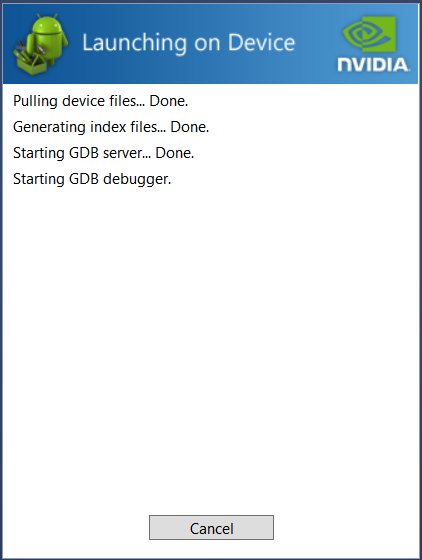
Nsight Tegra. Once an application is launched or attached, a status dialog will be displayed. If the connection is successful, the debug session will start. If the connection fails, information about the error will be displayed in the status dialog.
When debugging is stopped, a launched program will be terminated. An attached program will continue to run on the device.
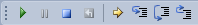
The Debug toolbar can be used to control execution of the program.
When a source file is active, a source step will be performed. When the Disassembly window is active, an instruction step will be performed.
Breakpoints are set by clicking in the vertical margin of a source file, or by using the toggle breakpoint menu item (F9).
The debugger will stop program execution when the breakpoint is encountered. Breakpoints can be set before a project is launched.
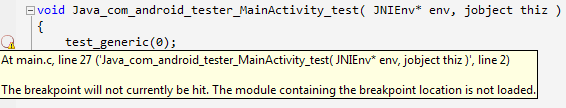
When debugging, if a breakpoint fails to set, it will be annotated with a warning and the tooltip will include information. If a breakpoint is set in the source for a module that has not loaded yet, it will be marked pending.
When the module is loaded, the breakpoint will set and update in the source file.
 | Note: Pending breakpoints are only available using NVNDK GDB 7.2. The NDK GDB 6.6 does not support library load events. |
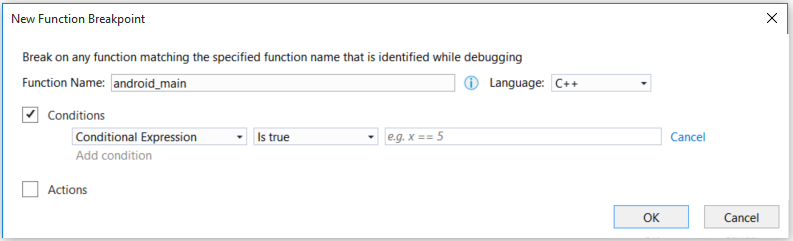
A breakpoint can be set on a named function using the Debug > New Breakpoint > Function Breakpoint… menu.
The breakpoint will stop the program when the function is entered.
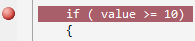
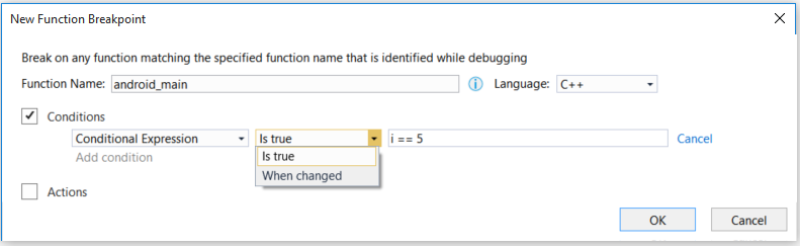
A condition can be set for a breakpoint by checking the box next to Conditions, and selecting Conditional Expression from the first drop-down menu. A valid GDB expression can be entered for the condition. Only expressions that result in a ‘true’ evaluation are supported. Breaking on an expression When changed is not supported.
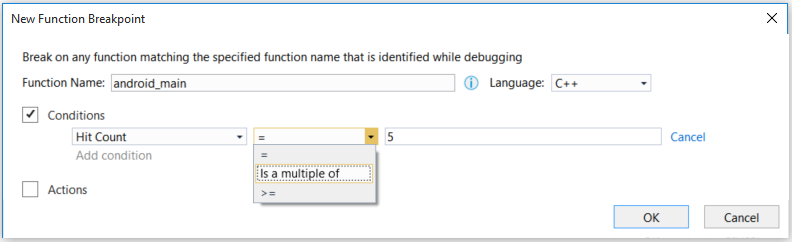
A breakpoint can be set to stop after it is hit a specified number of times by selecting Hit Count from the first drop-down menu under the Conditions checkbox.
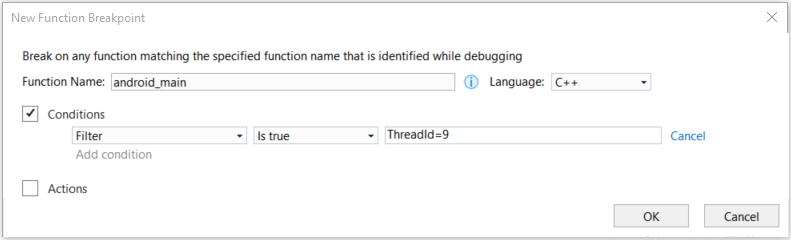
A filter can be set for a breakpoint by selecting Filter from the first drop-down menu under the Conditions checkbox.
A breakpoint in code that is called by multiple threads can be set to stop only for certain threads by using the ThreadId or ThreadName intrinsics.
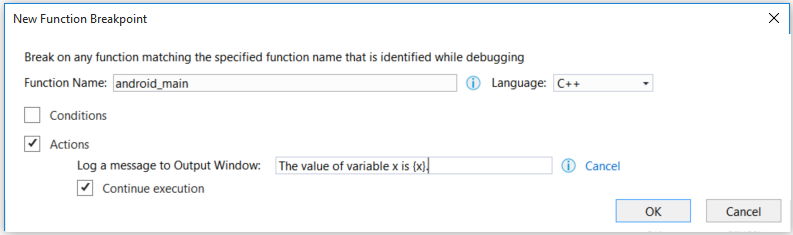
A breakpoint can be set to print a message when it is hit. Select the checkbox next to Actions, and enter the message in the field next to Log a message to Output Window. Instead of stopping on the breakpoint, the debugger will print the message when it is encountered. The message will be printed to the Debug pane of the Output window.
Note: Attempting to step over a function containing a tracepoint will cause the debugger to stop at the tracepoint.
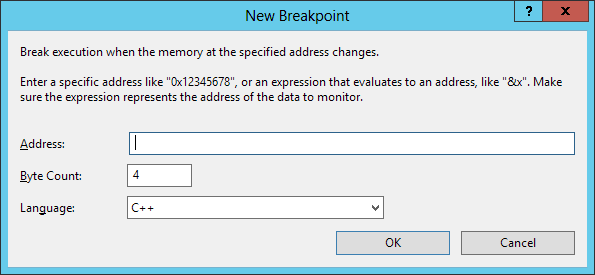
Watchpoints stop the program when the specific address in memory is read or written. There are two ways to set up a watchpoint in Nsight Tegra. First, you can select the New > New Data Breakpoint... menu item in the Breakpoints window and specify an address or an expression to watch, which will create an on-write watchpoint.
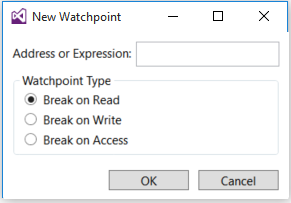
The other option is to use the Tegra > Debug > New Watchpoint menu item ( on the toolbar), which will bring up a dialog that allows you to choose the type of the watchpoint.
On-access watchpoints stop the program when the memory is either read or written.
| Note: There is a device-dependent limit on amount of watchpoints that can be active at any given time. Exceeding this limit will trigger an error. |
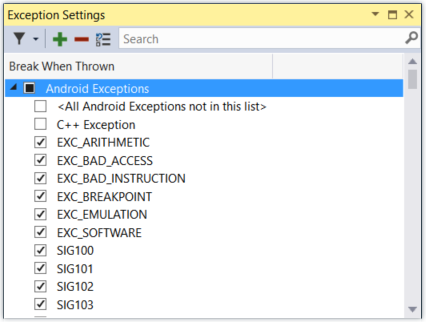
Signals are asynchronous events similar to Windows Exceptions that can happen in the program. Some signals are user-generated, and others are due to issues like segment faults. Linux-based OSs define many signals that can occur during program execution. The signals can be configured in the Visual Studio Exceptions dialog accessed from the Debug > Exceptions… menu. The signals are located under Nsight Tegra Exceptions. The debugger can be set to pause for a signal, much like a breakpoint. This setting will be remembered between debug sessions.
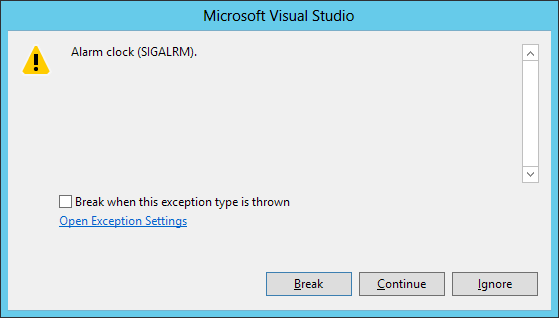
If the debugger is set to stop for a signal, the debugger will prompt when the signal occurs. You can choose to Break or Continue program execution, executing any signal handlers. You can also choose to Ignore the signal, and continue the program execution.
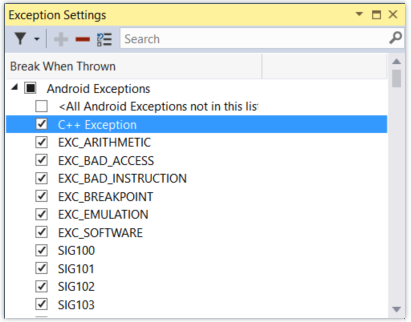
The debugger can be set to stop for C/C++ exceptions. This is enabled in the Visual Studio Exceptions Dialog accessed from the Debug > Exceptions… menu.
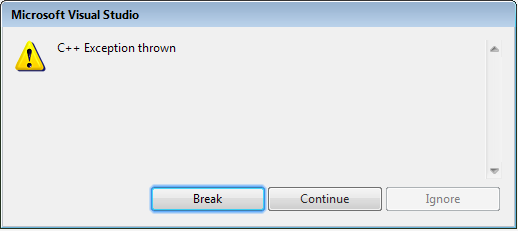
If enabled, the debugger will prompt when a C++ exception is thrown and you can choose to stop or continue program execution.

NVIDIA® GameWorks™ Documentation Rev. 1.0.211026 ©2014-2021. NVIDIA Corporation and affiliates. All Rights Reserved.