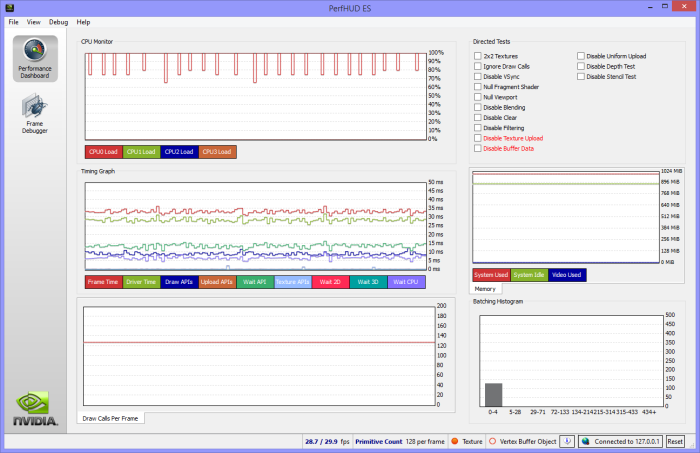
Figure 3. Performance Dashboard.
This is the initial mode after a new connection is established. Multiple graphs are shown conveying GPU and driver performance statistics, as shown in Figure 3. The user can also change the running application’s animation speed or perform simple experiments.
Figure 3. Performance Dashboard.
The Speed Bar is a horizontal slider at the top that allows the user to set the application’s animation speed.
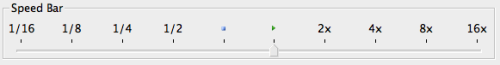
Figure 4. Speed Bar.
The slider is hidden if the application does not use the eglGetSystemTimeNV extension (see How PerfHUD ES Controls Speed below).
In a given iteration of a game loop, the physics or animation is dependent upon the elapsed time since the previous iteration of the loop. Games should use the system time extension (Appendix A) to determine elapsed time. This allows PerfHUD to control the speed by modifying the returned time values. For example, when the user moves the Speed Bar slider to ¼ speed, the values returned by eglGetSystemTimeNV are four times slower than the true time.
If the application does not use the system time extension, then PerfHUD cannot control speed, so the speed slider is not shown. PerfHUD can still pause the application for the Frame Debugger and Profiler modes, but in those cases, the pause is achieved by simply blocking the call to the currently set frame delimiter (eglSwapBuffersby default). In this instance, the frame delimiter call does not return until the user switches back to Performance Dashboard mode.
The Frame Delimiter dialog can be displayed by selecting the Set frame delimiters option from the Debug menu. The dialog will appear as in Figure 5:
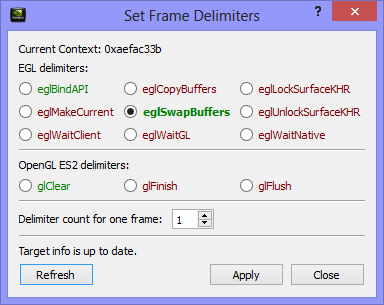
Figure 5. Frame Delimiter selection

|
Note: If PerfHUD ES is connected to a device running an older version than 2.26, the dialog box will appear differently, and may not contain all of the options displayed in Figure 5. |
The Frame Delimiter dialog allows the user to define which API call represents the end of a given rendering frame. This value is used when collecting information for both the Frame Debugger and Frame Profiler. When the dialog is first loaded, the current delimiter will be in bold font (by default, this is eglSwapBuffers).
All API functions that have been detected in the target application will be colored green, while unused API functions will be red. Note that it is possible to select a red API call as the frame delimiter; however, the Frame Debugger and/or Frame Profiler information will not be valid until the selected API function is called in the target application.
The user can only select one GL/EGL API function as a frame delimiter. The spinbox in the dialog box defines the delimiter hit count for one frame – for example, how many current delimiters are in one frame.
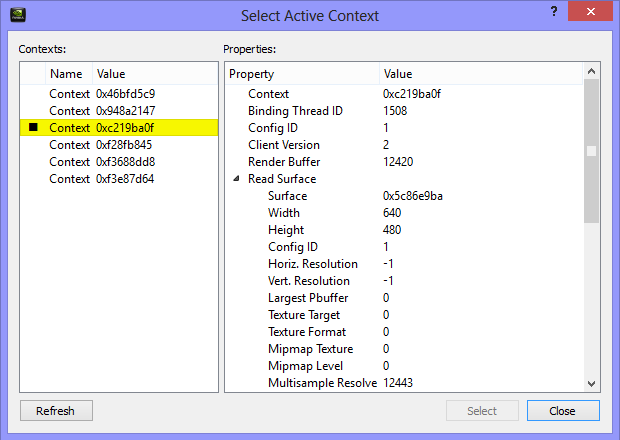
The Select Active Context dialog can be displayed by selecting the Select active context... option from the Debug menu. The dialog will appear as in the below figure:
|
|
Note: If PerfHUD ES is connected to a device running an older version than 2.26, the Select active context... menu will always be disabled, and the dialog box will not be available. |
The Select Active Context dialog allows the user to change active context. Most real applications contain multiple contexts. Different contexts have different roles in drawing the frame. This feature allows user to debug the performance data, frames, and profiling data of the interested context.
All contexts used in the application will be shown in the Contexts pane on the left side of the dialog box. A small black square indicates the active context. When a user clicks an item in the list, the context information will be updated in the property tree on the right pane of the dialog box. To change the active context, a user can simply double-click the item in the Contexts list, or click the Select button.
|
|
Note: If you see Need to set correct delimiter in red text at the bottom of the dialog, it means you selected a context with an inactive delimiter. You need to open the Set Frame Delimiter dialog and select an active delimiter (displayed in green), in order to make the debug and profiling data available. |
Some contexts may be inactive. If an inactive context is selected, no data will be available in all modes. You must change to one of other active contexts.
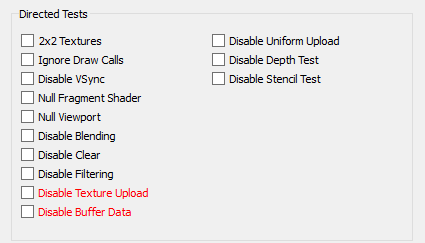
Game developers often perform simple experiments to find bottlenecks. Without PerfHUD, experimentation can be an arduous process because developers must repeatedly modify their source, then recompile and rerun the application. PerfHUD enables immediate experimentation without these steps, using the Directed Tests pane from the Performance Dashboard. The Directed Tests are a set of checkboxes that can force the graphics pipeline into certain states. This gives vital feedback in an interactive, real-time fashion.
The following experiments are available:
DrawArrays and DrawElements calls. If the frame rate goes up, then the application is likely GPU bound, otherwise it is CPU bound either in the application or in the driver.eglSwapInterval to eliminate flicker, which can cause the frame rate to snap to a certain frequency. Using this directed test enables the developer to observe the “true” graphics performance of the application.glBufferData or glBufferSubData are ignored. Similar to the Disable Texture Upload test, this test can indicate a problem with data loads. |
|
Note: The number of directed tests available depends on the version of PerfHUD ES you are using. Some tests may not be available in older versions. |
The Performance Dashboard has several panes dedicated to “heart rate” style scrolling line graphs. These include the Memory, Timing, and Draw Calls Graphs. The Timing Graph has several data channels, where each channel corresponds to a counter object in the EGL_NV_system_time extension (Appendix A). The graphs enable developers to view data produced from using the EGL_NV_system_time extension without modifying their application code. The visibility of each counter can be toggled by clicking the legend buttons.
The list of counters may include the following:
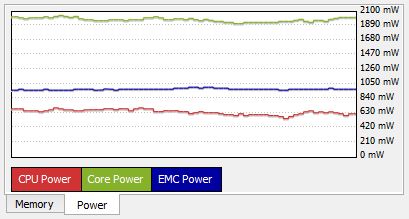
The Power Graph is only available when using PerfHUD ES with a SHIELD device. When a user connects PerfHUD ES to a SHIELD, the Power Graph will display as a tab next to the Memory graph.
The Power Graph includes three counters: CPU, Core, and EMC. These display the three parts of the system's hardware power status. All units are displayed in milliwatts.
The batching histogram gives a birds-eye view of how primitives in a particular frame are distributed. A common performance problem occurs when an app uses too many calls to DrawArrays and DrawElements to draw a frame, and each call contains relatively few primitives. Because of the inherent per-call overhead, it is much more efficient to make fewer calls to DrawArrays/DrawElements, and include a large number of primitives in each call. The histogram is a quick way to gauge the efficiency of an application’s batch distribution. Figure 4 is an example of a good distribution, because it has tall bars on the right and short bars on the left.
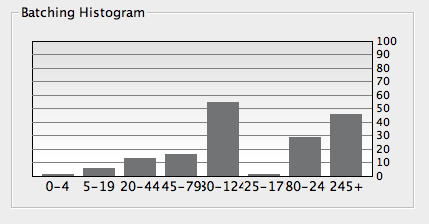
Figure 6. Example of a good distribution in a batching histogram.
In this particular example, there is one draw call that contains between 5 and 19 triangles (inclusive), two draw calls that contain between 20 and 44 triangles, one draw call that contains between 80 and 124 triangles, and nine draw calls that contain over 245 triangles each.
The histogram is also interactive. The user may click any of the columns to disable the draw calls that have primitive counts in that range. If the frame rate increases dramatically, then the developer knows that the culled batch has a large impact on performance. When a batch is culled, the bar is shown in light gray. Clicking a culled batch restores it to normal.
This icon will blink when texture uploading APIs like glTexImage*() or glTexSubImage*(), or when compressed texture uploading APIs are called during current frame. When you have this notification, you should pay attention to your application. Texture uploading will significantly affect performance. In general, texture should be uploaded only once before rendering.

NVIDIA® GameWorks™ Documentation Rev. 1.0.211026 ©2014-2021. NVIDIA Corporation and affiliates. All Rights Reserved.