In this section, you will find a brief quickstart guide to using PerfHUD ES, followed by a more in-depth user guide, as well as a guide that will walk you through how to analyze your application's performance using PerfHUD ES.
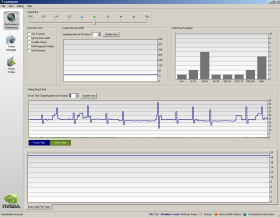
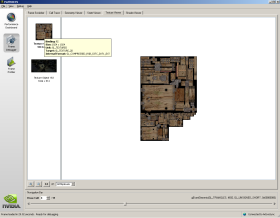
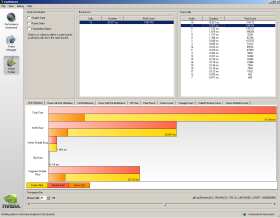
PerfHUD ES provides in-depth analysis of OpenGL ES applications on Tegra based devices. In order to target optimizations where they are most needed, developers are given access to GPU performance and bottleneck information. The debugging capabilities provide insight into the state of the OpenGL ES pipeline, related textures and shaders, and all rendering states to help find the causes for improper setup and rendering anomalies.
|
|
|
To see the latest release notes on PerfHUD ES, click here.
Check out the PerfHUD ES QuickStart guide.
Read the PerfHUD ES User Guide.
To learn more about how to analyze your application's performance using PerfHUD ES, click here.

NVIDIA® GameWorks™ Documentation Rev. 1.0.211026 ©2014-2021. NVIDIA Corporation and affiliates. All Rights Reserved.