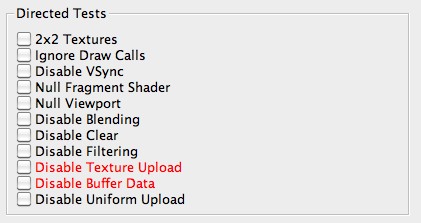
The dashboard is the initial view of application performance. It presents a set of graphs showing per-core CPU load along with various aspects of graphics performance, and a set of "directed tests." These directed tests should be the first port of call when examining any application's performance. They facilitate quick, high-level, identification of performance issues while the application is running.

All 2D and Cubemap textures are instantly replaced with small 2x2 textures. If the frame rate goes up, then the texture unit is a likely bottleneck for the scene.
Significant response to this test usually indicates missing mipmaps, heavyweight texture formats, and/or expensive filter modes.
This should show significant performance improvement; if not, the application is CPU-bound. See Caveats for more details.
The application may use eglSwapInterval to eliminate flicker, which could cause the frame rate to snap to a certain frequency.This directed test allows the developer to see the “true” graphics performance of the application.
Before experimenting with other directed tests, you should enable this option and ensure that enabling and disabling it does not impact timing.
This test shows best-possible performance, if all shaders are optimized to one cycle.
A large delta indicates that the application is fragment-bound; most Tegra applications will fall in this category.
Keep in mind that this test also neutralizes texture-fetch bandwidth. The 2x2 texture test can be used to help identify which factor is key, if there is any doubt which is the primary bottleneck.
This test shows best-possible performance when no fragments are rendered. For example, when all geometry is processed (vertices are shaded, triangles are clipped).
If there is no performance improvement from this test, the application is likely vertex bound. See Caveats for more details.
This test shows if pixel overdraw is adversely affecting the application's performance. Using this, all drawing will be performed, but alpha blending modes will be disabled.
This test shows if clearing the frame buffer is causing a performance bottleneck. Using this, all drawing will be performed, but clear calls will be disabled.
This test forcibly disables texture filtering. With applications that use extensive texture filtering, using this test will significantly improve performance.
This test shows whether or not your application is texture-data bound. Using this, all API calls that update texture data will be blocked; if the frame rate increases, then your application is texture-data bound.
NOTE: Once this test is enabled, the original texture updates may not be recoverable, so you may need to restart the application.
Similar to the Disable Texture Upload test, this test shows any problems with data loads. Using this, all calls to glBufferData or glBufferSubData are ignored.
NOTE: Once this test is enabled, the original buffer data may not be recoverable, so you may need to restart the application.
Similar to the Disable Buffer Data test, this test shows whether or not data uploads are causing your bottleneck. Using this test, all calls to update uniform settings will be blocked.
The dashboard contains another very useful feature. The two small indicators in the lower right of the status bar, labeled Texture and Vertex Buffer Object. These indicate when the dispatched scene contains dynamic texture and vertex buffer updates. Both of these can significantly affect performance, if not managed correctly.

Keep an eye on these indicators, as they serve as an early warning mechanism for certain key, potentially pathological, performance problems.

NVIDIA® GameWorks™ Documentation Rev. 1.0.211026 ©2014-2021. NVIDIA Corporation and affiliates. All Rights Reserved.