Figure 9. Frame Debugger loading a frame.
When the user clicks the Frame Debugger button, PerfHUD pauses the application and loads in all the OpenGL states (including textures, vertex buffers, and shaders) that comprise the frame. The time it takes to load in a frame is related to the frame complexity. During the load, a progress bar is displayed in the status bar as seen in Figure 9.
Figure 9. Frame Debugger loading a frame.
Because of PerfHUD’s multi-threaded architecture, the user can interact with the Frame Debugger even while the frame is being loaded. At any time, the user can "scrub" through draw calls using the Navigation Bar. The Frame Debugger has several inspection tabs that allow the developer to drill down into the OpenGL ES pipeline, as well as inspect textures and shader programs. The inspection tabs are tied together via the Navigation Bar.
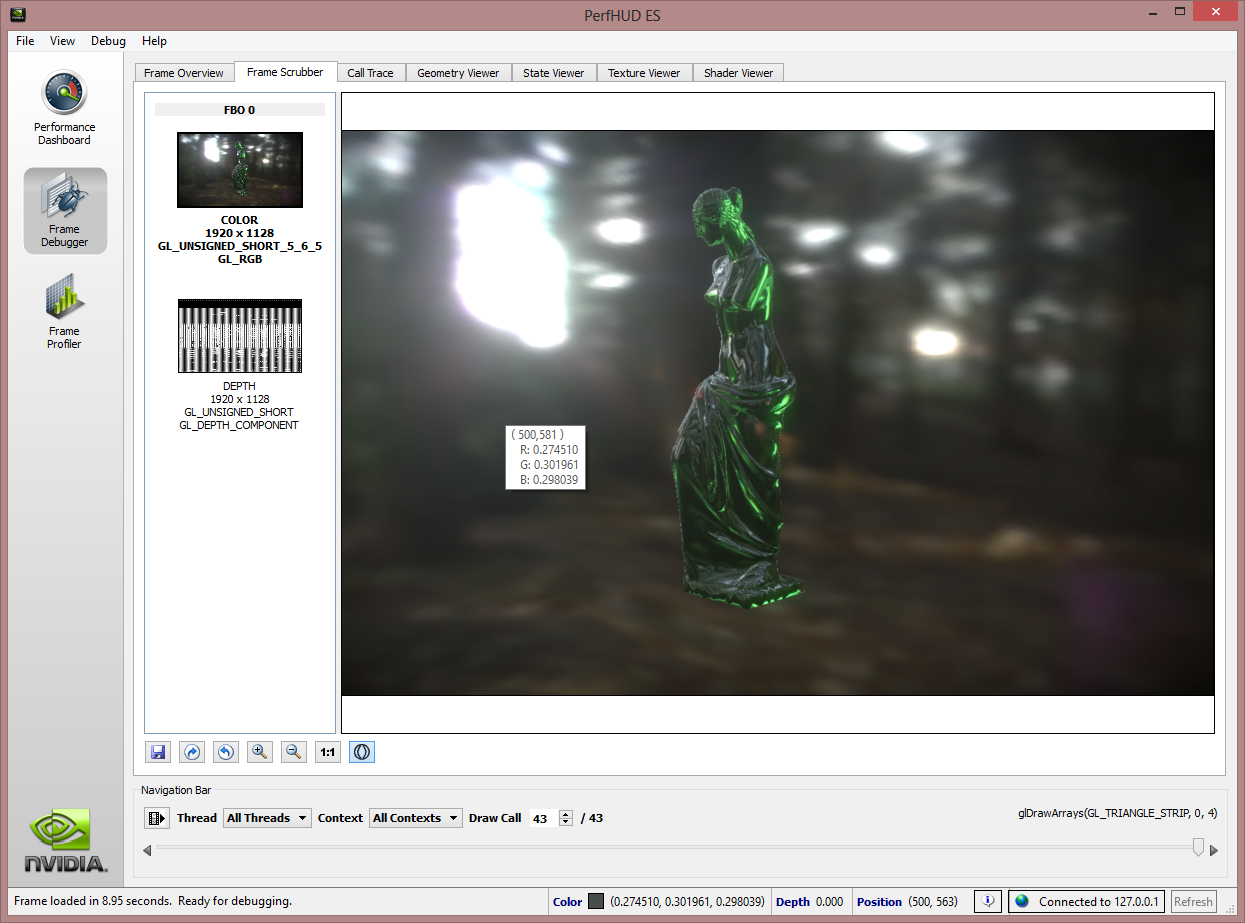
The Frame Scrubber is the default tab. It allows the developer to view the frame buffer at each draw call during the rendering process. Thumbnail buttons are shown for layers (if they exist) such as Color, Depth, and Stencil. By dragging the navigation slider, the developer can watch how the frame is drawn, and the toolbar has buttons that allow the user to rotate and zoom the image. When hovering over the image, the mouse cursor changes to a crosshair, and the current color values at that pixel are shown in the status bar. Details about the frame buffer such as size and format are available in a ToolTip, which can be shown by hovering over a thumbnail. The current draw call is optionally highlighted within the scene.
PerfHUD can generate the images for the Frame Scrubber in two ways: it can either capture bitmap(s) from the frame buffer of the target device, or it can emulate the OpenGL calls that were used to draw the frame. (The latter method is not available on some platforms.) The user may switch the rendering method using the View menu under "Scrub Mode." Capturing a bitmap has the advantage of being more accurate, but at the cost of requiring a longer load time.
On the far left of the Frame Debugger tabs, you'll find the Frame Overview.
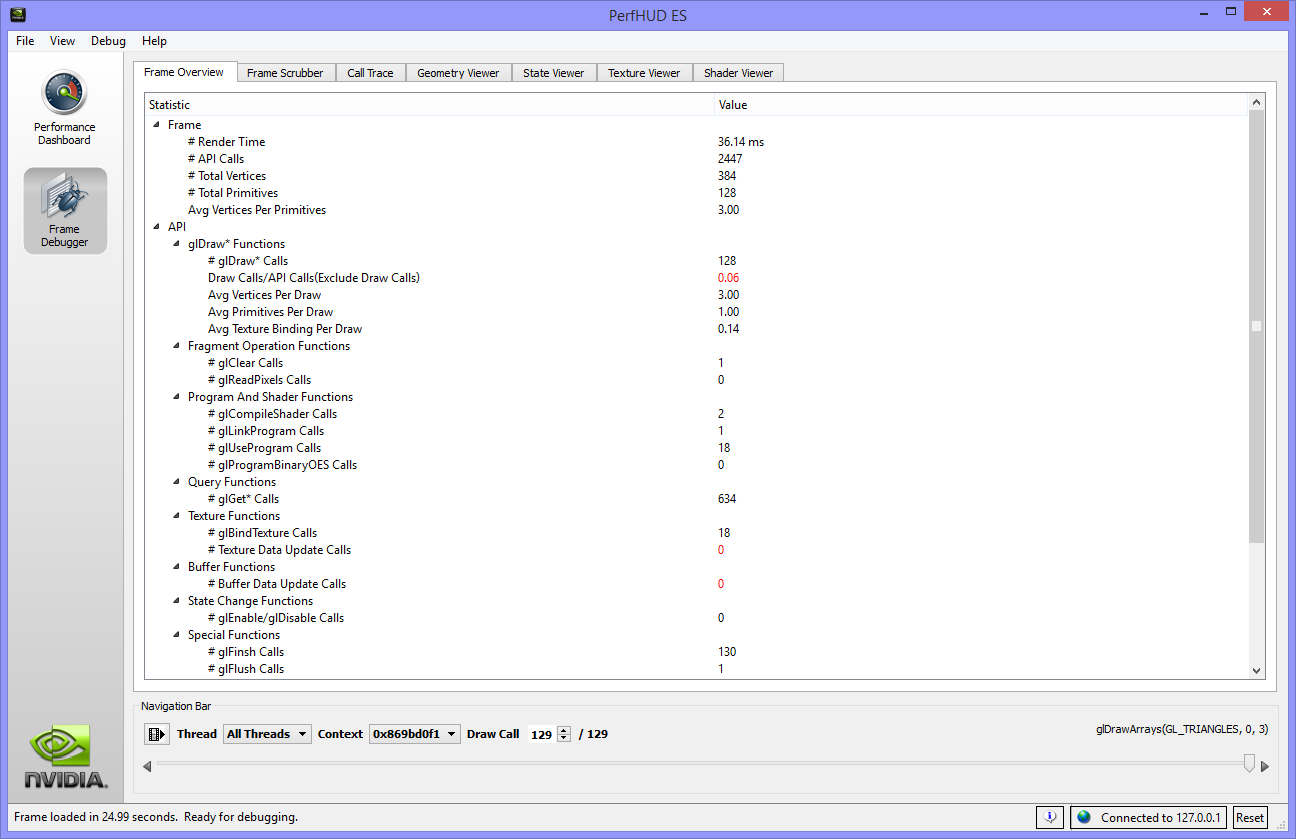
The Frame Overview tab displays the statistics of the parameters of the frame, types of GL API calls, and the usage of GPU Resources. The values reflect the basic status of how the application has rendered the current frame.
The Call Trace tab displays a list of all OpenGL and EGL function calls that were used to draw the frame. The current draw call is highlighted in yellow and this is updated when the user scrubs through the frame. Function calls that cause OpenGL errors are highlighted in red. Hovering the mouse over a red line provokes a ToolTip that describes the error. The buttons in the toolbar allow the user to export the log to a text file, or jump to the previous/next error.
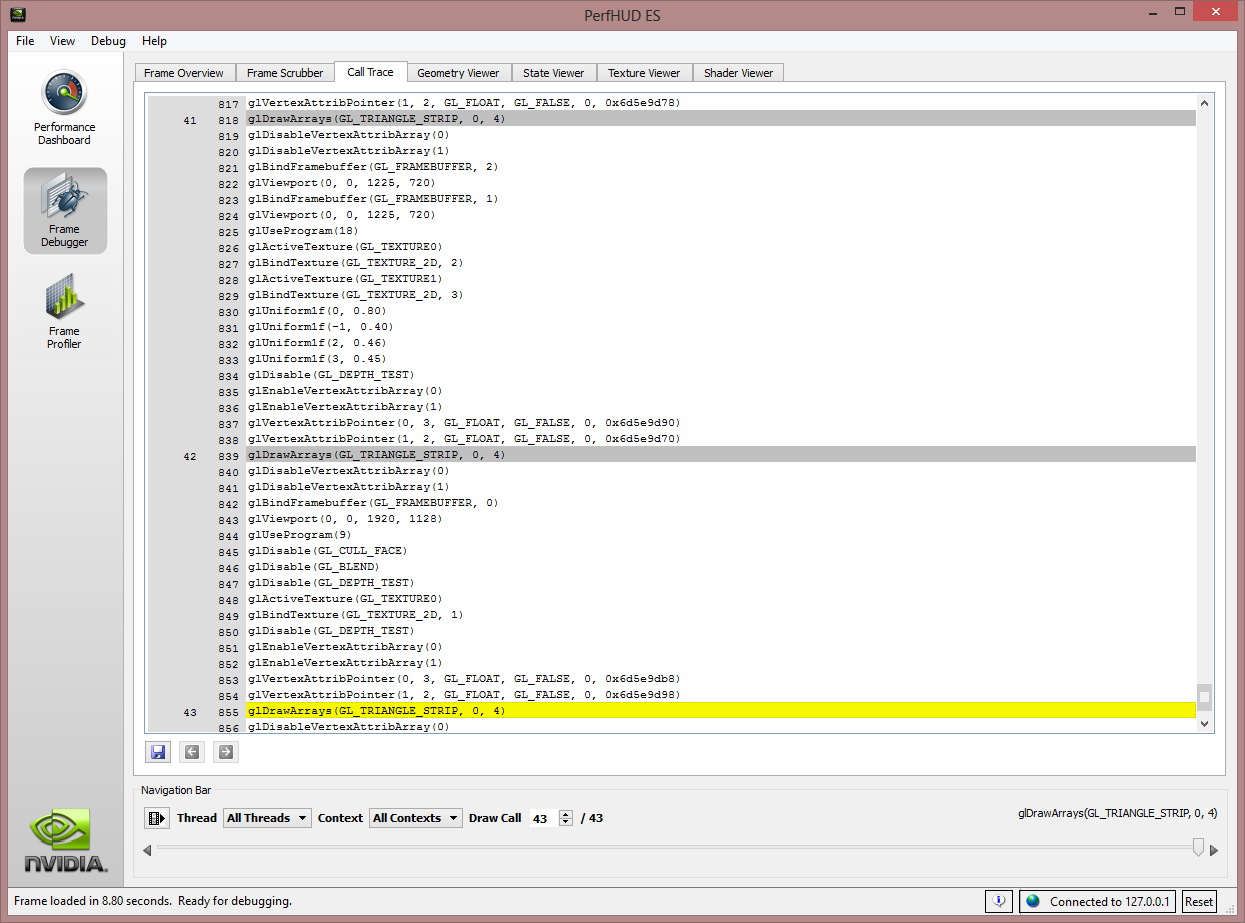
Figure 10. Call Trace screen.
The Geometry Viewer tab shows a 3D view of the current draw call. The geometry is automatically scaled and translated so that the developer can clearly visualize the model. The left pane shows information about all enabled attribute arrays. The visualization mode (e.g., wireframe, hidden line, etc.) can be changed using the toolbar.
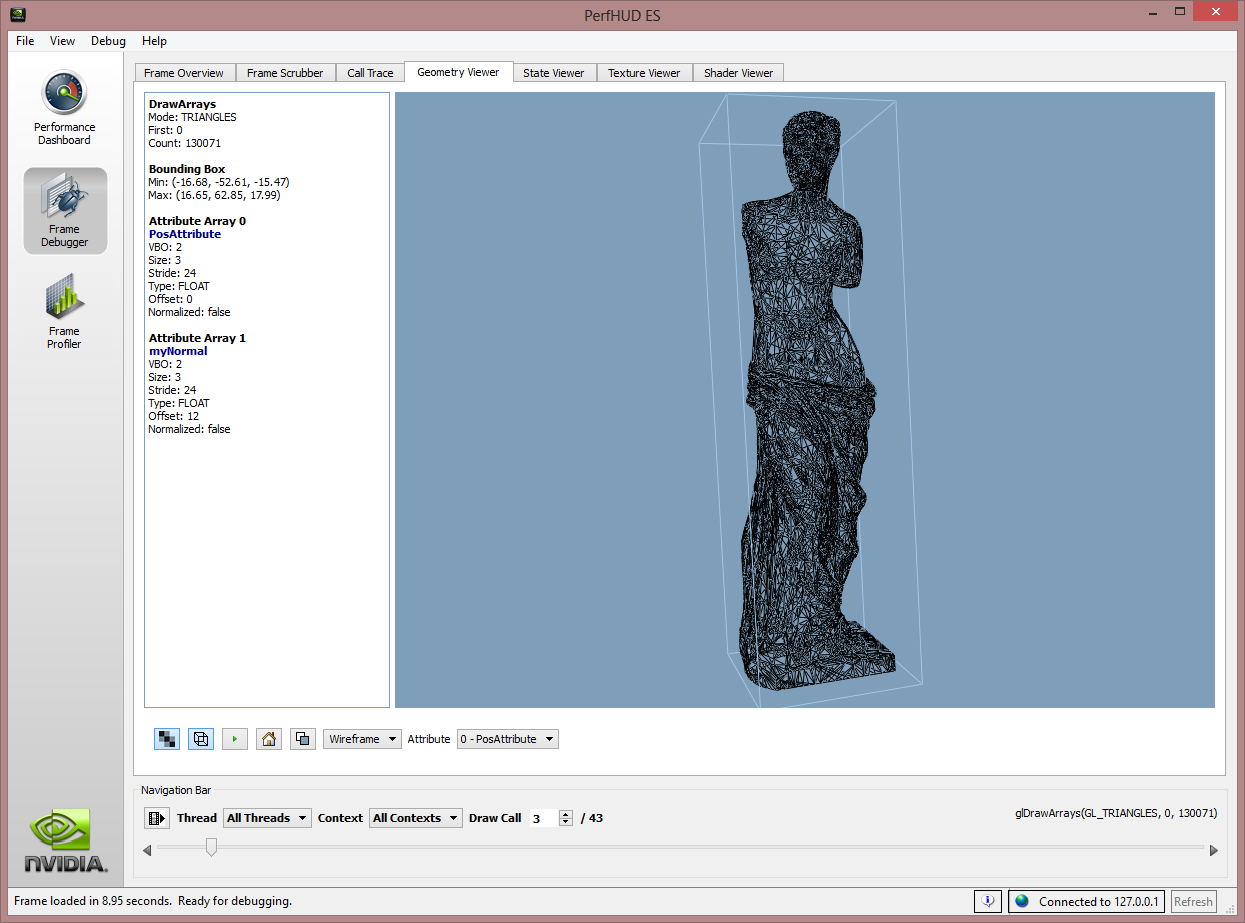
Figure 11. Geometry Viewer.
By default, the geometry in an “auto-spin” mode; the model slowly spins in a manner that allows the developer to see it from all angles. At any time, auto-spin can be canceled by clicking or dragging the mouse on the 3D view. Dragging the mouse spins the geometry using trackball rotation. The user can restart auto-spin by clicking the play button the toolbar.
If the target device supports OpenGL ES 2.0, then any vertex attribute may be interpreted as position. In this case, PerfHUD provides a drop-down list that allows the user to choose the generic attribute to visualize.
Some types of geometry, such as stencil volumes, have virtually infinite bounding boxes and cannot be displayed. Keep in mind that skinning operations (i.e., vertex blending) are not emulated within the geometry viewer because PerfHUD only shows the pre-transformed positions.
The State Viewer displays a tree view of all OpenGL ES state. The toolbar allows the user to export the information to a text file, expand all nodes, or collapse all nodes. Pausing the mouse over a matrix shows a ToolTip that displays the matrix in an easy-to-read 4x4 format.
The Texture Viewer allows the user to visualize mipmaps, cubemaps, and scroll through layers of 3D textures or texture arrays, as well as 2D texture arrays. Each texture in the current draw call is represented with a thumbnail button in the left pane. Similar to the Frame Scrubber, the user can hover the mouse over a thumbnail to provoke a ToolTip that gives more detail about the texture format.
By default, mipmapped textures are shown using a "mip atlas" view (Figure 12).
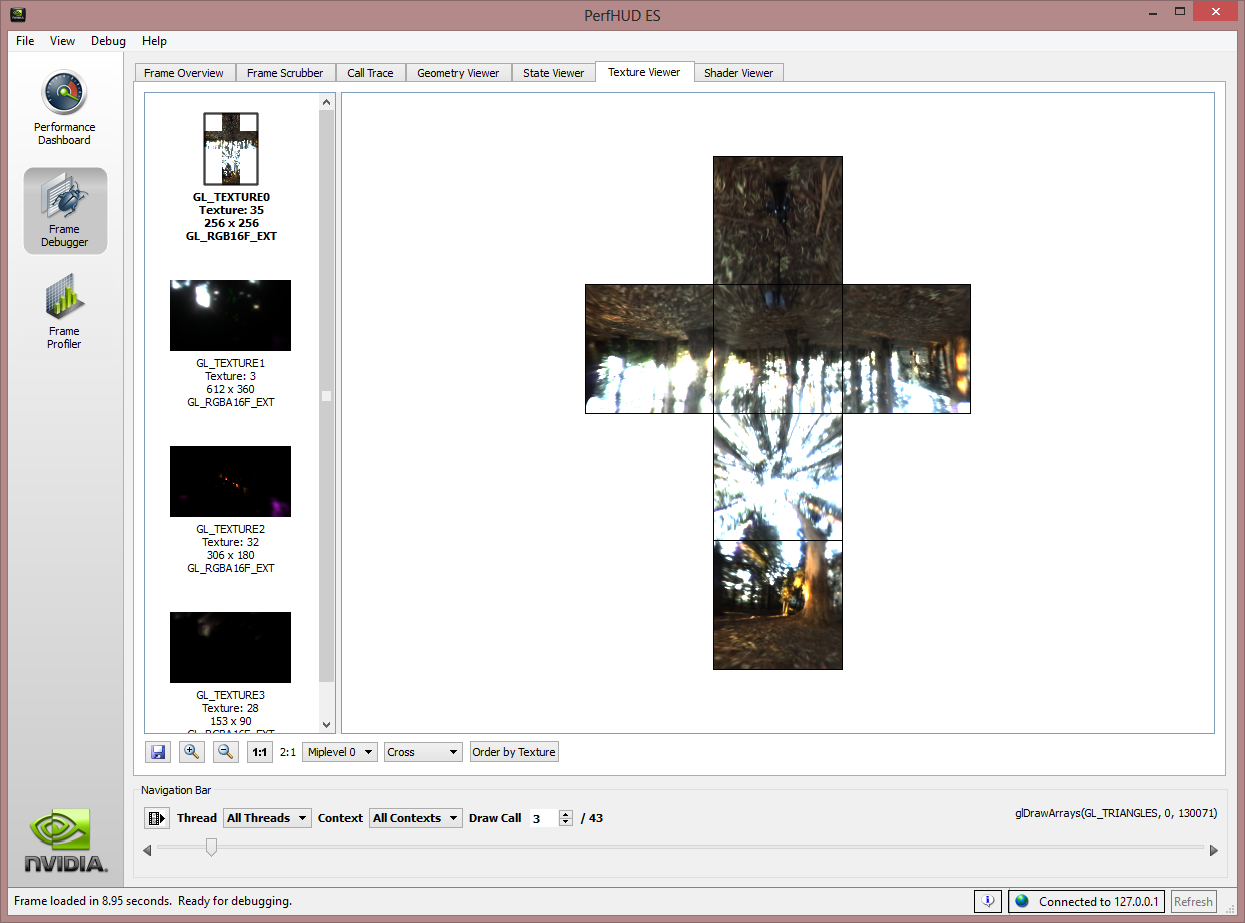
Figure 12. Texture Viewer screen.
Any of the miplevels can be clicked to zoom in on the miplevel. When examining texels within a particular miplevel, the mouse cursor becomes a crosshair and the status bar shows the color information and texture coordinates for the texel. Left-clicking anywhere in the image returns to the mip atlas. You can also select how you want to filter the results by selecting "Order by Texture" or "Order by Sampler."
Some of the smaller miplevels are not shown in the atlas, so PerfHUD also provides a drop-down box in the toolbar as an alternative to the atlas interface. This is also useful for cubemaps, which do not have an atlas view.
When viewing a cubemap, an additional drop-down box appears on the toolbar for the visualization mode. Individual faces can be examined, or the cubemap can be displayed in the standard cross format. When viewing the cross, the user may left-click any individual face to zoom in on the face and examine texels. Left-clicking again will return the view to the cross. By right clicking on the cubemap, the user can toggle to an outside 3D cube mode or an inside 3D cube mode which can spin around using trackball rotation.
Some target devices support 3D textures and/or texture arrays. These work similarly to 2D textures, but an additional slider appears for adjusting the Z level. The slider is also tied to a spin box which can be used to precisely select a particular level.
The Shader Viewer is available if the target device supports OpenGL ES 2.0 (Figure 13), and allows developers to review the shader code for the current draw call. Each program used by the target application is listed in the left pane of the Shader View. For each shader in a given program, the user can choose between viewing microcode or high-level source. Microcode is currently only available inside NVIDIA. The high-level source is normally retrieved from the target application if available. However, if the target application loads pre-compiled binary shaders,then high-level source can be viewed only if PerfHUD can find the source code within one of its search paths. Search paths can be configured via a dialog accessed from the Debug menu.
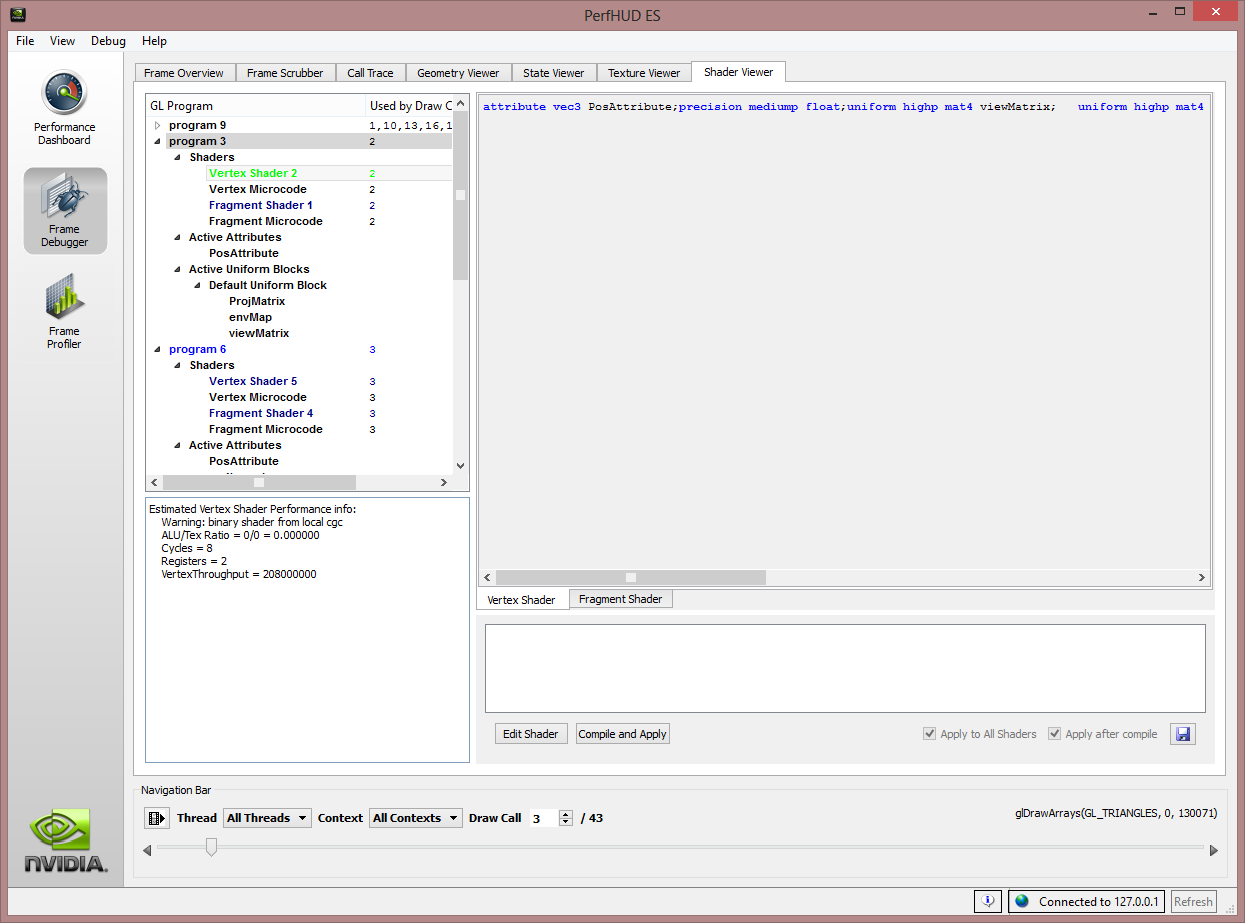
Figure 13. Shader Viewer screen.
High-level source may be either Cg or GLSL, both of which are shown with syntax highlighting. The color scheme can be configured by modifying an XML file. For more information on this, see the section on the Settings XML. Line number visibility and tab width can be adjusted via the Debug menu.
Active uniforms and attributes are listed with each program. Selecting an item in the list causes a detail pane to appear. Uniforms and attributes can also be selected by clicking the text within the code viewer. The mouse cursor changes from an I-beam to a hand when hovering over selectable text within the source view, similar to a link in a web browser.
The detail pane shows matrices in an easy-to-read tabular format. Vectors that have values within [0,1] are shown with a color swatch. Texture samplers are shown using thumbnails. Clicking a thumbnail activates the Texture Viewer tab and selects the appropriate texture stage.
Dynamic shader editing is available by selecting the Edit Shader button in the Shader Viewer. Selecting this button will create a "user" shader that can be modified, applied, and deleted at any time. After editing a user shader, you can view your changes by selecting the Compile and Apply button. This will compile the shader and copy it to target for visualization. Any compiler or activation errors will be displayed in the output pane. When you are done editing your shader, simply select the Delete User Shader button and the original shader will be re-activated in the target application.

NVIDIA® GameWorks™ Documentation Rev. 1.0.211026 ©2014-2021. NVIDIA Corporation and affiliates. All Rights Reserved.