Open topic with navigation
Frame Profiler
The Frame Profiler mode is one of PerfHUD’s most powerful features, and is not available on all target platforms. When the user clicks the Frame Profiler button, PerfHUD will pause the application and perform automated performance analysis of the current frame. Behind the scenes, PerfHUD is using the EGL_NV_perfmon extension, which allows it to access hardware-specific counters to determine unit utilization and bottleneck information for every draw call. PerfHUD may cause the application to re-draw the frame multiple times so that it can gather all the necessary statistics. After the analysis is complete, the user is presented with a highly detailed and interactive report.
Frame Coherency
To perform an experiment, PerfHUD causes the application to re-draw the same frame multiple times by overriding the value returned from the EGL_NV_system_time extension (Appendix A). The application must perform absolutely no animation when delta-time is zero, otherwise the results of the experiment may be invalid.
State Buckets
Fundamental to the Frame Profiler is the concept of a state bucket. State buckets are groups of draw calls that share portions of the render state.
State buckets are highly useful because a single optimization can apply to multiple draw calls. They can also serve as a guide to developers who wish to increase their batch sizes, or minimize their state changes.
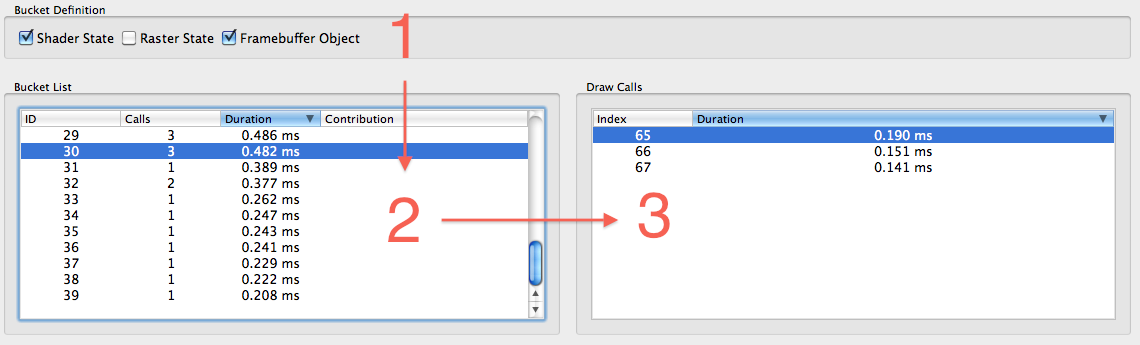
The user has control over the grouping heuristic that defines the state buckets. This is done using the three checkboxes in the Bucket Definition pane (Figure 7). The text shown below the checkboxes is dynamic and changes according to the selection.
Figure 7. State Bucket screen.
The arrows show the flow of control. Changing the bucket definition (pane 1) causes the bucket list to be repopulated (pane 2); selecting a row in the bucket list causes the draw call list to be repopulated (pane 3). These panes are also tied to the graph tabs shown in Figure 8.
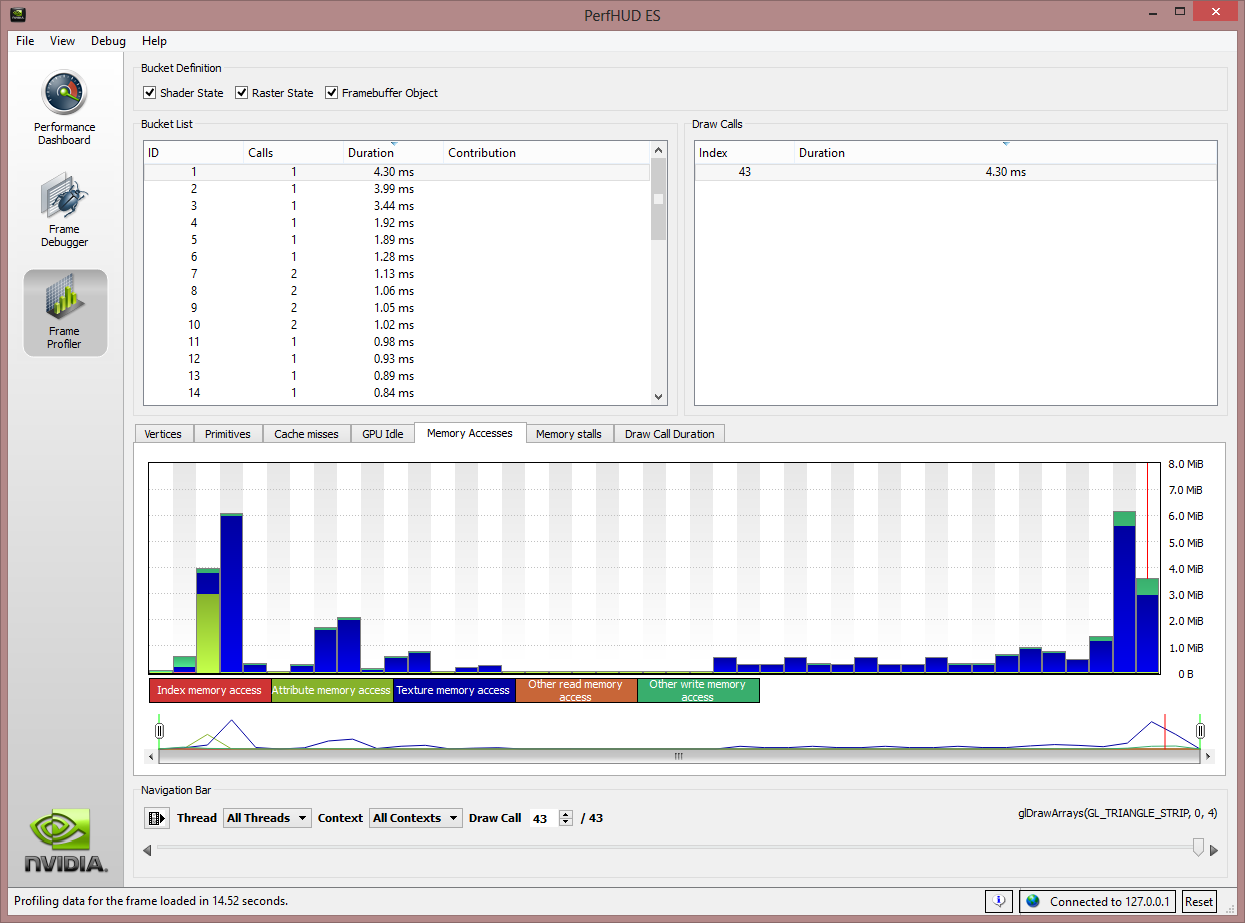
Figure 8. State Bucket screen with graph tabs.
Each graph tab shows one combination of hardware counter results. The counter names are listed in the legends below the graph. The Set Profile Graphs dialog can be used to configure the graph type and units of the counters. (See Set Profile Graphs for more information.)

NVIDIA® GameWorks™ Documentation Rev. 1.0.211026 ©2014-2021. NVIDIA Corporation and affiliates. All Rights Reserved.