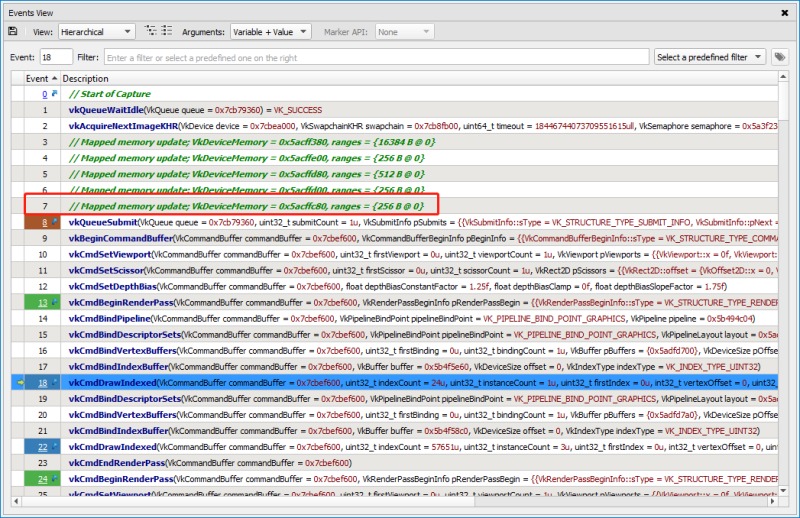
The Events view shows all API calls in a captured frame. It also displays both CPU and GPU activity, as a measurement of how much each call "cost."
You can select whether to view the events in a hierarchical or flat view. If multiple performance marker types are used, you can select the correct one, as well as varying levels of verbosity for the call display (variable + value, value, or none). You can also filter the results to locate a specific event by name and sort by columns by clicking on the column header.
When host memory has updates (i.e., mapped buffer, client side vertex data/index data, etc.), an additional message will be displayed in the Events View.
The Filter control can perform basic text matching to filter the events to something in which you might be interested; for example, all vkCmdDraw calls. You can also specify Regex matching in the combo box to the right, to do more interesting filtering — like vkCmdDraw|vkQueueSubmit — to determine how many draw calls executed for each queue submission.
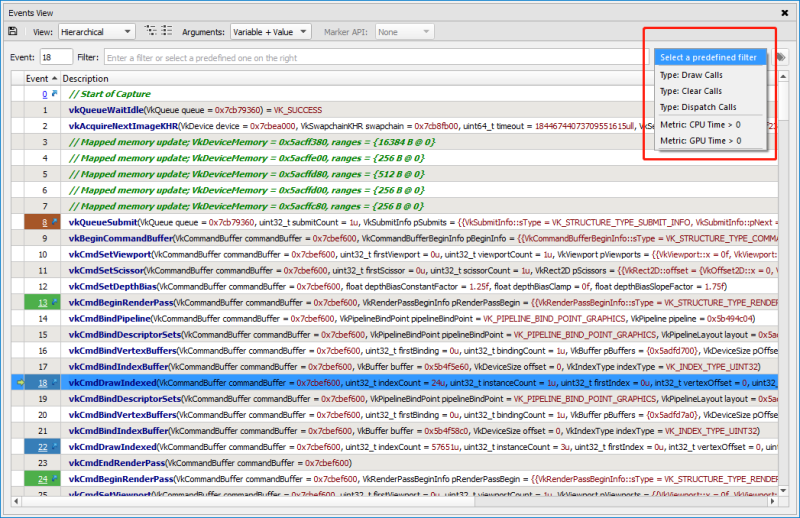
You can also select one of the predefined filters available in the drop-down menu.
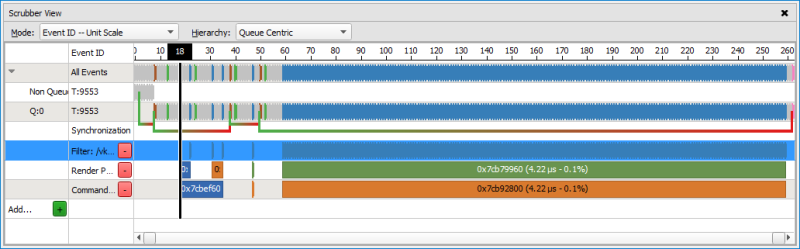
From the results, you can select the button next to the filter drop-down:
This will add a new row to the Scrubber that displays your filtered events.

NVIDIA® GameWorks™ Documentation Rev. 1.0.180426 ©2014-2018. NVIDIA Corporation. All Rights Reserved.