The Frame Debugger allows you to inspect render targets and textures, navigate through draw events, inspect pipeline states, and perform in-depth profiling of the scene, to determine where bottlenecks are.
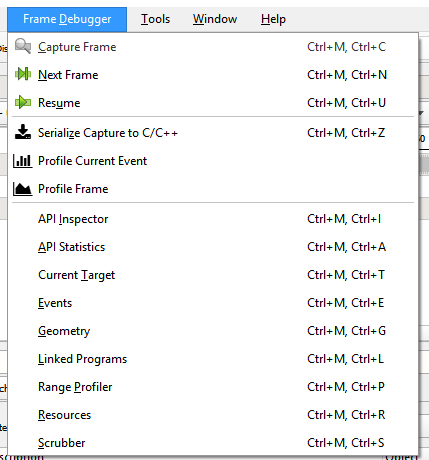
In order to start the Frame Debugger, you need to capture the frame of interest by pressing Capture Frame on the toolbar.
Once captured, the Frame Debugger allows you to scrub through the frame, draw call by draw call, to get a sense of how the scene is constructed.
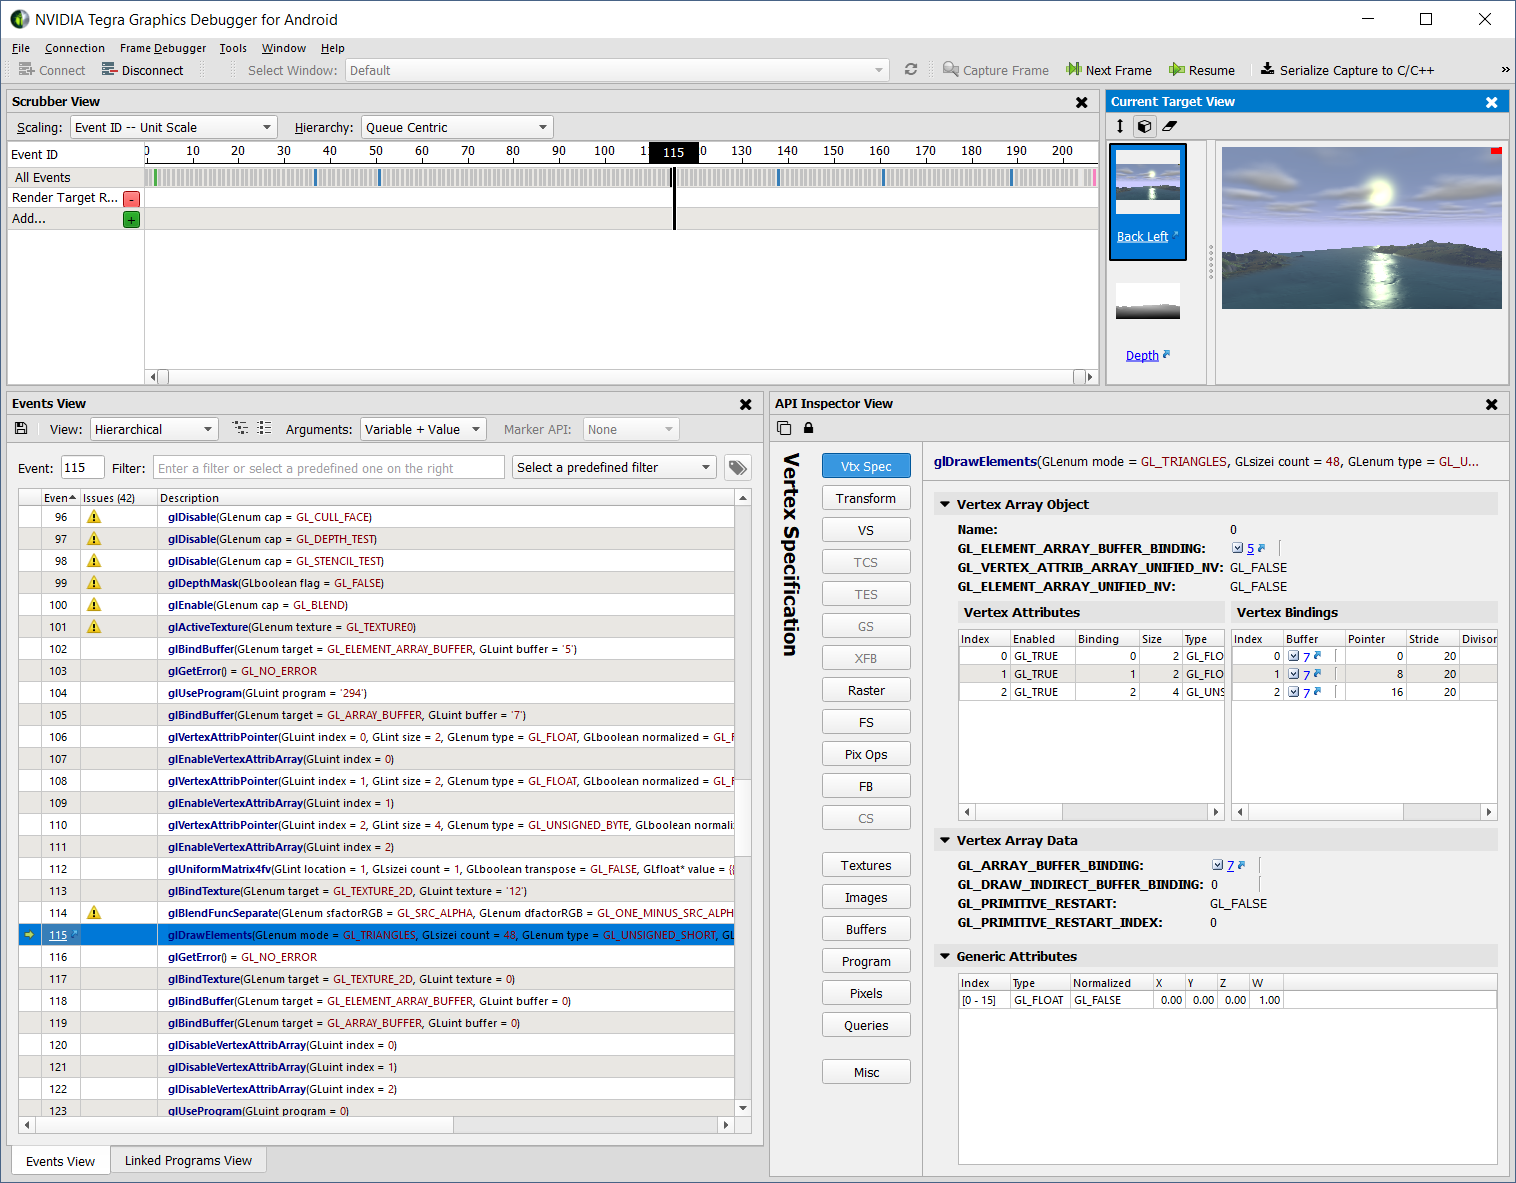
The Frame Debugger has multiple dock-able and re-sizable windows to view the frame details and any profiling results that you want to see.
These views will be discussed more in the following section.
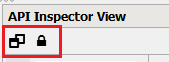
There are two buttons that are common across several frame debugger views.

NVIDIA® GameWorks™ Documentation Rev. 1.0.180426 ©2014-2018. NVIDIA Corporation. All Rights Reserved.