Open topic with navigation
Using the Debugger: Linux Target Device
This guide will give you a walkthrough of using Tegra Graphics Debugger for the first time.
Host Setup
If you are setting up Tegra Graphics Debugger as a standalone application, you can install it with the following command:
$ sudo ./NVIDIA_Tegra_Graphics_Debugger_<version>.run
By default, it is installed in /usr/local/Tegra-Graphics-Debugger-<version>/. Start it with:
$ /usr/local/Tegra-Graphics-Debugger-<version>/nvidia-gfx-debugger

|
NOTE: In order to launch applications from the UI, Tegra Graphics Debugger connects from the host to your target using SSH. If you want to launch from the UI instead of launching the app from a shell on the target device, you will need to configure your target to allow SSH root login. To do so, edit the file /etc/ssh/sshd_config on your target and replace:
PermitRootLogin without-password
with:
PermitRootLogin yes
Then restart the SSH service:
# service ssh restart
And set the root password with a password of your choice (default one is nvidia):
# passwd
|
Target Setup
Tegra Graphics Debugger uses SSH to launch processes. If you do not want to use SSH, configure your app with the following and then see the Attaching to Application section.
On your target, execute the application you want to profile. For example, the “bubble” sample application:
# export DISPLAY=:0.0
# cd vibrante-t210ref-linux/samples/opengles2/bubble/x11/
# LD_PRELOAD=~/.tgd/libs/libNvidia_gfx_debugger.so ./bubble

|
Note: You need to launch your applications with the LD_PRELOAD variable set as shown in the above command. |
Launching Applications with Tegra Graphics Debugger
- When you launch Tegra Graphics Debugger from a terminal, the first prompt is where you add the connection information for your target. Enter the IP or hostname of the target, select the port number to use, and the username and password.
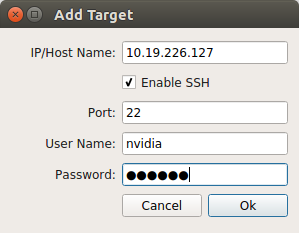
If you use the root account, make sure your target is configured to accept SSH connection as root.
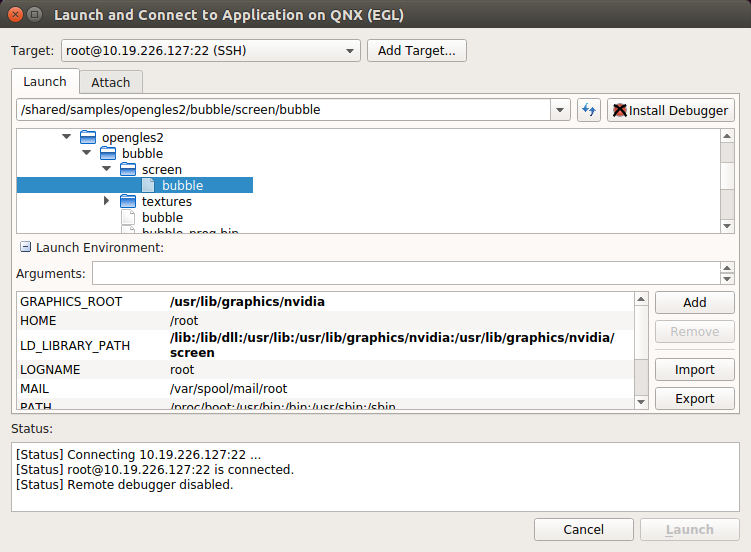
- The Launch and Connect to Application dialog will appear and default to your connected device.
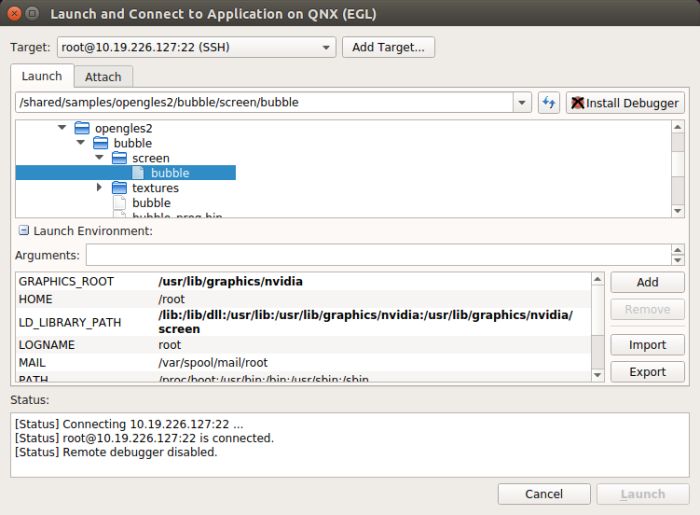
- The Tegra Graphics Debugger GUI supports launching applications on the target device with the required debugger libraries automatically injected into the application. This requires pushing the debugger
.so file to the target system. Once you select your target device, the button in the upper right corner will show the current status of the interposer.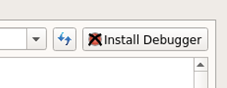
If the button has an X, the interposer is not on the target device. Click the button to push the interposer to the target device.
- In the middle of the Launch and Connect to Application dialog, you can select the drop-down next to Launch Environment to set any specific environment variables needed for your application.
Existing environment variables may be edited by double-clicking their value.
- Choose the application you are interested in debugging from the list of applications, and press the Launch button in the lower right hand corner of the dialog. Once the application has started you should see the main screen transition to the Performance Dashboard.
Once the application has started you should see the main screen transition to the Performance Dashboard.
Attaching to Applications with Tegra Graphics Debugger
- If you are not using SSH, or if launching the application doesn't work, follow the steps to configure your target application to disable SSH, uncheck the Enable SSH box, enter the IP/host name of the target, and click OK.
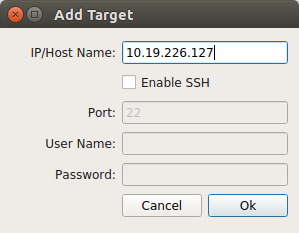
| Note: If you want to re-enable SSH, check the Enable SSH box, and enter the username and password to connect to the target device. |
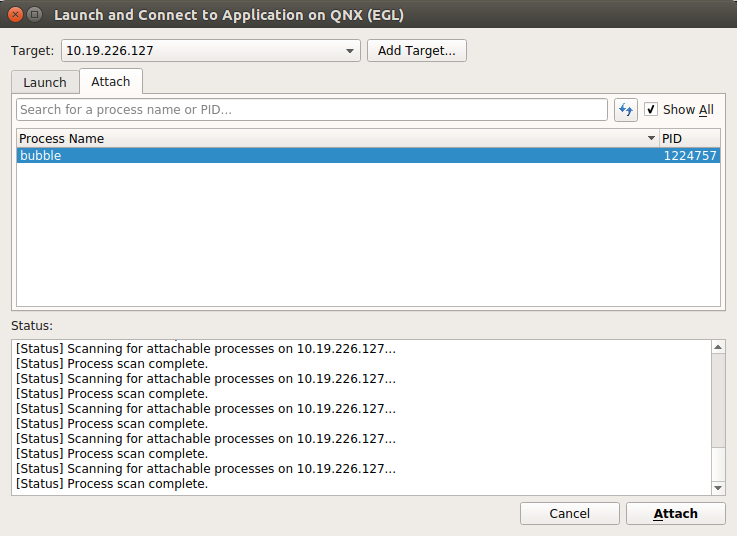
- If you previously launched your application and disconnected the debugger, then want to reattach to debug other issues, select the Attach tab on the Launch and Connect to Application dialog, and click the refresh button just above the Process Name list to see the application of interest.
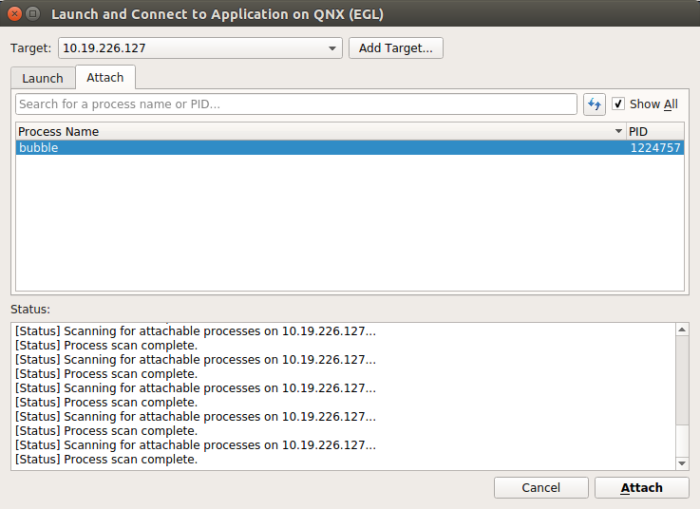
- Applications that were previously launched for Frame Debugging will appear in the list.
- You can choose Show All if you want to view all applications that are running on the target machine; applications that cannot be debugged will appear with their names grayed out.
- To quickly locate a specific application by name, you can type the first few letters of its name, or its process ID in the Search field, and only matching applications will appear in the list.
- Select the application and click Attach in the lower right corner to start using Tegra Graphics Debugger.

NVIDIA® GameWorks™ Documentation Rev. 1.0.180426 ©2014-2018. NVIDIA Corporation. All Rights Reserved.