Open topic with navigation
Using the Debugger: Android Target Device
Tegra Graphics Debugger Installation
You can install Tegra Graphics Debugger as part of the NVIDIA CodeWorks for Android package (see Downloading and Installing CodeWorks for Android), or install as a standalone application.
On Windows
Run the .msi file and follow the prompts to install.
On Mac
Load the DMG, and copy the app to your applications folder.
On Linux
Run the .run file.
Most Android devices, such as the SHIELD tablet, will work with Tegra Graphics Debugger out of the box, and don't need to be pre-configured.
Launching Applications with Tegra Graphics Debugger:
- Start the Tegra Graphics Debugger Host from the Start menu.
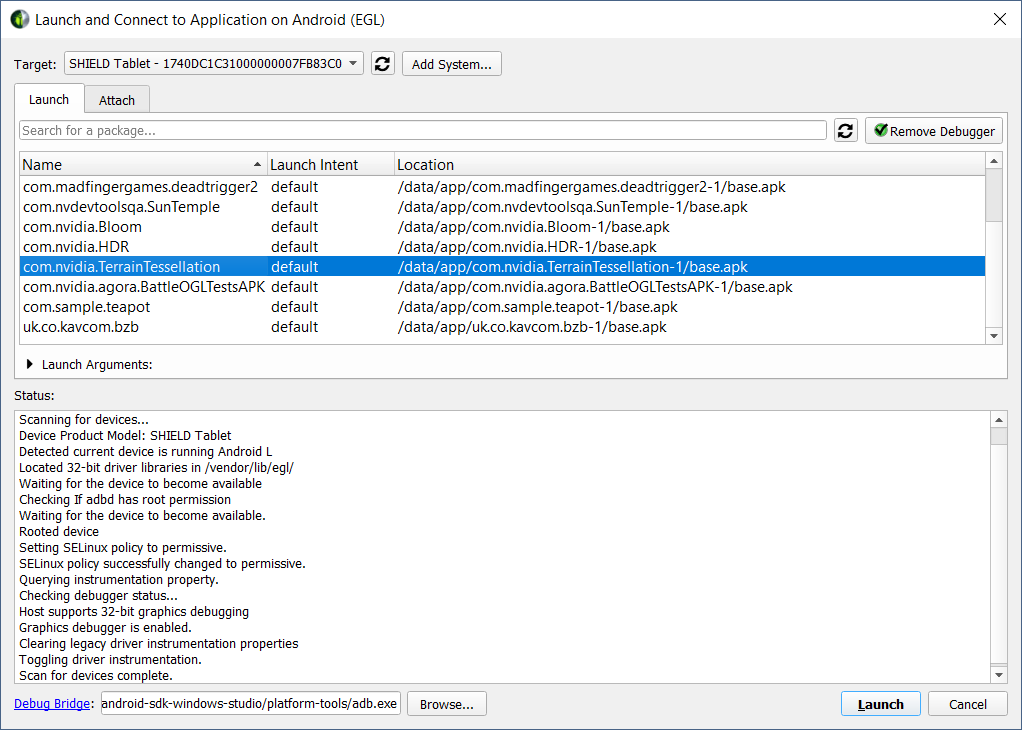
- The Launch and Connect to Application dialog will appear and default to your connected device.
If you have multiple devices connected, you can choose the drop-down menu next to Target and select the device you want to use.
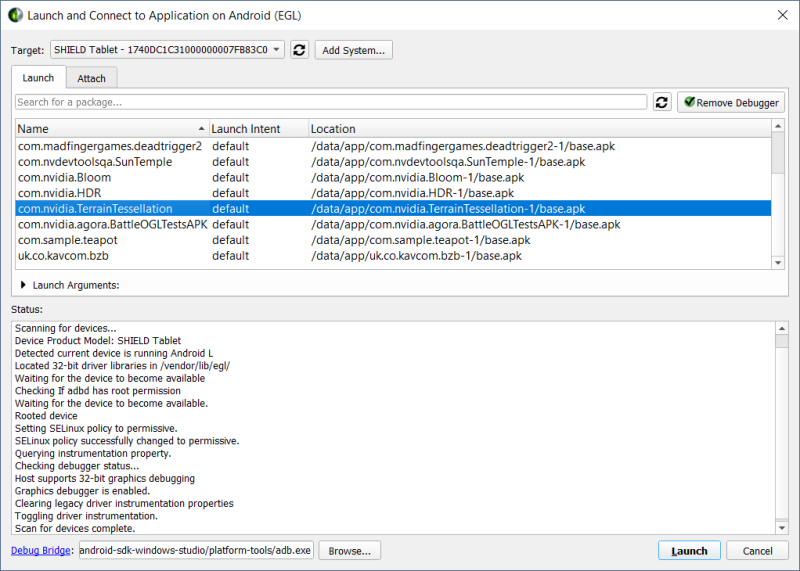
- The Tegra Graphics Debugger GUI supports launching applications on the target device with the required debugger libraries automatically injected into the application. This requires pushing the debugger
.so file to the target system. Once you select your target device, the button in the upper right corner will show the current status of the interposer.
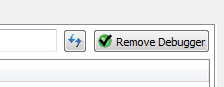
If the button has an X, the interposer is not on the target device. Click the button to push the interposer to the target device.
- In the middle of the Launch and Connect to Application dialog, you can select the drop-down next to Launch Arguments to specify any additional arguments needed for your application. The currently supported arguments include the following:
—e, —es, —ez, —ei, —el, —ef, —eu, —ecn, —eia, —ela, —efa, —esn
- Choose the APK you are interested in debugging from the list of applications, and press the Launch APK button in the lower right hand corner of the dialog. Once the application has started you should see the main screen transition to the Performance Dashboard.
Attaching to Applications with Tegra Graphics Debugger
- If you previously launched your application and disconnected the debugger, then want to reattach to debug other issues, select the Attach tab on the Launch and Connect to Application dialog, and click the refresh button just above the Process Name list to see the application of interest.
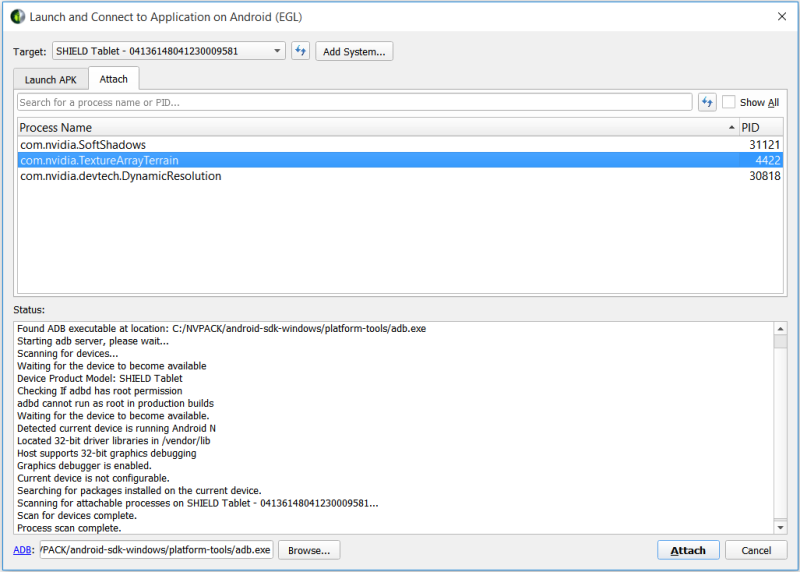
- Applications that were previously launched for Frame Debugging will appear in the list.
- You can choose Show All if you want to view all applications that are running on the target machine; applications that cannot be debugged will appear with their names grayed out.
- To quickly locate a specific application by name, you can type the first few letters of its name, or its process ID in the Search field, and only matching applications will appear in the list.
- Select the application and click Attach in the lower right corner to start using Tegra Graphics Debugger.

NVIDIA® GameWorks™ Documentation Rev. 1.0.180104 ©2014-2018. NVIDIA Corporation. All Rights Reserved.