OpenGL and OpenGL ES APIs can be traced to assist in the analysis of CPU and GPU interactions.
A few usage examples are:
Visualize how long eglSwapBuffers (or similar) is taking.
API trace can easily show correlations between thread state and graphics drivers behavior, uncovering where the CPU may be waiting on the GPU.
Spot bubbles of opportunity on the GPU, where more GPU workload could be created.
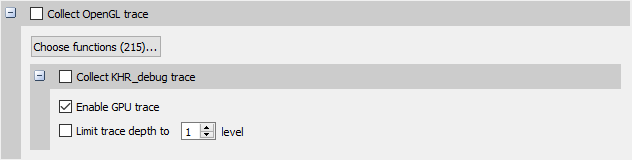
Use KHR_debug extension to trace GL events on both the CPU and GPU.
OpenGL trace feature in Tegra System Profiler consists of two different activities:
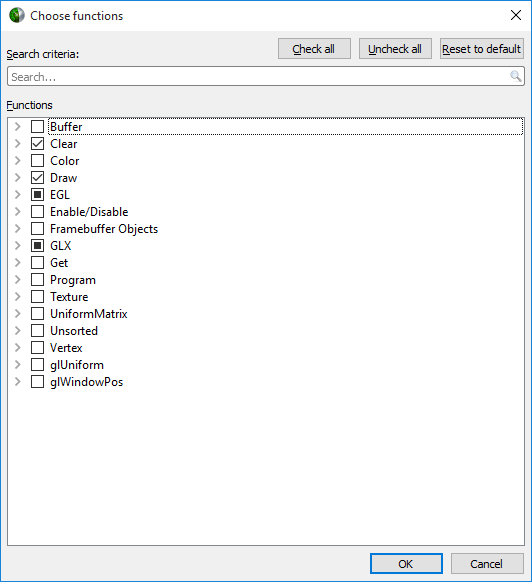
CPU trace: interception of API calls that an application does to APIs (such as OpenGL, OpenGL ES, EGL, GLX, etc.).
GPU trace (or workload trace): trace of GPU workload (activity) triggered by use of OpenGL or OpenGL ES.
To collect GPU trace, the glQueryCounter() function is used to measure how much
time batches of GPU workload take to complete.

NVIDIA® GameWorks™ Documentation Rev. 1.0.180104 ©2014-2018. NVIDIA Corporation. All Rights Reserved.