Optimization Sample
Category: Performance
Min PC GPU: Fermi-based (GTX 4xx)
Min Tegra Device: Tegra 4
Description
The Optimization Sample demonstrates several generic performance-improving rendering techniques. These include down-sampled rendering and depth pre-passes. The sample also demonstrates the use of app-level GPU and CPU timers, which allow apps to create focused timings of actual GPU work. This is extremely important, since it is otherwise difficult to actually determine parallel CPU and GPU timings.
APIs Used
- GL_EXT_framebuffer_blit/GL_NV_framebuffer_blit
- GL_ARB_timer_query/GL_NV_timer_query
Shared User Interface
The OpenGL samples all share a common app framework and certain user interface elements, centered around the "Tweakbar" panel on the left side of the screen, which lets you interactively control certain variables in each sample.
To show and hide the Tweakbar, simply click or touch the triangular button positioned in the top-left of the view.
Other controls are listed below:
Technical Details
Introduction
This sample demonstrates a few basic methods that can be used to optimize fill-bound applications, as well as methods of timing the impact. Of the two, the real key here is the use of asynchronous, query-based GL counters to time GPU activity. The timings are printed to the screen live as the application runs. The UI can be used to enable and disable features and track the performance impacts to each stage.
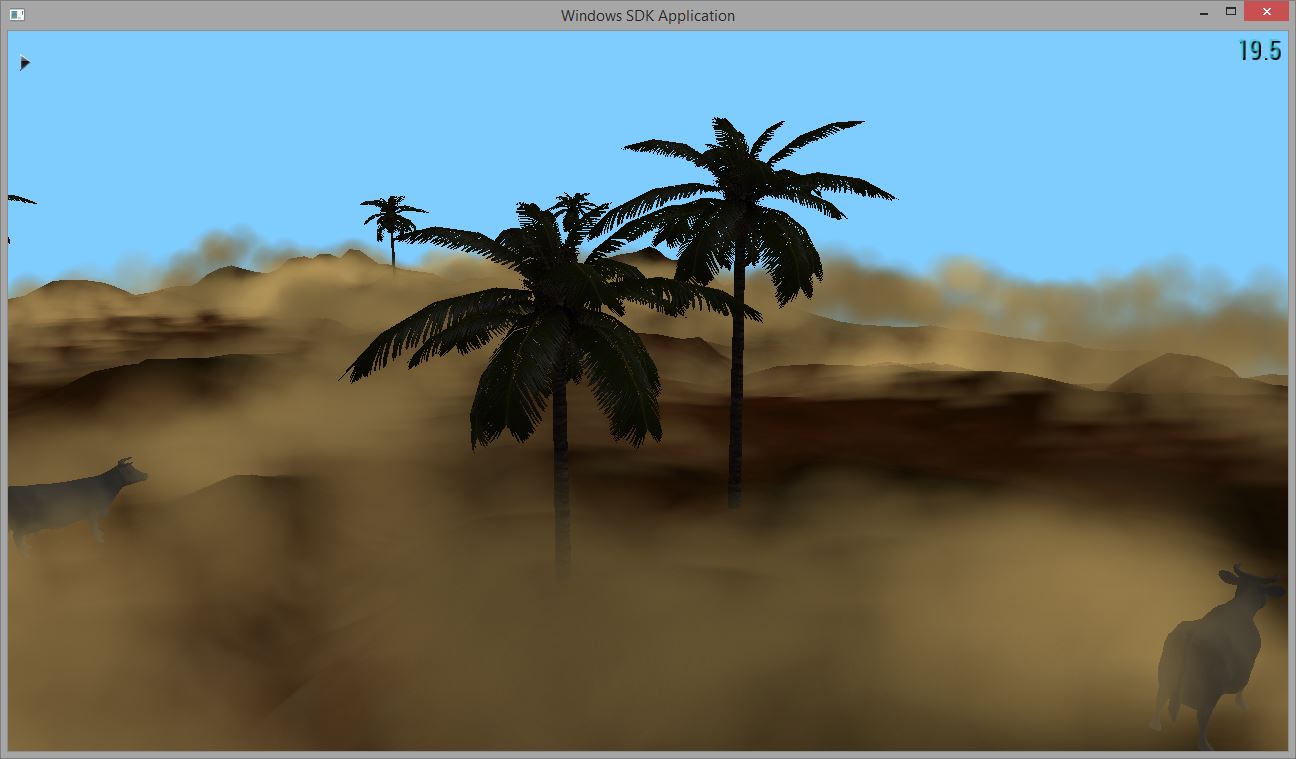
The Scene
The rendered scene in this application includes a basic terrain, individual rigid objects, and animated particles. The particles can be rendered to an independent (downsized with regard to the scene buffer) FBO and then composited with the main scene. The scene itself can also be rendered to a downsized buffer (note that the particles are downsized relative to the scene buffer, so downsizing the scene buffer downsizes the particle buffer). The UI allows these to be changed independently. Thus, there are four total modes: Scene and Particles at window resolution, particles downsized 2x, scene and particles downsized 2x, and finally the scene and particles downsized 2x and 4x, respectively. The effect of changing these modes can be seen by watching the on-screen timers.
In addition, the UI allows a depth pre-pass to be enabled at runtime. The effect of enabling and disabling this pass can be seen by watching the on-screen timers.
CPU and GPU Timing
At the application level, CPU timings can be collected quite trivially, as shown in the CPU timers in this sample. They use a simple C++ "scope" object to auto-time blocks of code. However, OpenGL is explicitly an asynchronous API. In fact, performance tends to be quite poor when applications are coded in such a way that OpenGL becomes a synchronous API. Thus, timing the GPU work accurately can be difficult. NVIDIA provides extensions that allow GL to start a timer in the GL stream of commands, stop the timer in the stream of commands, and then (later) query the time between those two calls in the GPU. Note that the timer is started and stopped asynchronously; it starts and stops when the start and stop commands are processed on the GPU. Depending on how heavily the GPU's pipeline is backed up, the timer may start significantly later than the query is launched by the GL query call.
There are five timers each for CPU and GPU, and each timer covers the same selection of GL calls. The CPU timers cover the time taken in wall-clock time between the start of the first call in the block, and the return of the last call in the block. The GPU timers cover the time taken to process GL work generated by calls within the block. The timers cover the cost of a depth pre-pass, the time spent rendering the main scene, the time rendering the particles, and the time spent up-sampling the scene and/or particles, if they are rendered to a low-resolution buffer. All of these values are normalized by the total CPU and GPU time, and presented as percentages of total.