NVTX data appears in several different areas of the NVIDIA Nsight Analysis Report, including in the Summary Report, Detailed Reports, and Timeline.
NVTX API calls are only supported by the NVIDIA Nsight Analysis Tools (Nsight Menu > Start Performance Analysis).
To configure a Trace activity to capture NVTX data:
To capture NVTX data:
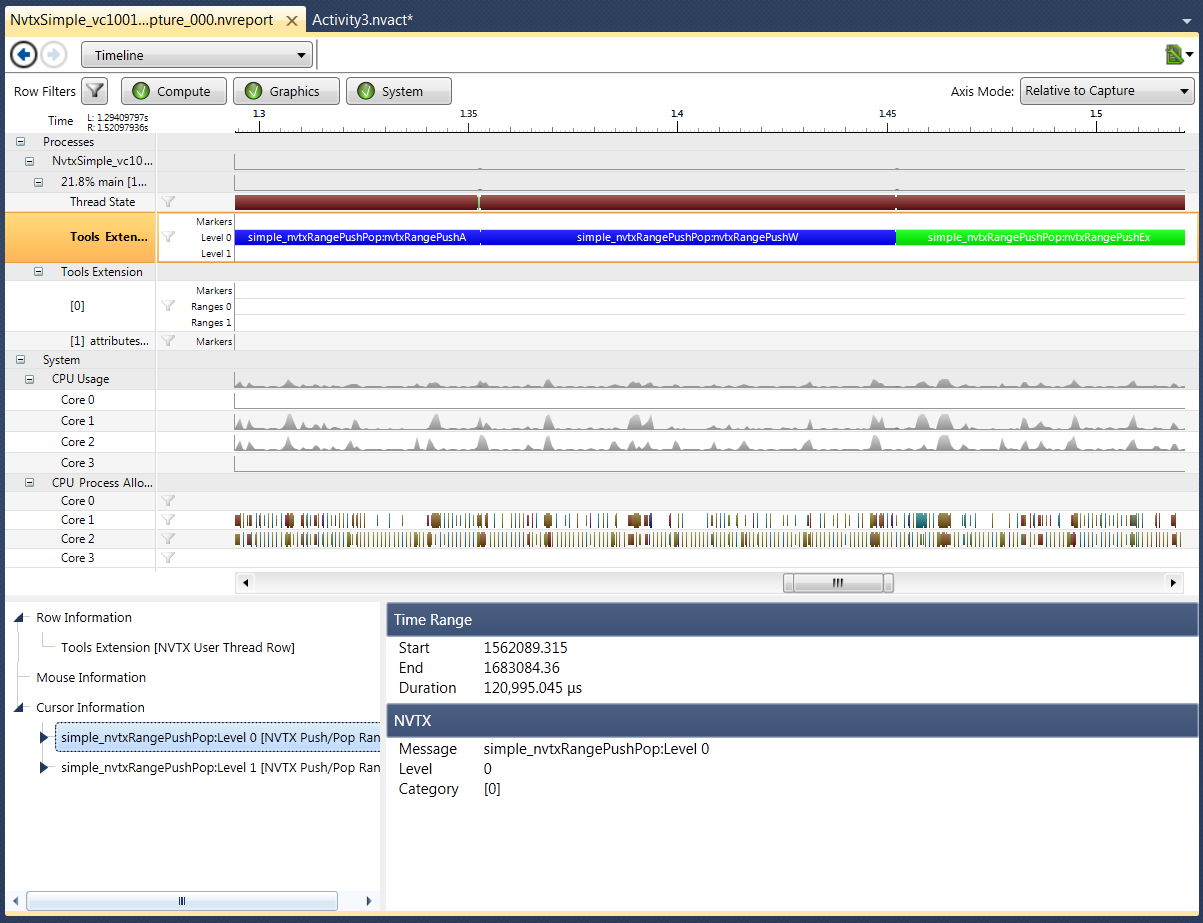
The NVTX markers and ranges are displayed in two different areas of the row hierarchy. This allows the thread to be presented:
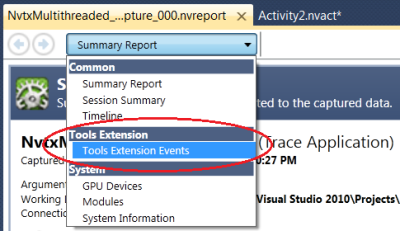
Besides the Timeline Report, you can also select the Tools Extension Events report to view the data from a different angle.
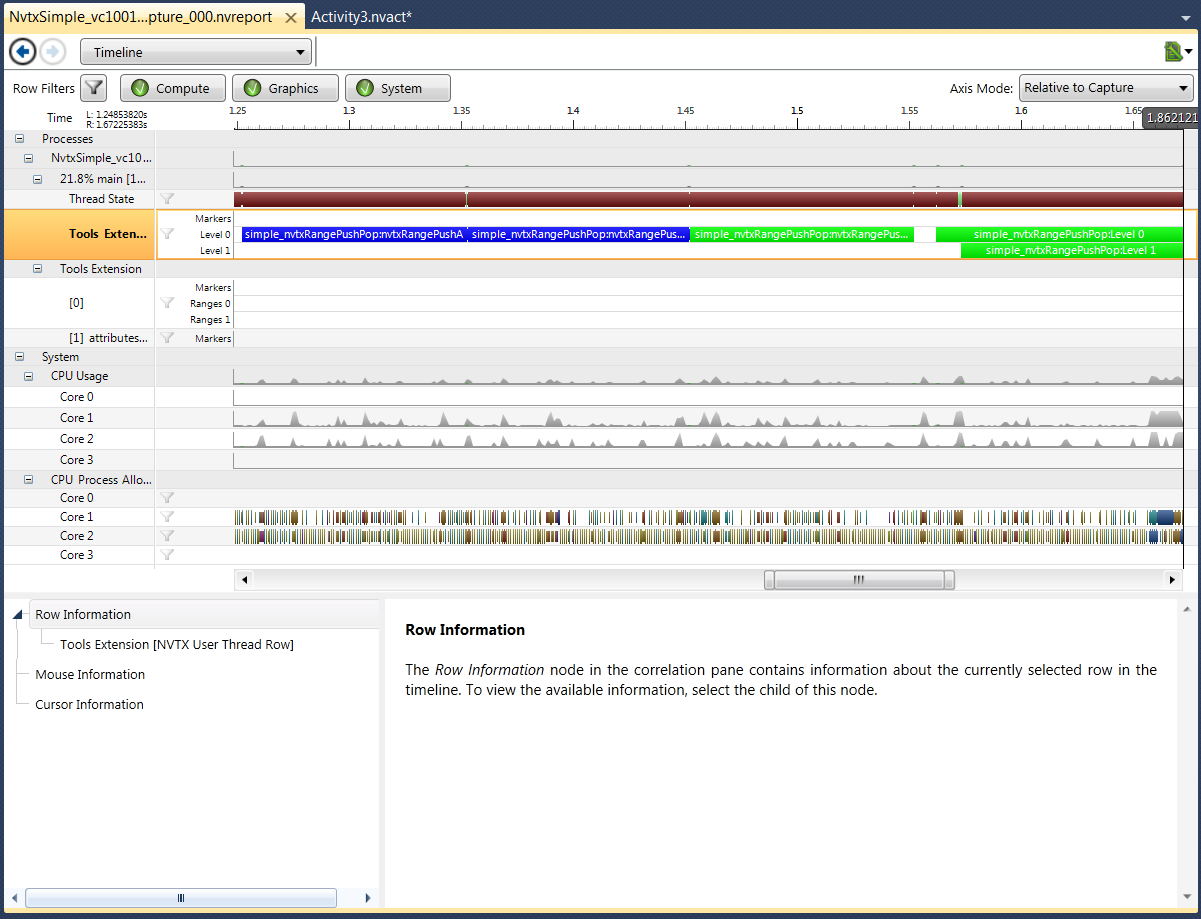
The per-thread data is located in the rows at \Processes\<Process>\<Thread>\Tools Extension.
The parent row includes all nvtxMark events specified on the thread. The child row, "Push/Pop Ranges," contains a nvtxRange{Push, Pop} stack for the thread. The nvtxRange{Start, End} events are not displayed per-thread, as the start and end events can occur on different threads.
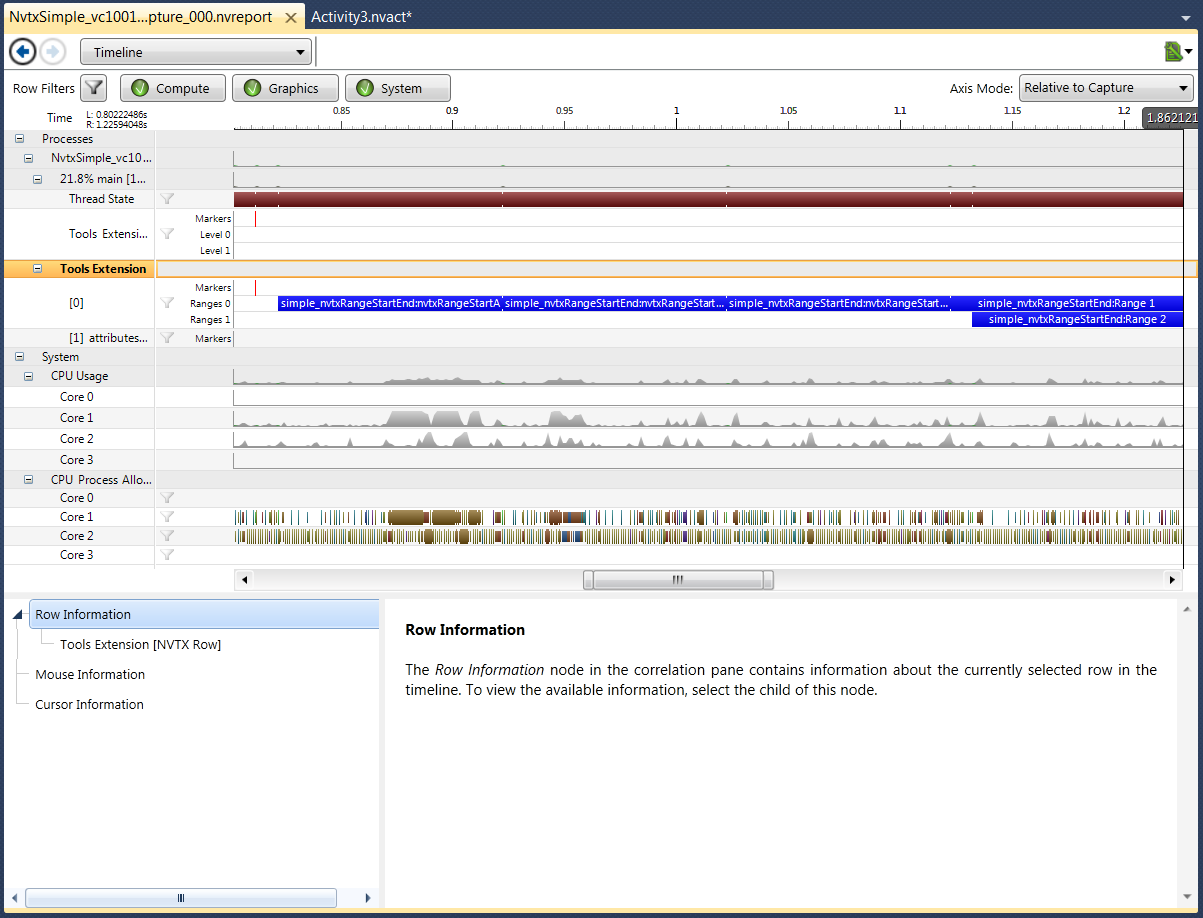
The per-category events are displayed as children rows of the \Processes\<Process>\Tools Extension row.
The per-category rows \Processes\<Process>\Tools Extension\<Category> contain the nvtxMark and nvtxRange{Start, End} events associated with the category. For more information on how to associate an event with a category, and how to name a category, see the "NVTX Event Attributes" section of NVTX Library. Each category row consists of multiple stacked range graphs. The timeline view will attempt to show the minimal number of Range rows. The ranges are not displayed as a stack.
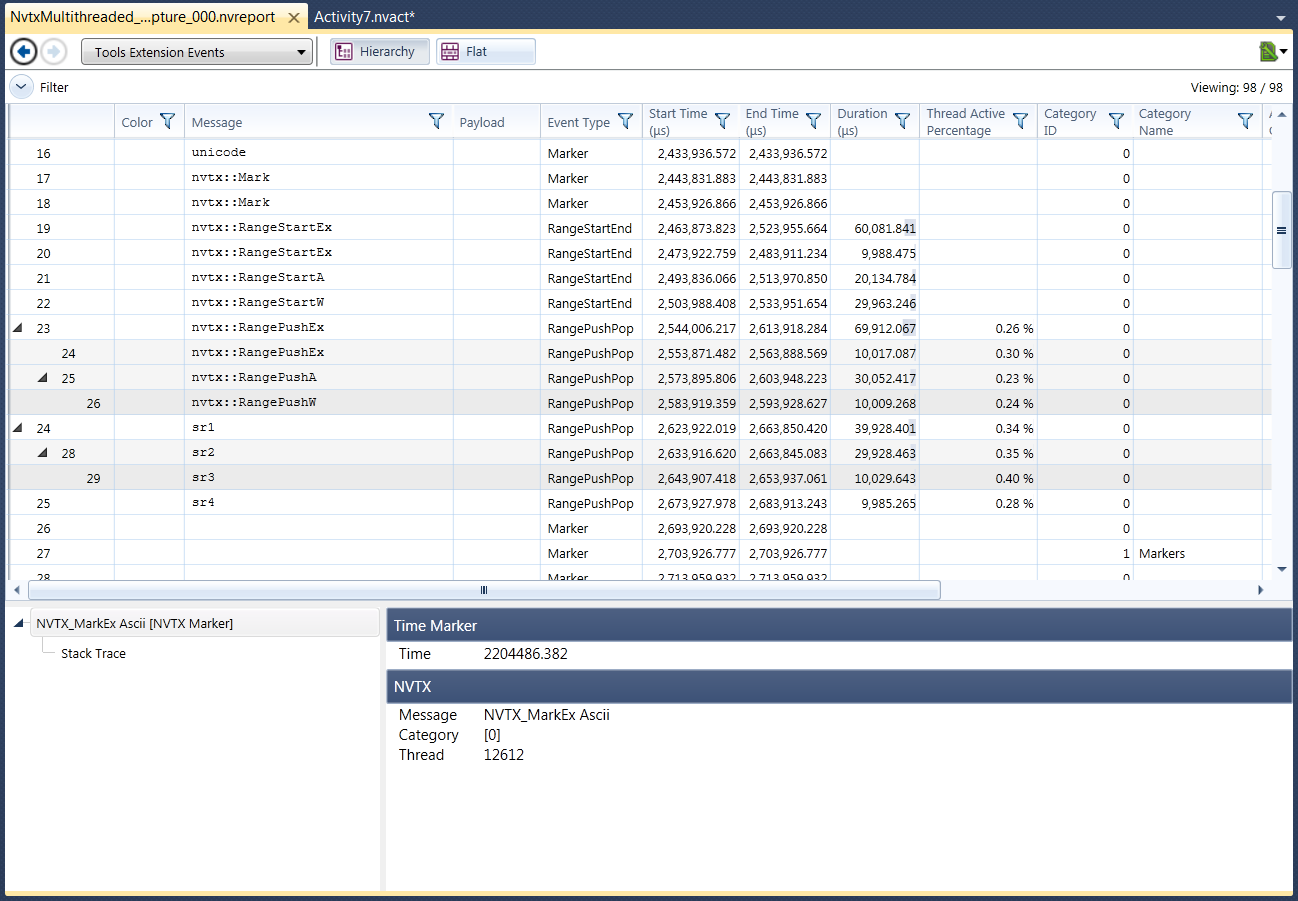
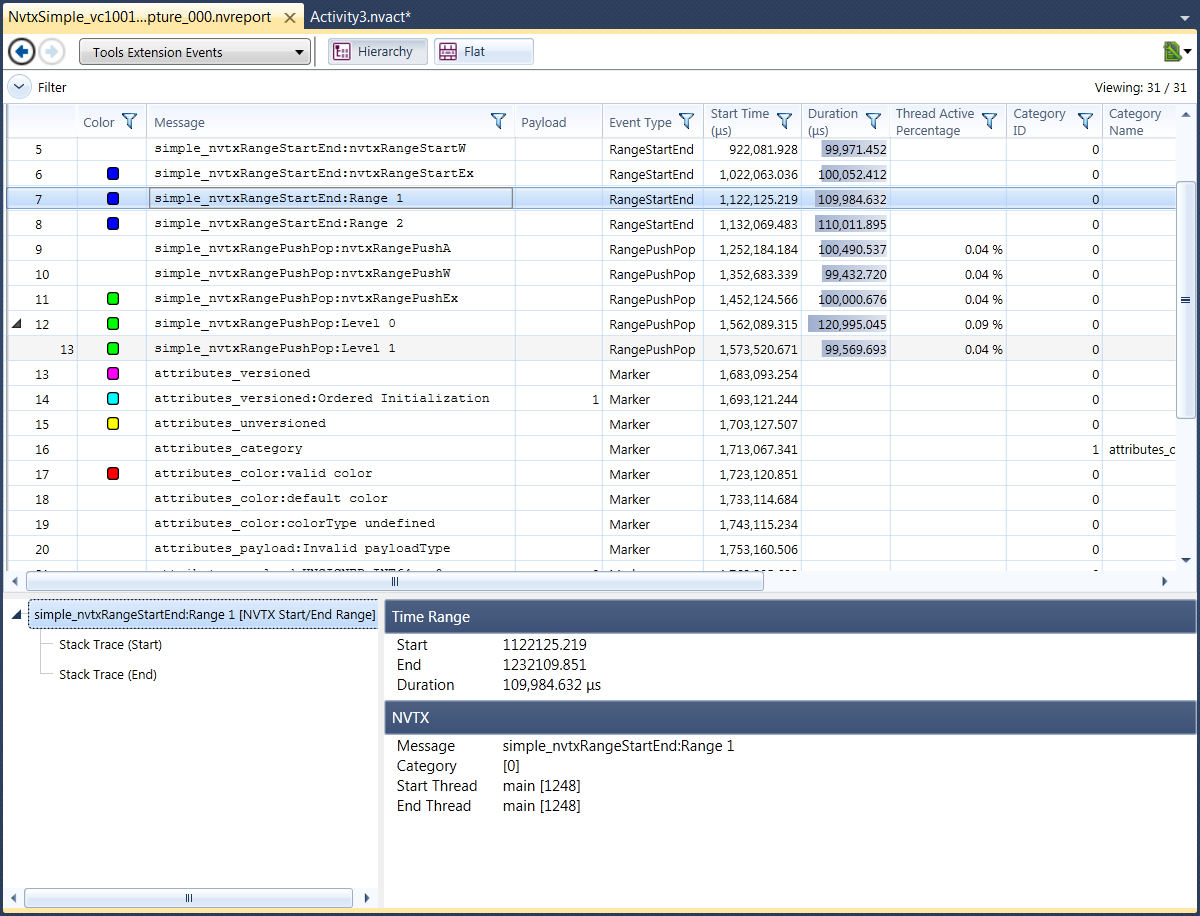
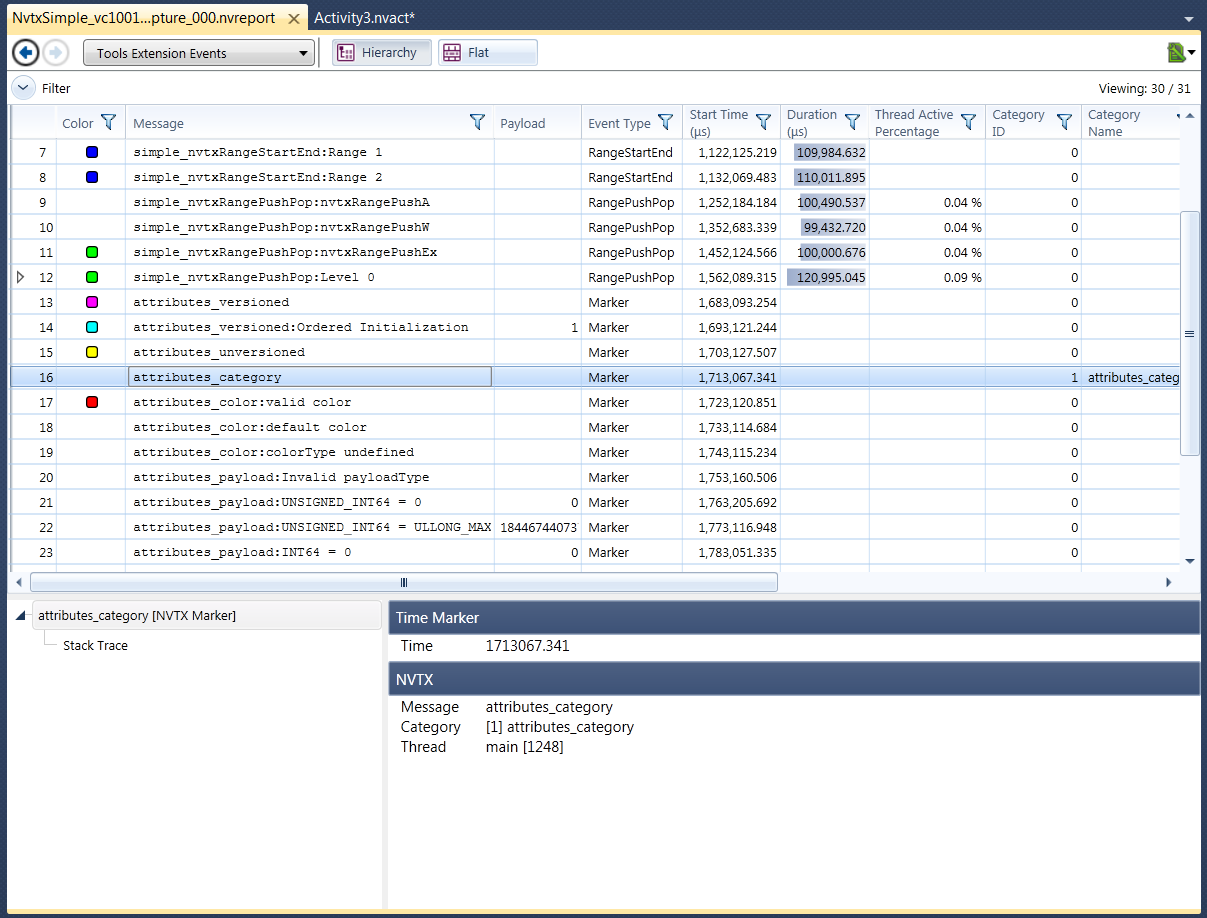
The Tools Extension Events Page provides a table view of the events. This table contains every NVTX event that was sent during the capture period. The user can use sorting and filtering to analyze the data.
The data is displayed in the 'Tools Extension Events' report table as illustrated below.
The marker data is also displayed in the Timeline Report.
The data is displayed in the report tables in a hierarchical way, resembling the nesting structure of the push/pop API calls. Each range is shown as a single row entry. Parent Push/Pop ranges fully enclose their child ranges.
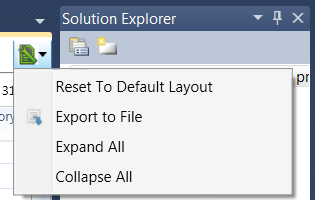
To allow the user to easily view the hierarchy of events, a color gradient illustrates how far down on the hierarchy a node is located. The report page options allow the user to quickly expand or collapse all nodes in the hierarchy.
There are also a few keyboard shortcuts to quickly navigate through the hierarchy. These include the following:
Cursor + right-arrow Expands the currently selected row by one level (for a newly-opened report), or to its previous state (if the child rows below the selected row were previously expanded). Cursor + left-arrow Collapses the currently selected row (if it has any expanded child rows). * Expands the currently selected row as well as all child rows. / Collapses the entire sub-tree under the selected row.

|
Note: The collapse/expand state per node is not persisted right now. That is, if you navigate away from the page and come back, the hierarchy starts out as completely collapsed. This will be addressed in a future version of NVIDIA Nsight. |
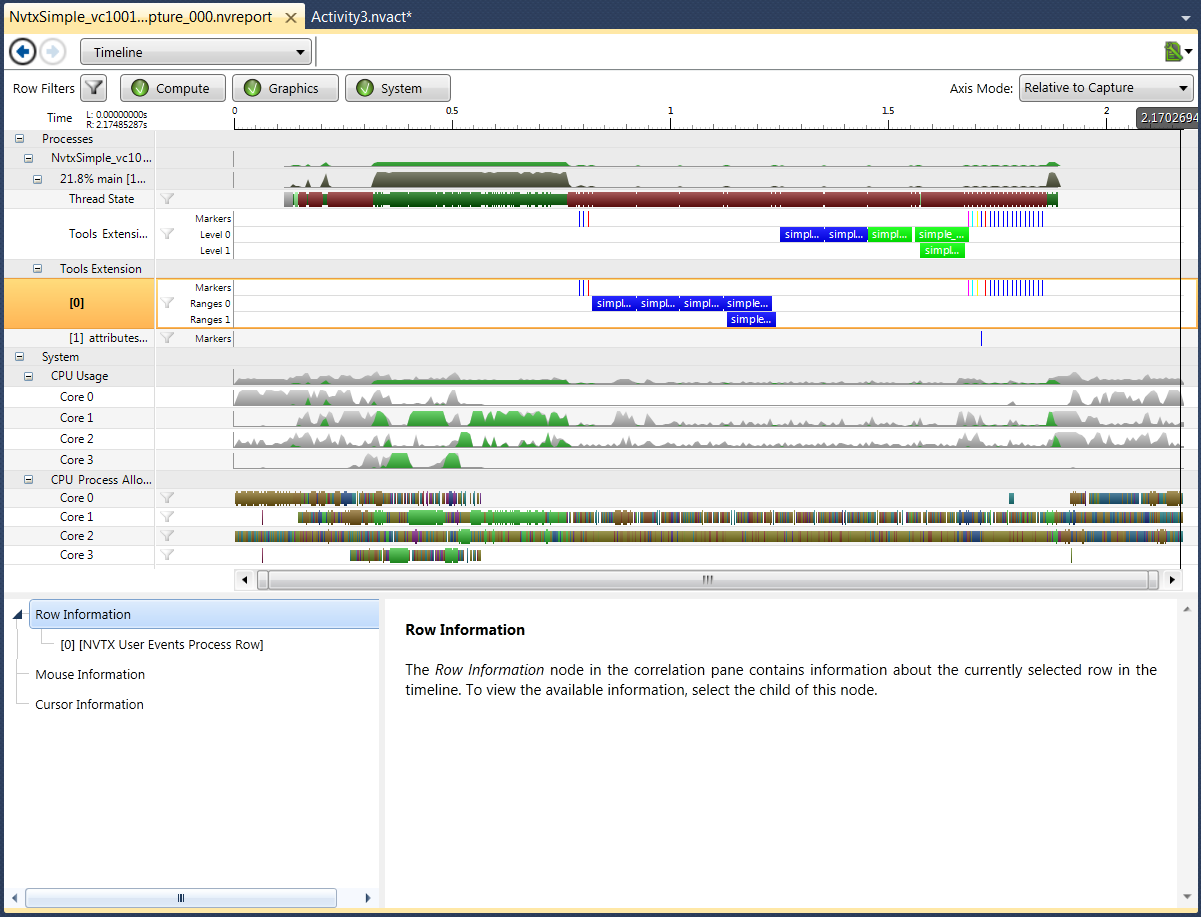
The ranges also appear on the Timeline as a child row of the corresponding thread.
Start/End ranges are displayed in the report table pages as shown below. Each row represents an individual range.
Start/End ranges can also be visualized on a per-process basis on the timeline. The start/end ranges are grouped by category as well. The split hierarchy for the NVTX rows is due to the nature of the events itself, i.e. push/pop ranges are tracked per-thread, while start/end ranges are per-process.
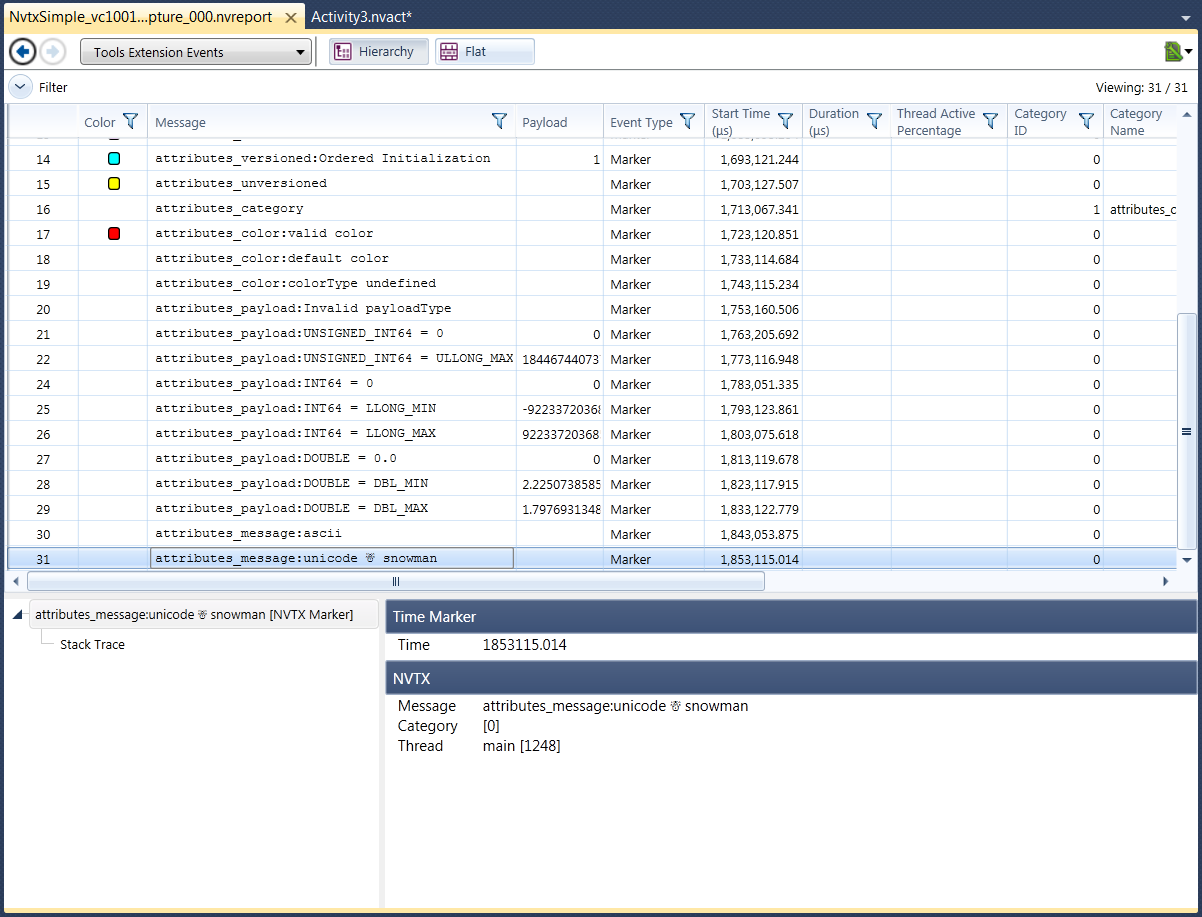
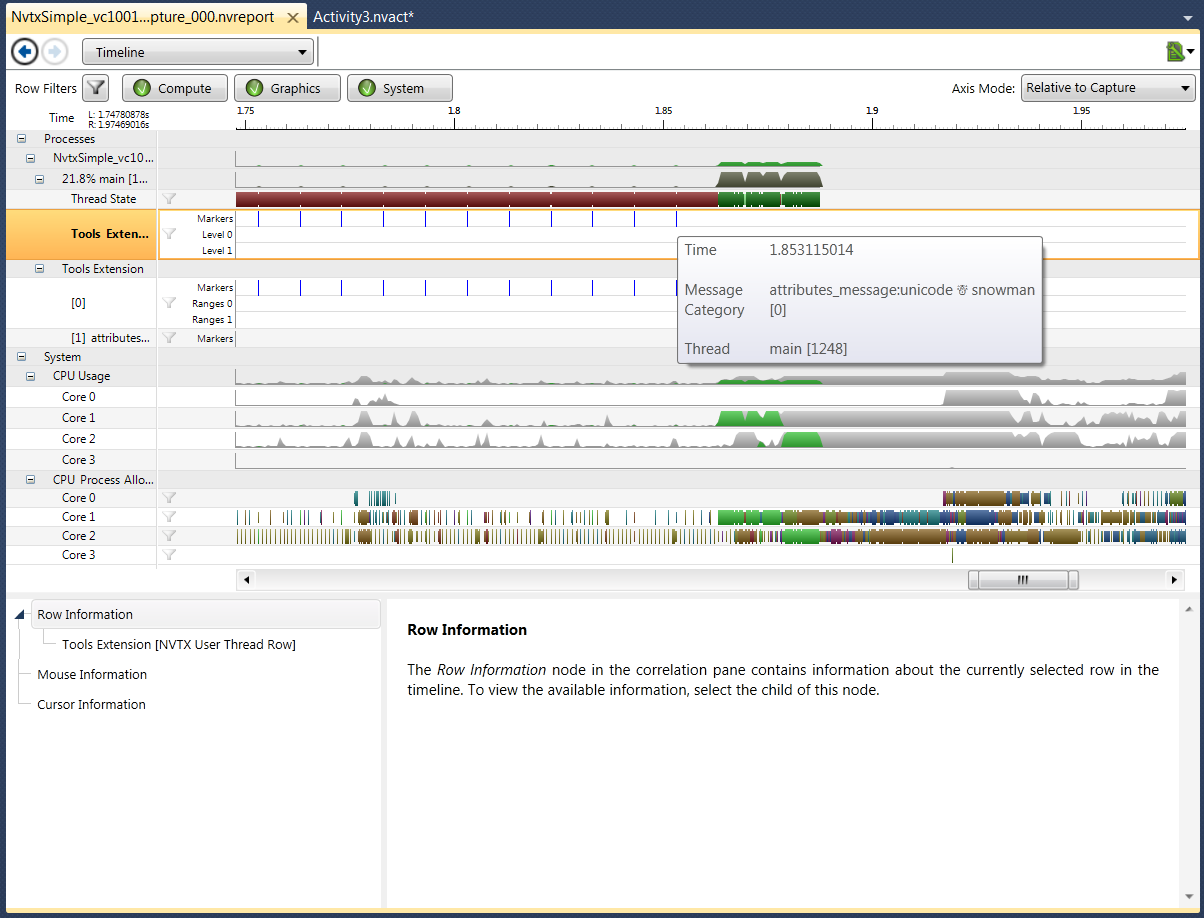
The message field can be used to specify an optional string. As shown below, the results can be seen both in the Tools Extension Events table, as well as on the timeline report.
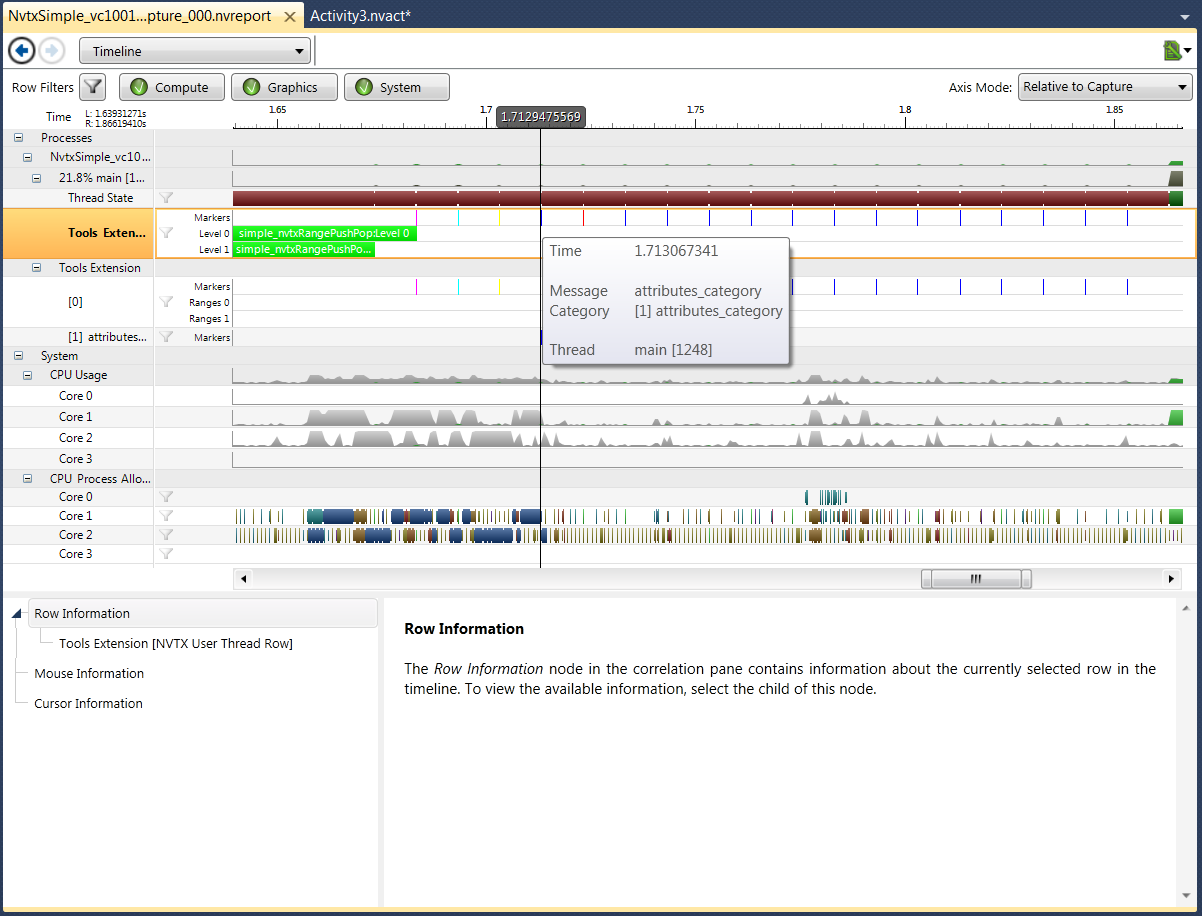
Name an NVTX category with a string. Each category is defined by a unique ID, and that ID is passed into any markers, Push/Pop, or Start/End events in order to note that those events are part of a particular category. The category names show up in the report table as well as the Timeline Report alongside the category ID.
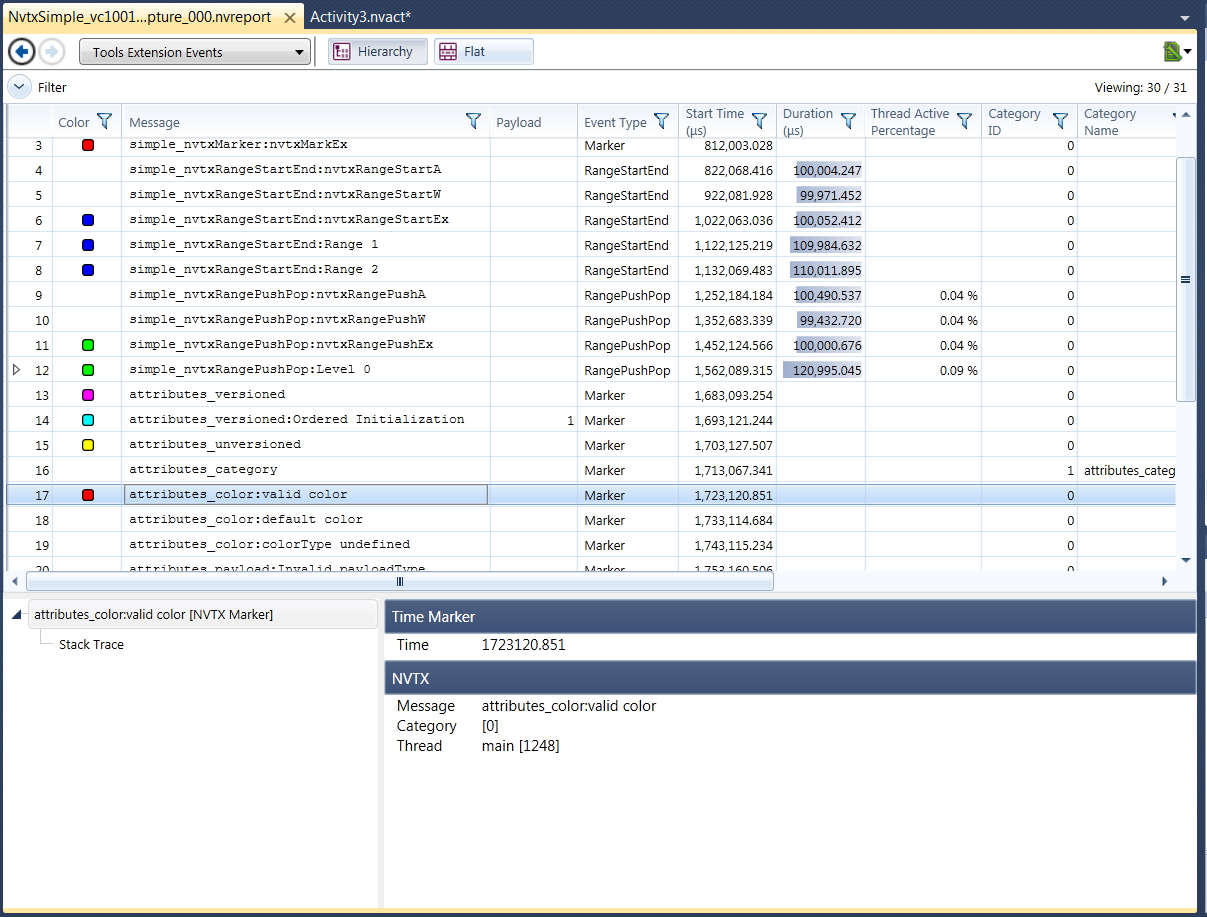
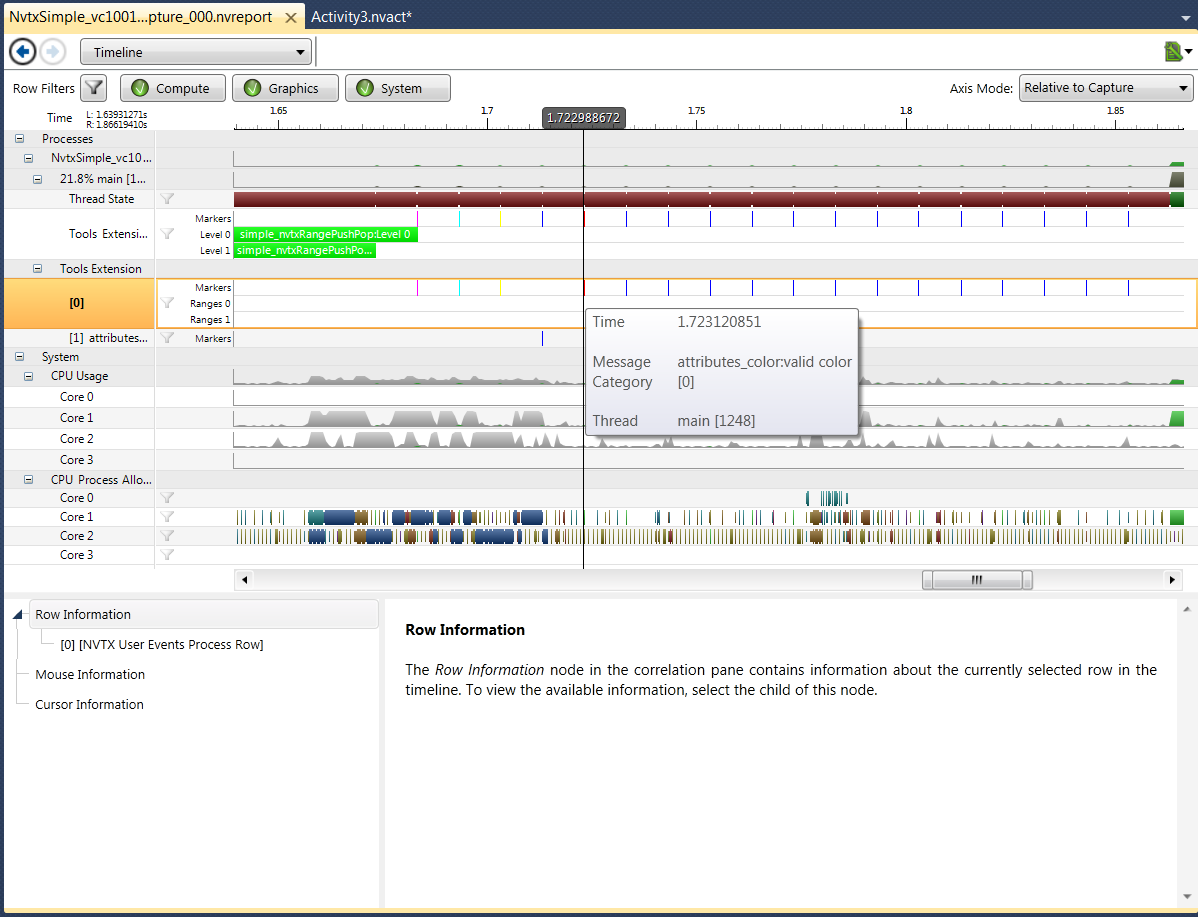
The color attribute helps you to visually identify events in the tool. The results can be viewed in the Tools Extension Events and Timeline reports, shown below.
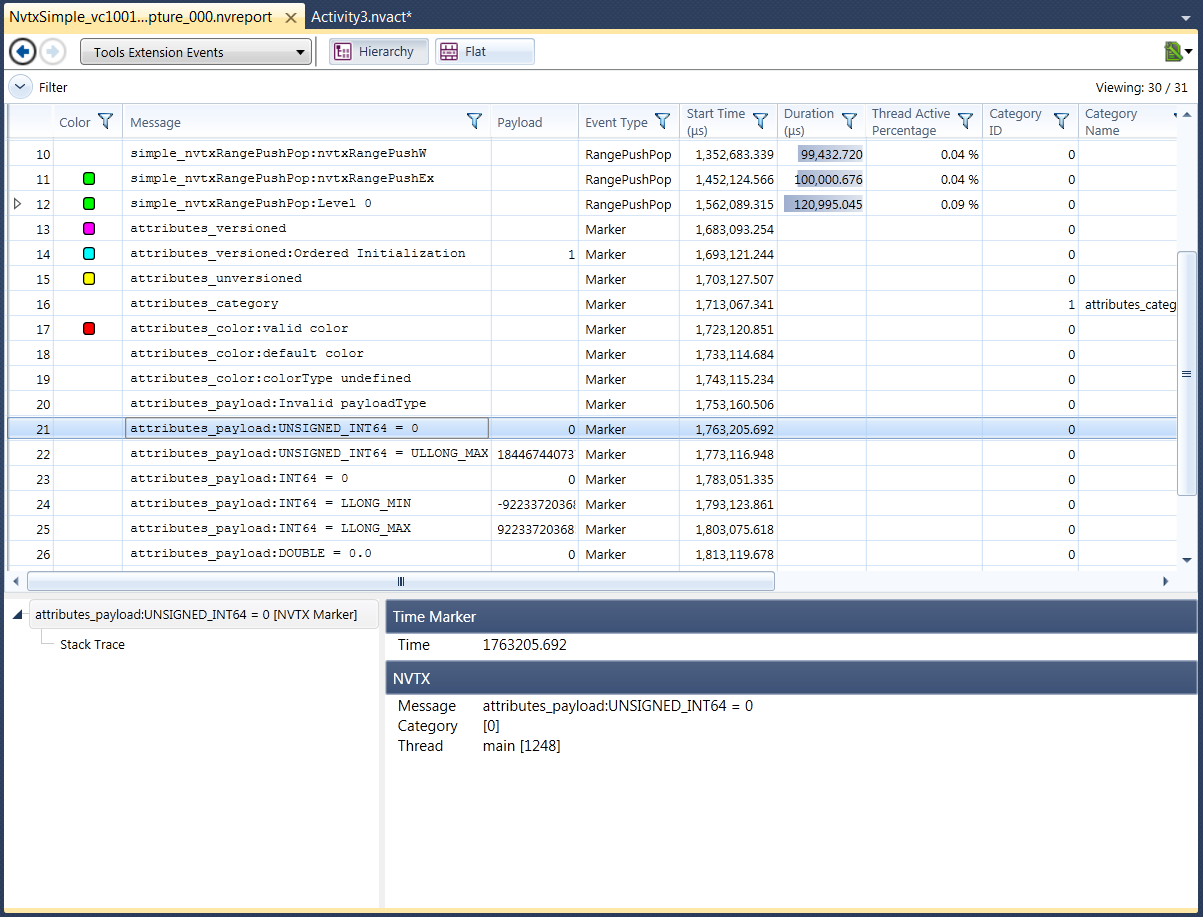
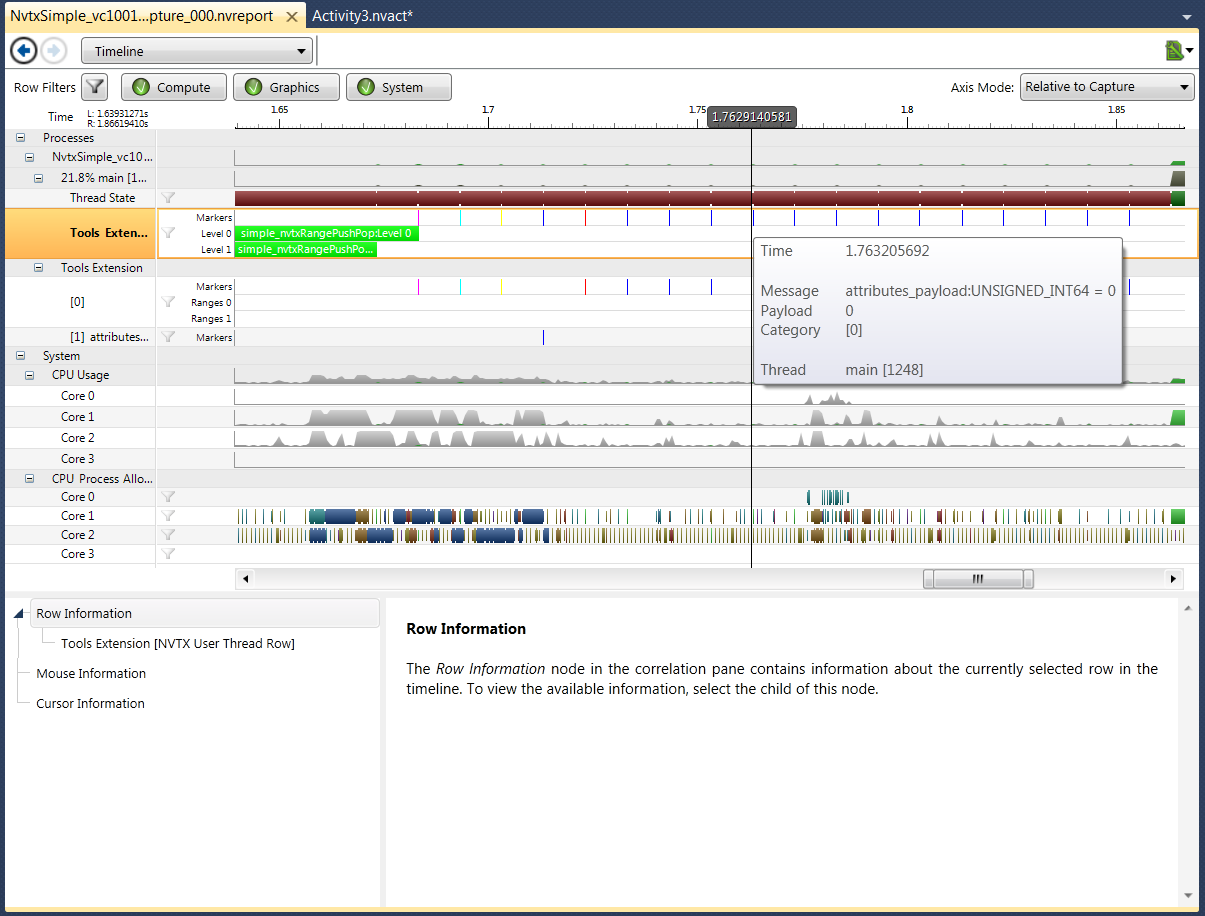
The payload field provides additional information for markers and ranges. The results are displayed in the Tools Extension Events and Timeline reports, shown below.
NVIDIA Nsight has made further analysis data available for NVTX push/pop ranges via the Range Statistics detail pane. For the selected range in focus, the profile information details on any captured API usage that happened during the range’s life span. In addition, statistics for any GPU workload, which were spawned due to an API call made during the time span of the target range, are provided. With the overall API usage and the dependent GPU workload for each push/pop range at hand, NVTX push/pop ranges can be used to efficiently pinpoint code sections with increased resource utilization.
For each API domain, actively used during a time span of the target range, the range statistics table provides the total number of API calls made (API Call Count) as well as the sum of time spend to execute all those calls (API Call Duration). Both values are reported in four different ways:
In order to have a GPU workload event being attributed to a push/pop range, the corresponding API call that issued the GPU workload needs to be captured and this API call has to take place during the life time of the selected target range. The statistical data presented for those GPU events are the overall number of GPU workloads executed (GPU Work Count), the overall time at least one GPU workload was in flight (GPU Activity), and the overall time multiple GPU workloads were executed on the GPU (GPU Work Overlap). All performance values are reported in the four different variants as described in the previous section.
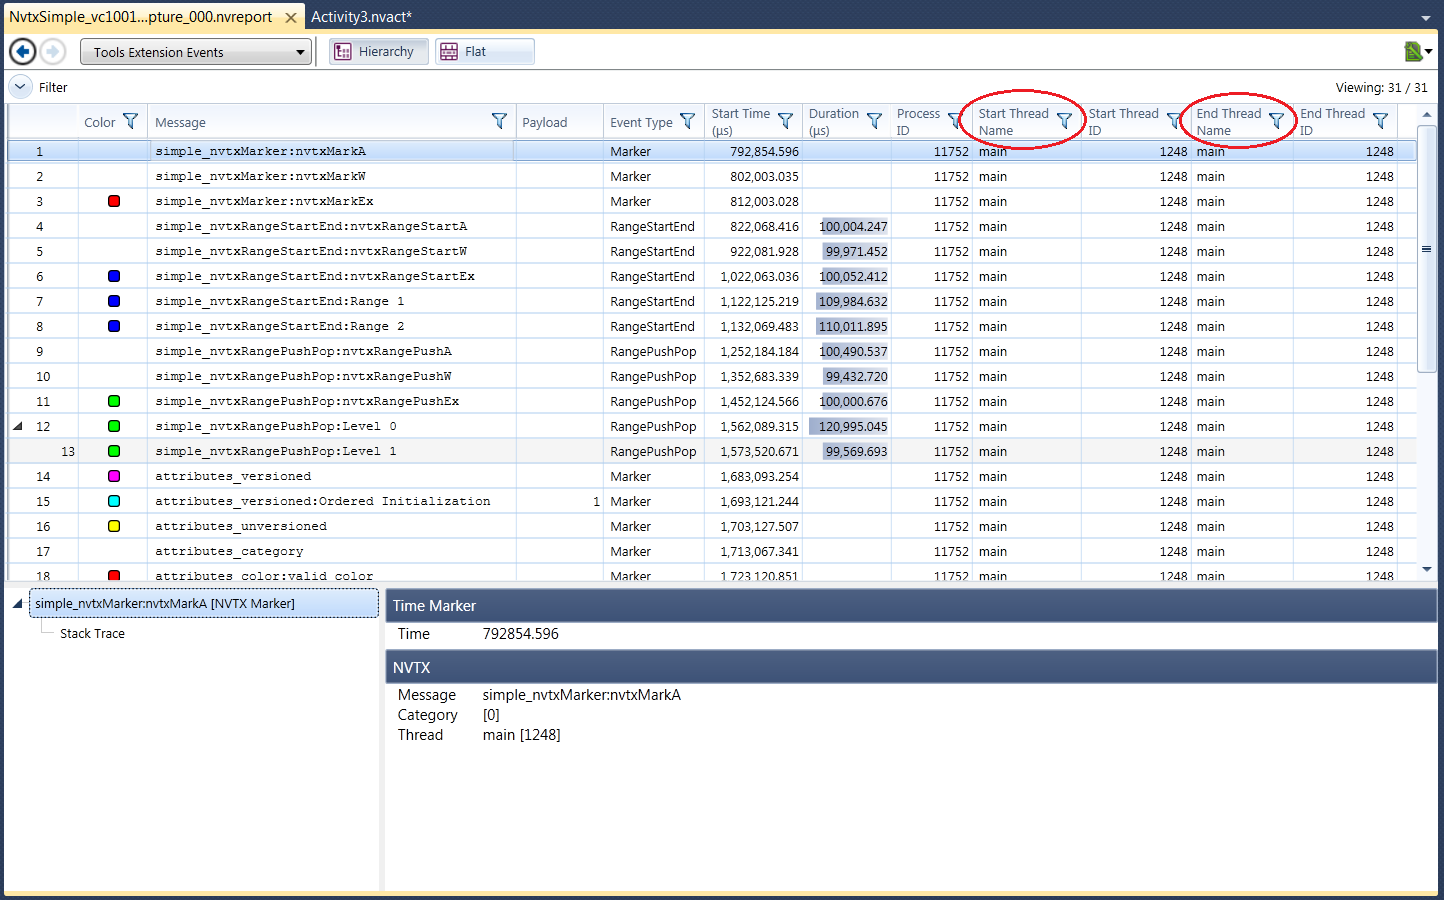
The user-provided thread name is used to annotate the label of the corresponding thread row. All report pages have a new column called Start Thread Name and End Thread Name that will display the name as well. This column is hidden by default, but can be enabled using the column chooser (simply right-click on a column header).

NVIDIA® GameWorks™ Documentation Rev. 1.0.220830 ©2014-2022. NVIDIA Corporation and affiliates. All Rights Reserved.