PhysX Visual Debugger (PVD)
PVD
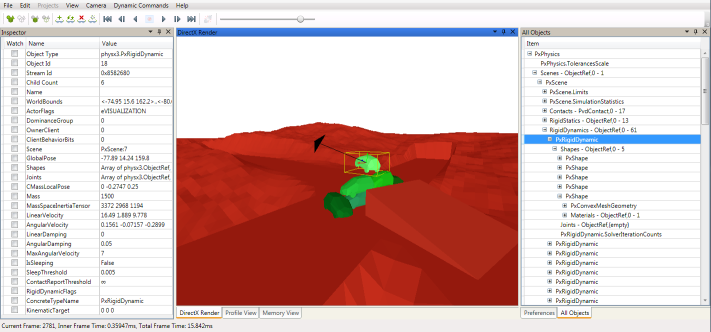
The PhysX Visual Debugger (PVD) provides a graphical view of the PhysX scene and includes various tools to inspect and visualize variables of every PhysX object. Additionally it can also record and visualize memory and timing data.
PVD can be downloaded from: http://supportcenteronline.com/ics/support/default.asp?deptID=1949
Questions regarding the usage of the GUI should all be answered by its detailed built-in help.
Basic Setup (SDK Side)
PVD integration is enabled in the debug, checked and profiling configurations of the SDK. In order to reduce memory footprint and code size, it is not enabled in the release configuration.
The SDK outputs the PVD debugging data in form of a stream. PVD supports reading the stream either from a TCP/IP network socket or from a file.
Network Setup
Streaming to TCP/IP is supported on almost all platforms, and is usually the most convenient way to collect PVD data. In this mode the stream can be watched in real-time, depending on network speed and scene complexity. In network mode PVD acts as a TCP/IP server and must therefore be launched before the SDK tries to connect to it. The default listening port is 5425:
// check if PvdConnection manager is available on this platform
if(mPhysics->getPvdConnectionManager() == NULL)
    return;

// setup connection parameters
const char*     pvd_host_ip = "127.0.0.1";  // IP of the PC which is running PVD
int             port        = 5425;         // TCP port to connect to, where PVD is listening
unsigned int    timeout     = 100;          // timeout in milliseconds to wait for PVD to respond,
                                            // consoles and remote PCs need a higher timeout.
PxVisualDebuggerConnectionFlags connectionFlags = PxVisualDebuggerExt::getAllConnectionFlags();

// and now try to connect
PxVisualDebuggerConnection* theConnection =
    PxVisualDebuggerExt::createConnection(mPhysics->getPvdConnectionManager(),
    pvd_host_ip, port, timeout, connectionFlags));
Before releasing PxPhysics, release the debugger connection:
if (theConnection)
    theConnection->release();
The collection is reference counted, so call this one time for each call to createConnection().
File Setup
Streaming to file is an alternative to network streams. This is the recommended fall-back in case your platform or system setup does not support a network connection to PVD. File streams are often faster than network sockets and therefore a good alternative if performance is more important than real-time viewing. Streams stored as files can be loaded by drag&drop or over the File->Load menu in PVD:
// check if PvdConnection manager is available on this platform
if(mPhysics->getPvdConnectionManager() == NULL)
    return;

// setup connection parameters
const char*     filename = "C:\\PvdCapture.pxd2";  // filename where the stream will be written to
PxVisualDebuggerConnectionFlags connectionFlags = PxVisualDebuggerExt::getAllConnectionFlags();

// and now try to connect
PxVisualDebuggerConnection* theConnection =
    PxVisualDebuggerExt::createConnection(mPhysics->getPvdConnectionManager(),
    filename, connectionFlags);
Before releasing PxPhysics, release the debugger connection:
if (theConnection)
    theConnection->release();
The collection is reference counted, so call this one time for each call to createConnection().
Advanced Setup
Connection Flags
To optimize the stream size we provide flags to enable specific features. This has both influence on PVD's and the SDK's performance:
- PxVisualDebuggerConnectionFlag::eDEBUG: Transfer all debug data to visualize and inspect objects. This flag has usually the biggest impact on the stream's size.
- PxVisualDebuggerConnectionFlag::ePROFILE: Transfer timing information of various profiling zones in our SDK.
- PxVisualDebuggerConnectionFlag::eMEMORY: Transfer memory usage data of our SDK.
Setup to transfer only profiling data over network:
PxVisualDebuggerConnection* theConnection =
    PxVisualDebuggerExt::createConnection(mPhysics->getPvdConnectionManager(),
    pvd_host_ip, port, timeout, PxVisualDebuggerConnectionFlag::Profile);
Visualizing Externals and Extended Data
Joints are implemented as an extension to the SDK constraints and therefore need special handling to get transmitted to PVD. Both joint and contact data can increase the stream size significantly. Visualizing it in PVD is therefore disabled by default. To enable them use following API calls:
mPhysics->getVisualDebugger()->setVisualDebuggerFlags
    (PxVisualDebuggerFlags::eTRANSMIT_CONTACTS | PxVisualDebuggerFlag::eTRANSMIT_CONSTRAINTS);
or set the flags separately:
mPhysics->getVisualDebugger()->setVisualDebuggerFlag
    (PxVisualDebuggerFlags::eTRANSMIT_CONSTRAINTS, true);
mPhysics->getVisualDebugger()->setVisualDebuggerFlag
    (PxVisualDebuggerFlags::eTRANSMIT_CONTACTS, true);
Visualizing SceneQuery
Visualizing SceneQuery in PVD is disabled by default since queries and hits data can increase the stream size significantly. To enable it use following API calls:
mPhysics->getVisualDebugger()->setVisualDebuggerFlag
    (PxVisualDebuggerFlags::eTRANSMIT_SCENEQUERIES, true);
Connection Handler
Implement the PxVisualDebuggerConnectionHandler interface if your application needs to react upon connection or disconnection from PVD, or if you plan to send custom PVD events from your application. It is recommended to toggle the contact and constraint visualization in the onPvdConnected/onPvdDisconnected callbacks to avoid potential memory and compute overhead in the SDK. The use of PxVisualDebuggerConnectionHandler is demonstrated in our samples and the external joint implementation:
// derive from PvdConnectionHandler
struct MyConnectionHandler : public PxVisualDebuggerConnectionHandler
{
    virtual void onPvdSendClassDescriptions( PxVisualDebuggerConnection& inFactory )
    {
        // send your custom PVD class descriptions from here
        // this then allows PVD to correctly identify and represent
        // custom data that is sent from your application to a PxVisualDebuggerConnection.
        // example in JointConnectionHandler
    }
    virtual void onPvdConnected( PxVisualDebuggerConnection& )
    {
        // do something when successfully connected
        // e.g. enable contact and constraint visualization
    }
    virtual void onPvdDisconnected( PxVisualDebuggerConnection&)
    {
        // handle disconnection
        // e.g. disable contact and constraint visualization
    }
};

// register custom handler
MyConnectionHandler myConnectionHandler;
if(mPhysics->getPvdConnectionManager())
    mPhysics->getPvdConnectionManager()->addHandler(&myConnectionHandler);
PVD Error Stream
PhysX SDK sends all its own error messages to PVD if PVD is connected. In addition, for error message send from user application, please call function PxVisualDebugger::sendErrorMessage(PxErrorCode::Enum code, const char message, const char* file, PxU32 line)* directly to send the messages to PVD.
Alternatively, you can also call Ps::Foundation::error() or Ps::Foundation::getErrorHandler()::reportError() to report your error message. These functions will send error messages to PVD automatically.
The messages will be listed in ErrorStream view of PVD.