
Android.mk file:APP_OPTIM := debug
We discourage you from doing this because profiling information gathered on non-optimized code does not correctly reflect the performance you can expect if you let the compiler optimize the code.
Now that you know how to create non-trivial native Android apps, we want to make them run fast. The first thing to do, before evaluating whether the application is fast enough, is to try building and running the project in the release mode, as opposed to the debug mode (see section Preparing for profiling below). If that didn't give you enough speed-up, you will have to employ heavier tools. To find the hot spots in your application and optimize them away, you have to profile the application code. There are several tools and approaches that will help you in profiling on Tegra-based devices.
In this tutorial we will learn how to use the first and the second approach for the code example SimpleImageOpenCV.
For PerfHUD ES, we will use the last of the OpenGL ES tutorials, SimpleImageDisplayGL.
First of all, we need to check whether you have the profiling tools. If you chose to install the complete version of CodeWorks for Android, you already have Tegra System Profiler (on Windows) and PerfHUD ES in your NVPACK folder.
For all the profilers you need to add these flags in the Application.mk file:
APP_CFLAGS += -fno-omit-frame-pointer -mno-thumb
If compiler optimizations are causing incorrect function backtraces, you can add -g flag:
APP_CFLAGS += -fno-omit-frame-pointer -mno-thumb -g
We need to make sure your application is compiled in release mode. If you created build configurations, right-click on the project's name in the in the Project Explorer pane, then Build Configuration > Set Active > Release. Otherwise, right-click on the project's name in the in the Project Explorer pane, then Properties; click on the C/C++ Build entry in the left pane and look at the Build Command field: if it contains NDK_DEBUG = 1, either remove it or set it to zero.
|
|
Note: You might find in the documentation for the profiling tools that another solution to the problem of incorrect backtraces is to compile your application in debug mode, using for instance the following flag in the Android.mk file:APP_OPTIM := debug We discourage you from doing this because profiling information gathered on non-optimized code does not correctly reflect the performance you can expect if you let the compiler optimize the code. |
Now, clean the project, compile it, and you're ready to start profiling.
This tool is easy to set up and use, therefore it is a recommended choice for Windows hosts. There is a complete user guide here, but we'll go over the basics with a full example here.
Launch Tegra System Profiler, and a new project will be docked in the interface.
If you have more than one device attached to your computer, use the Device drop-down list in the top-left to select your device. Details for the selected device are shown below the combo box.
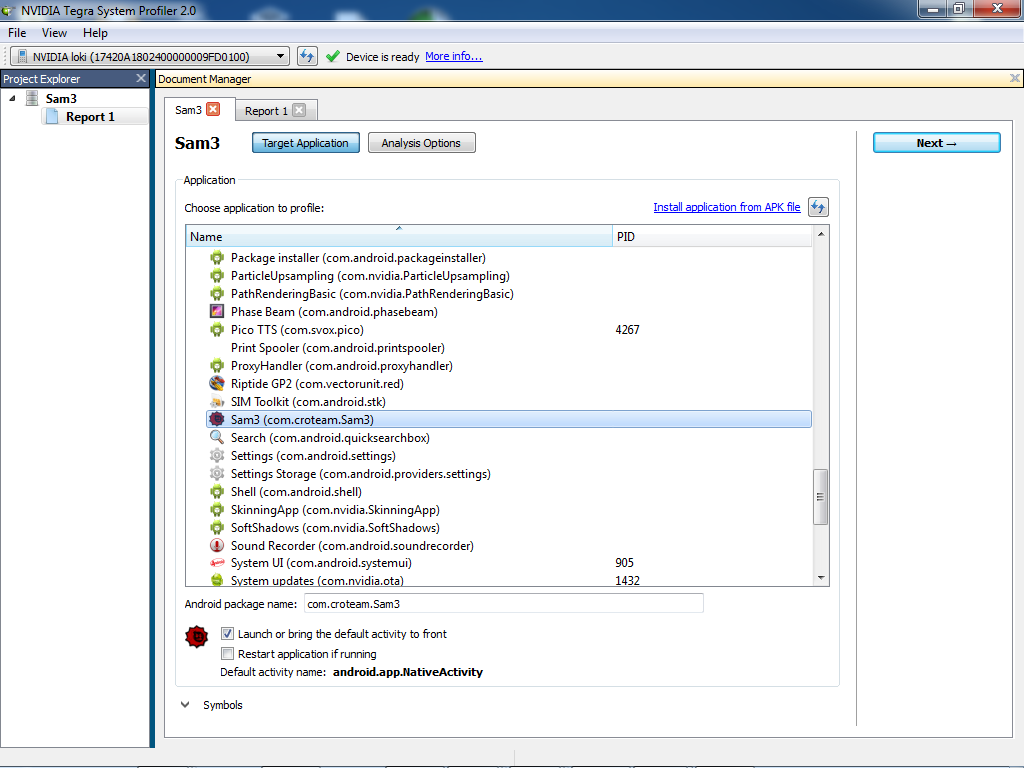
Select the application to sample. If you have already installed your application on the device, choose the Application option and select your application from the combo box.
The list also includes a PID column, so you can see whether or not the process is already running. Below are checkboxes that control the attach and relaunch behaviors.
Alternatively, if you have an APK on your computer, and would like deploy it to the device for sampling, click the "Install application from APK file" link, located above the application list, and it will pop up a standard file selection dialog. The APK will be installed, and then you may select it in the application list.
Below the application area is a collapsible area for symbols. Some APKs will have their symbols but into the *.so files but most will not. Instead, right-click on this list, and add a directory pointing at the version of the *.so files in your APK that are not stripped of symbols. Typically this is the output of the native build stage, before it is copied into the APK packaging directory and then stripped there.
|
|
Note: If you do not provide symbols, then functions will appear with their hexadecimal address instead of its proper name. |
Press the Next button in the upper-right corner, to switch to the Analysis Options setup page.
Select the sampling rate and hardware counters you would like to sample. Turn on Collect Call Stacks to calculate backtraces for each sample (at a significant impact to sampling performance). The higher the rate, the more data you will generate and the more impact sampling will have on your application. We recommend 10 kHz for short sessions of 30 seconds or less, as long sessions may terminate due to fast buffering requirements.
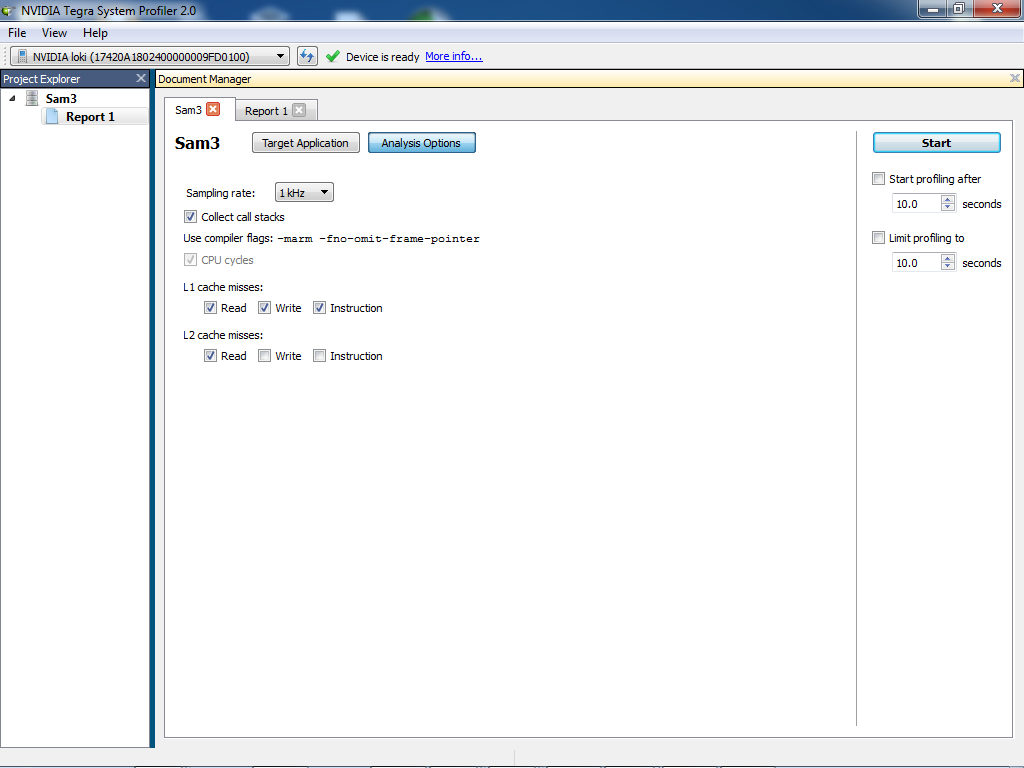
Choose whether you wish to start capturing immediately, on demand, or after a predefined period of time, and whether you wish to stop sampling on demand or after a predefined period of sampling.
Press Start.
Press the Stop sampling button when you have exercised your application sufficiently.
In the end you should see something like this:
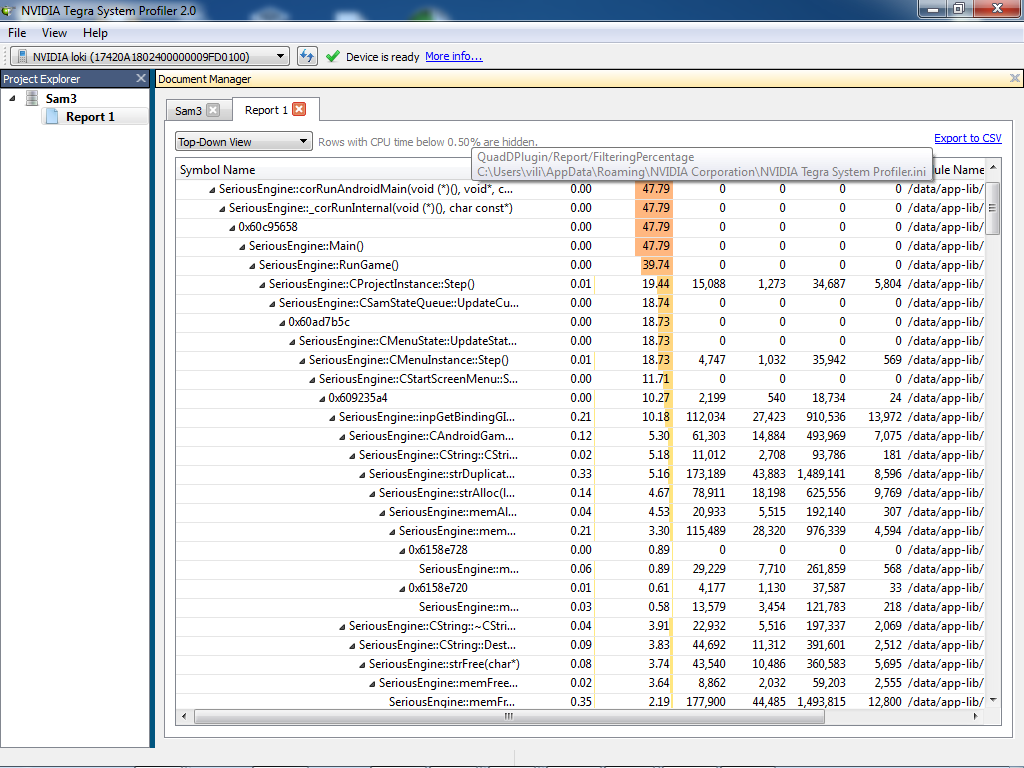
From this report it is easy to see which functions required more time to run (the percentages by the different function names), as well as the temporal distribution of the different calls (in this example, calls are mostly uniformly distributed).
Sometimes, instead of sampling what function is being executed and determining a rough percentage of time spent on different functions, you need to get exact execution times of particular lines (or blocks) of the code. To this end, you can use timers. In this tutorial we provide you with a timer class that allows you to do that, or you can write your own. If you are familiar with Matlab's tic and toc functions you'll find yourself at home with this class.
Much like Matlab's timing functions, this timer saves the timestamps of successive calls of the function Timer::tic() in a stack. Subsequent calls to Timer::tic() provide the time elapsed (in ms) from the last Timer::tic() call, and pop that timestamp from the stack. You can also get the time in milliseconds since the construction of the timer by using Timer::get().
To see how to use the timer class, we will play again with the SimpleImageOpenCV example. Let's measure how long it takes to compute Fast features on your device. Copy Timer.cpp and Timer.h from /tutorials/SharedCode into <Your Workspace>/SimpleImageOpenCV/jni. (If you copy them outside of Eclipse, you should select jni folder and refresh with F5 so you'll see them.) Then, open OpenCV_native.cpp. Let's include a couple of headers in this file (more information about logging can be found in Printing to Android log from native code):
#include "Timer.h"        // The timer class
#include <android/log.h>  // We will use android's log to print the timing results
// Let's define a tag called MyTimer so that we can filter logs later
#define LOG(...) __android_log_print(ANDROID_LOG_VERBOSE, "MyTimer", __VA_ARGS__)
We also need to add the timer source file to the list of source files in the Android.mk file:
LOCAL_SRC_FILES := main.cpp Engine.cpp DrawRect.cpp RectShader.cpp OpenCV_native.cpp Timer.cpp
Now let's find the chunk of code we want to analyze in OpenCV_native.cpp, and let's add a couple of lines to the function COpenCVSample::runOpenCVFeatureDetector():
// detect FAST features
Timer t;

t.tic(); // Start the timer

std::vector<cv::KeyPoint> v;
cv::FastFeatureDetector detector(50);
detector.detect(g_img, v);

LOG("cv::FastFeatureDetector took %d ms to run.", t.toc()); // t.toc() gives the time in ms since t.tic()
Before we run the code, let's open the LogCat view in Eclipse to see the logs. Go to Window > Show View > LogCat. If you don't see the LogCat option, go to Window > Show View > Other... and look for LogCat. Now let's add a filter so that our logs don't get lost in a bunch of clutter. Click on the plus symbol in the Filters pane:
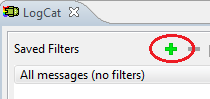
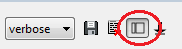
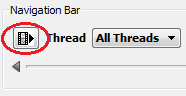
If you don't see the filter pane, you need to toggle the Filter view button:
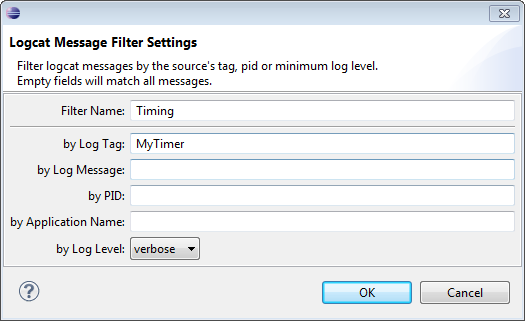
Finally name the filter and use the same tag we defined in the cpp file:
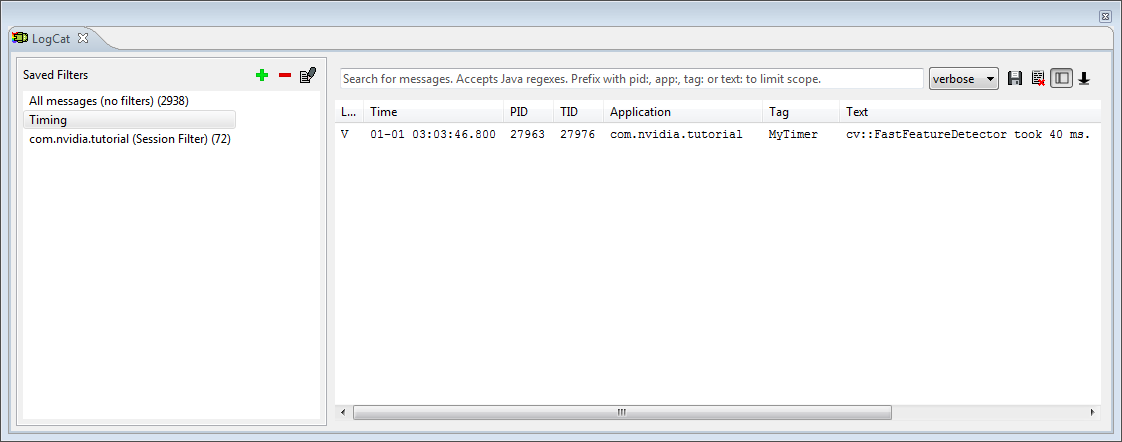
Now if we run the application on the device and select the option IMAGE, we should see in the LogCat viewer something like the following (click on the image to enlarge):
PerfHUD ES is a complete tool for profiling and debugging OpenGL ES applications. It allows you to access performance information, as well as the call trace, mipmaps, etc.
If you chose to install the complete version of CodeWorks for Android, you already have PerfHUD ES in your NVPACK folder. In the same folder you can find a guide to its use. In order for PerfHUD ES to be able to gather statistics, we have to first enable the target support.
Connect your device; then go to NVPACK_PATH/perfhud_switch folder and run the file enable_perfhud.bat (in Linux or Mac enable_perfhud.sh). Note that this script only enables support until the device is rebooted, so you'll have to do it again if you turn your device off.
Let us use the SimpleImageDisplayGL tutorial to learn the basics of the profiler. Because of the way PerfHUD ES talks to the application, we need to recompile the project adding internet permission in AndroidManifest.xml:
<manifest xmlns:android="http://schemas.android.com/apk/res/android"
package="com.nvidia.tutorial"
android:versionCode="1"
android:versionName="1.0">

<uses-permission android:name="android.permission.INTERNET" />

[...]
Now you can compile and run the application on your device. Let's open LogCat and type NV in the search field. You should see the following messages (and a bunch more):
NV Interposer: nvdmInit called by perfhud
NV Interposer: NVPerfHUD ES is active.
NV Interposer: Communication layer init succeed, listen on port 7876.
|
|
Note: If you have a firewall software installed on your host machine you might have to open the port indicated in the LogCat as shown above to allow PerfHUD ES to communicate with the application on your Tegra device. |
We can now start PerfHUD ES, while the application is running. You should see a screen like the one below:
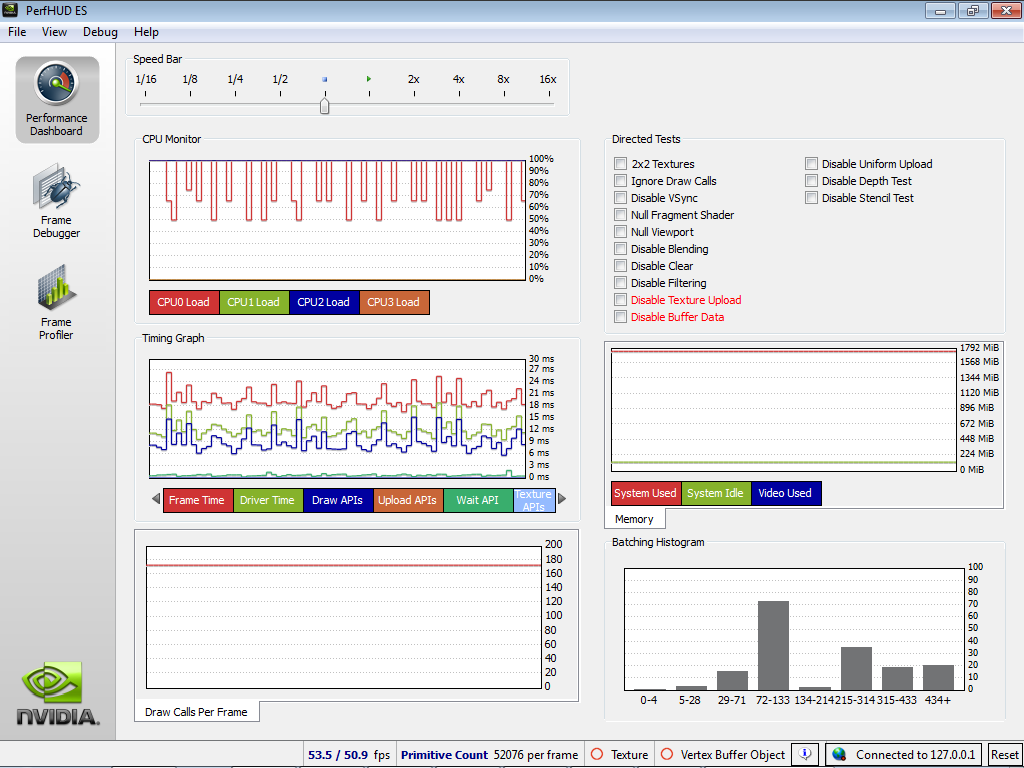
The first graph shows the CPU load for the different CPUs, the second shows a bunch of statistics. You can choose to show/hide any of these statistics by clicking on their name below the graph. Let's switch to the Frame Debugger mode (second button on the left-hand frame):
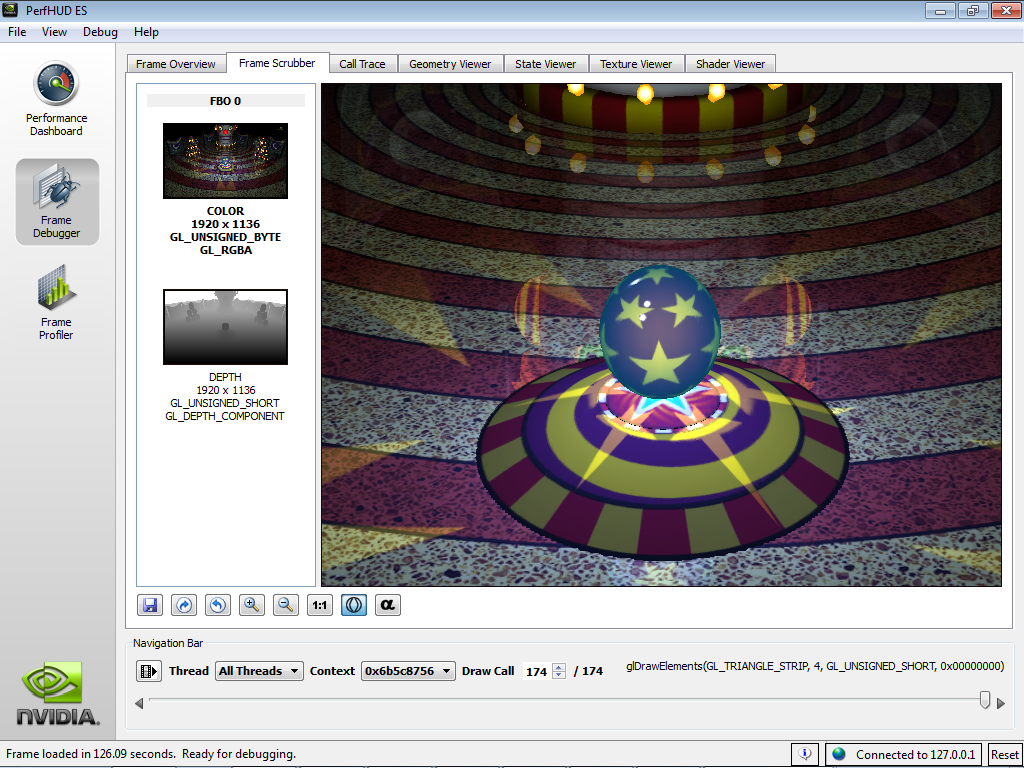
There are several tabs at the top. The currently active tab, Frame Scrubber, shows the content of the frame buffer at the time of different draw calls. In the current view, the word OFF should be blinking: that was the element that was drawn by the current call. At the bottom of the window you will see a scroll-bar (circled in red in the figure above). Right above it you will see the call to glDrawElements(). If you drag the bar back one step by 3 steps you will see that the background was rendered (hopefully you will not get an attack of epilepsy) with the call glDrawElements().
Note that this bar is common to all the Frame Scrubber tabs. For instance, if you go to the Texture Viewer, you can use it to change between different draw calls and see the corresponding textures (it should flip between the background image and different sets of fonts).
The most interesting tab is probably the Shader Viewer tab. Here you can see what shaders are called and when. In our example, we do not precompile the shaders so we can see the code, interact with it, and even change it at run-time!
Let's look at the top-left pane:
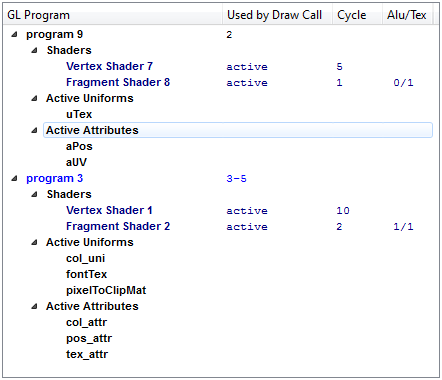
Note that the actual numbers of the programs might be different in the window you are looking at. In this case, program 3 is relative to the text we've drawn on the screen (the two buttons and the timer) and was therefore used by the last three draw calls (as indicated by "3-5" in the Used by Draw Call column). Since the scroll-bar at the bottom is all the way to the left, this program is shown as active (light blue). Note that you can click on any of the attributes or uniforms to see values and information. Now use the navigation bar to go back to the second draw call and you will see that program 9, which is relative to the background texture, becomes active. The fragment and vertex shaders shown in the right pane are plain.frag and plain.vert from our code.
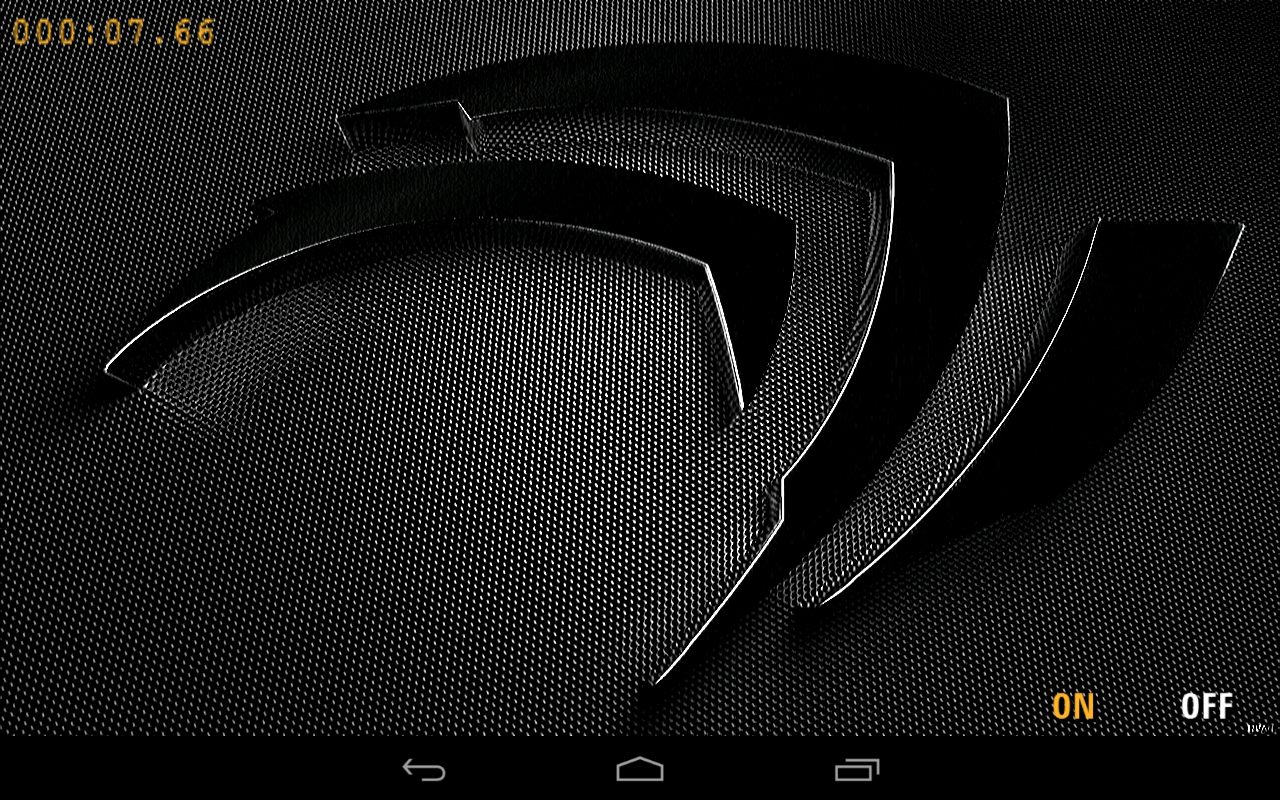
Let's go on the device and hit the ON button in the example application; PerfHUD ES will not update this view automatically, we need to hit the button to Capture next frame, indicated by the red circle in this screenshot:
Now the shaders in the right pane are our filter.vert and filter.frag. Note that if you click on uniforms within the code you will be able to see information about it in the left panes. Let's go to the fragment shader, and change the sobel filter to be from vertical to horizontal.
Click the Edit Shader button and replace the first 6 lines of the main function with:
gl_FragColor = texture2D( uTex, vTexCoord + vec2( uD.x, uD.y ) );
gl_FragColor += 2.0 * texture2D( uTex, vTexCoord + vec2( uD.x, 0.0 ) );
gl_FragColor += texture2D( uTex, vTexCoord + vec2( uD.x, -uD.y ) );
gl_FragColor -= texture2D( uTex, vTexCoord + vec2( -uD.x, uD.y ) );
gl_FragColor -= 2.0 * texture2D( uTex, vTexCoord + vec2( -uD.x, 0.0 ) );
gl_FragColor -= texture2D( uTex, vTexCoord + vec2( -uD.x, -uD.y ) );
Then hit Compile and Apply. Look at the screen of your device and you should see that now the screen has changed:
PerfHUD ES is also a powerful profiling tool. However, aside from the information provided in the Performance Dashboard tab, the profiling data is only available for specific system images and, therefore, we will not cover those capabilities here.

NVIDIA® GameWorks™ Documentation Rev. 1.0.220830 ©2014-2022. NVIDIA Corporation and affiliates. All Rights Reserved.