# Creating More Advanced Charts
[Source code](/apis-and-interfaces/vega/vega-tutorials/tutorial-more-advanced-charts#source-code) is located at the end of this tutorial.
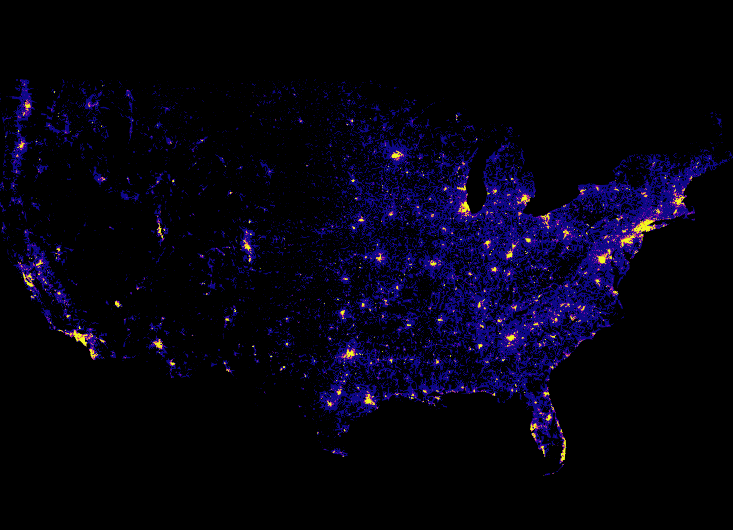
This tutorial introduces you to [Symbol Type](/apis-and-interfaces/vega/vega-reference-overview/marks-property#symbol-type) `marks` by creating a heatmap visualization. The heatmap shows contribution level to the Republican party within the continental United States:
The contribution data are obtained using the following SQL query:
```
"data": [
{
"name": "heatmap_query",
"sql": "SELECT rect_pixel_bin(conv_4326_900913_x(lon), -13847031.457875465, -7451726.712679257, 733, 733) as x,
rect_pixel_bin(conv_4326_900913_y(lat), 2346114.147993467, 6970277.197053557, 530, 530) as y,
SUM(amount) as cnt
FROM contributions
WHERE (lon >= -124.39000000000038 AND lon <= -66.93999999999943) AND
(lat >= 20.61570573311549 AND lat <= 52.93117449504004) AND
amount > 0 AND
recipient_party = 'R'
GROUP BY x, y"
}
]
```
The visualization uses a Symbol Type marks type to represent each data item in the `heatmap_query` data table:
```
"marks": [
{
"type": "symbol",
"from": {
"data": "heatmap_query"
},
"properties": { ... elided ... }
}
]
```
The marks `properties` property specifies the symbol shape, which is a `square`. Each square has a pixel `width` and `height` of one pixel.
```
"marks": [
{
... elided ...
"properties": {
"shape": "square",
"x": {
"field": "x"
},
"y": {
"field": "y"
},
"width": 1,
"height": 1,
"fillColor": {
"scale": "heat_color",
"field": "cnt"
}
}
}
]
```
Notice that the data `x` and `y` location values do not reference a scale. The location values are the values of the SQL query, transformed using extension functions.
The fill color of the square uses the `heat_color` scale to determine the color used to represent the data item.
Quantize scales are similar to linear scales, except they use a discrete rather than continuous range. The continuous input domain is divided into uniform segments based on the number of values in the output range.
```
"scales": [
{
"name": "heat_color",
"type": "quantize",
"domain": [
10000.0,
1000000.0
],
"range": [ "#0d0887", "#2a0593", "#41049d", "#5601a4", "#6a00a8",
"#7e03a8", "#8f0da4", "#a11b9b", "#b12a90", "#bf3984",
"#cb4679", "#d6556d", "#e16462", "#ea7457", "#f2844b",
"#f89540", "#fca636", "#feba2c", "#fcce25", "#f7e425", "#f0f921"
],
"default": "#0d0887",
"nullValue": "#0d0887"
}
]
```
A heatmap shows a continuous input domain divided into uniform segments based on the number of values in the output range. This is a `quantize` scales type. In the example, dollar amounts between $10,000 and $1 million are uniformly divided among 21 range values, where the larger amounts are represented by brighter colors.
Values outside the domain and `null` values are rendered as dark blue, `#0d0887`.
## Source Code
Advanced Chart Type Tutorial Directory Structure
```
index.html
/js
browser-connector.js
vegaspec.js
vegademo.js
```
### HTML
Advanced Chart Type Tutorial index.html
```
OmniSci
```
### JavaScript
Advanced Chart Type Tutorial vegademo.js
```
function init() {
var vegaOptions = {}
var connector = new MapdCon()
.protocol("http")
.host("my.host.com")
.port("6273")
.dbName("omnisci")
.user("omnisci")
.password("changeme")
.connect(function(error, con) {
con.renderVega(1, JSON.stringify(exampleVega), vegaOptions, function(error, result) {
if (error) {
console.log(error.message);
}
else {
var blobUrl = `data:image/png;base64,${result.image}`
var body = document.querySelector('body')
var vegaImg = new Image()
vegaImg.src = blobUrl
body.append(vegaImg)
}
});
});
}
```
Advanced Chart Type Tutorial vegaspec.js
```
const exampleVega = {
"width": 733,
"height": 530,
"data": [
{
"name": "heatmap_query",
"sql": "SELECT rect_pixel_bin(conv_4326_900913_x(lon), -13847031.457875465, -7451726.712679257, 733, 733) as x,
rect_pixel_bin(conv_4326_900913_y(lat), 2346114.147993467, 6970277.197053557, 530, 530) as y,
SUM(amount) as cnt
FROM contributions
WHERE (lon >= -124.39000000000038 AND lon <= -66.93999999999943) AND
(lat >= 20.61570573311549 AND lat <= 52.93117449504004) AND
amount > 0 AND
recipient_party = 'R'
GROUP BY x, y"
}
],
"scales": [
{
"name": "heat_color",
"type": "quantize",
"domain": [
10000.0,
1000000.0
],
"range": [ "#0d0887", "#2a0593", "#41049d", "#5601a4", "#6a00a8",
"#7e03a8", "#8f0da4", "#a11b9b", "#b12a90", "#bf3984",
"#cb4679", "#d6556d", "#e16462", "#ea7457", "#f2844b",
"#f89540", "#fca636", "#feba2c", "#fcce25", "#f7e425", "#f0f921"
],
"default": "#0d0887",
"nullValue": "#0d0887"
}
],
"marks": [
{
"type": "symbol",
"from": {
"data": "heatmap_query"
},
"properties": {
"shape": "square",
"x": {
"field": "x"
},
"y": {
"field": "y"
},
"width": 1,
"height": 1,
"fillColor": {
"scale": "heat_color",
"field": "cnt"
}
}
}
]
};
```