# Using Polys Marks Type
[Source code](/apis-and-interfaces/vega/vega-tutorials/tutorial-polys-marks-type#source-code) can be found at the end of this tutorial.
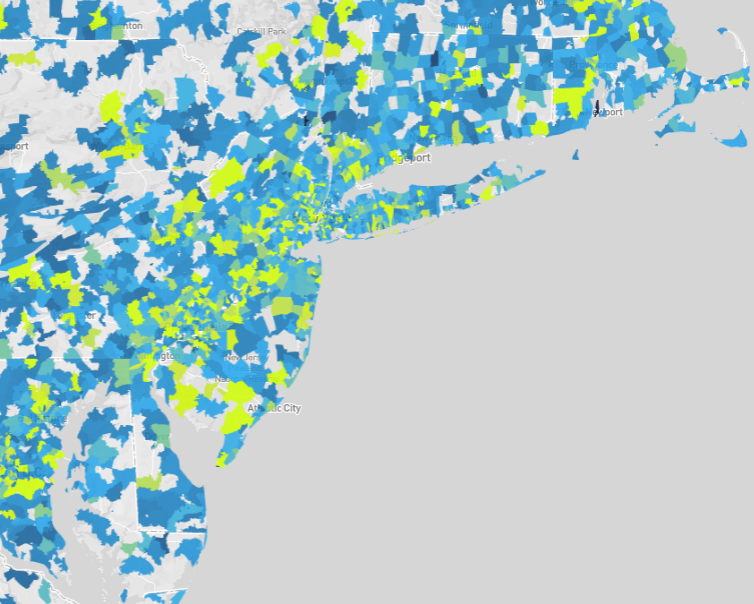
This tutorial introduces you to the [Polys Type](/apis-and-interfaces/vega/vega-reference-overview/marks-property#polys-type) marks, which uses an implicit polygon data table format. The visualization is a map of zip codes color-coded according to average contribution amount. The data table encodes polygons representing zip code areas.
See the [Poly Map with Backend Rendering](https://omnisci.github.io/mapd-charting/example/example3.html) charting example for a programmatic rendering of this visualization.
The following data property extracts the average contribution amount from the `contributions_donotmodify` data table, omitting rows that do not have a contribution amount:
```
"data": [
{
"name": "polys",
"format": "polys",
"sql": "SELECT zipcodes.rowid,AVG(contributions_donotmodify.amount) AS avgContrib FROM contributions_donotmodify,zipcodes WHERE contributions_donotmodify.amount IS NOT NULL AND contributions_donotmodify.contributor_zipcode = zipcodes.ZCTA5CE10 GROUP BY zipcodes.rowid ORDER BY avgContrib DESC"
}
]
```
When working with polygon data, the `"format": "polys"` property must be specified.
The `scales` specification scales `x` values to the visualization area width and `y` values to the height. A color scale, `polys_fillColor` is also specified that linearly scales nine contribution amount ranges to nine colors:
```
"scales": [
{
"name": "x",
"type": "linear",
"domain": [-19646150.75527339, 19646150.755273417],
"range": "width"
},
{
"name": "y",
"type": "linear",
"domain": [-3071257.58106188, 10078357.267122284],
"range": "height"
},
{
"name": "polys_fillColor",
"type": "linear",
"domain": [0, 325, 650, 975, 1300, 1625, 1950, 2275, 2600],
"range": ["#115f9a", "#1984c5", "#22a7f0", "#48b5c4", "#76c68f", "#a6d75b", "#c9e52f", "#d0ee11", "#d0f400"],
"default": "green"
}
]
```
Zip code areas for which average contribution amounts are not specified by the domain are color-coded green.
The `marks` property specifies visually encoding the data from the `polys` data table as polygons:
```
"marks": [
{
"type": "polys",
"from": { "data": "polys" },
... elided ...
}
}
]
```
Polygon `x` and `y` vertex locations are transformed to the visualization area using the `x` and `y` scales.
```
"marks": [
{
... elided ...
"properties": {
"x": {
"scale": "x",
"field": "x"
},
"y": {
"scale": "y",
"field": "y"
},
... elided ...
}
}
]
```
The `x` and `y` polygon vertex locations are implicitly encoded in the data table as described in [Polys Type](/apis-and-interfaces/vega/vega-reference-overview/marks-property#polys-type).
Polygon fill color color-codes the average contribution amount, `avgContrib`, linearly scaled by the `polys_fillColor` scale:
```
"marks": [
{
... elided ...
"properties": {
... elided ...
"fillColor": {
"scale": "polys_fillColor",
"field": "avgContrib"
},
... elided ...
}
}
]
```
Finally, the marks property specifies the polygon border width and color, and line join constraints:
```
"marks": [
{
... elided ...
"properties": {
... elided ...
"strokeColor": "white",
"strokeWidth": 0,
"lineJoin": "miter",
"miterLimit": 10
}
}
]
```
## Source Code
Working with Polys Tutorial Directory Structure
```
index.html
/js
browser-connector.js
vegaspec.js
vegademo.js
```
### HTML
Working with Polys Tutorial index.html
```
OmniSci
```
### JavaScript
Working with Polys Tutorial vegademo.js
```
function init() {
var vegaOptions = {}
var connector = new MapdCon()
.protocol("http")
.host("my.host.com")
.port("6273")
.dbName("omnisci")
.user("omnisci")
.password("changeme")
.connect(function(error, con) {
con.renderVega(1, JSON.stringify(exampleVega), vegaOptions, function(error, result) {
if (error) {
console.log(error.message);
}
else {
var blobUrl = `data:image/png;base64,${result.image}`
var body = document.querySelector('body')
var vegaImg = new Image()
vegaImg.src = blobUrl
body.append(vegaImg)
}
});
});
}
```
Working with Polys Tutorial vegaspec.js
```
const exampleVega = {
"width": 1004,
"height": 336,
"data": [
{
"name": "polys",
"format": "polys",
"sql": "SELECT zipcodes.rowid,AVG(contributions_donotmodify.amount) AS avgContrib FROM contributions_donotmodify,zipcodes WHERE contributions_donotmodify.amount IS NOT NULL AND contributions_donotmodify.contributor_zipcode = zipcodes.ZCTA5CE10 GROUP BY zipcodes.rowid ORDER BY avgContrib DESC"
}
],
"scales": [
{
"name": "x",
"type": "linear",
"domain": [
-19646150.75527339,
19646150.755273417
],
"range": "width"
},
{
"name": "y",
"type": "linear",
"domain": [
-3071257.58106188,
10078357.267122284
],
"range": "height"
},
{
"name": "polys_fillColor",
"type": "linear",
"domain": [
0, 325, 650, 975,
1300, 1625, 1950, 2275, 2600
],
"range": [
"#115f9a", "#1984c5", "#22a7f0", "#48b5c4",
"#76c68f", "#a6d75b", "#c9e52f", "#d0ee11", "#d0f400"
],
"default": "green",
"nullValue": "#CACACA"
}
],
"marks&quoquot;: [
{
"type": "polys",
"from": {
"data": "polys"
},
"properties": {
"x": {
"scale": "x",
"field": "x"
},
"y": {
"scale": "y",
"field": "y"
},
"fillColor": {
"scale": "polys_fillColor",
"field": "avgContrib"
},
"strokeColor": "white",
"strokeWidth": 0,
"lineJoin": "miter",
"miterLimit": 10
}
}
]
};
```