***
description: >-
Cross-link provides a no code interface for you to link two datasources by one
or multiple columns. Immerse can then automatically crossfilter between
datasources using cross-links.
------------------------------
# Using Cross-link
Cross-links or Joins
* A join is a new datasource that performs a SQL join. Columns from both tables can be queried and used in one or many charts.
* A cross-link pertains only to filtering. By specifying cross-linked columns, you can automatically apply filters applied to one dataset, to another.
## Managing cross-links
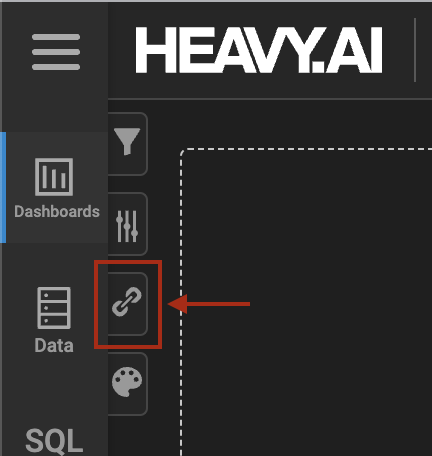
Begin by selecting the cross-link tab in the dashboard view
### 
### Create a cross-link
To create a cross-link, select the "Setup cross-link" button.
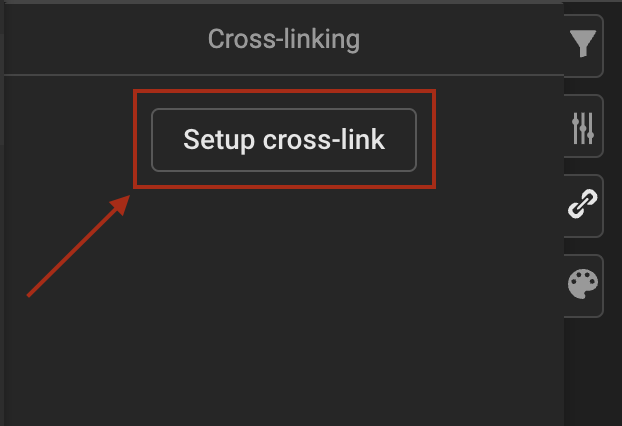
This opens the cross-link creation form
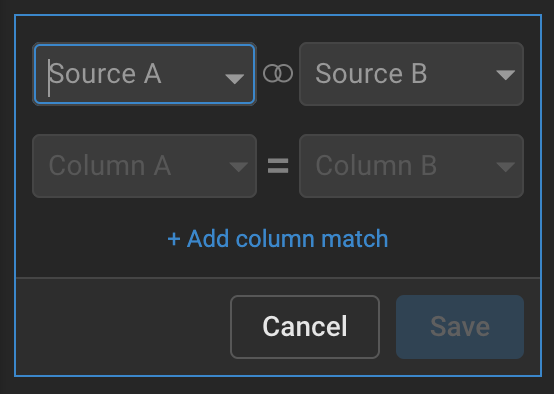
The components of a cross-link are exactly two datasources and one or more sets of columns from each datasource to link. Click "Save" to save and apply the crosslink to the current dashboard.
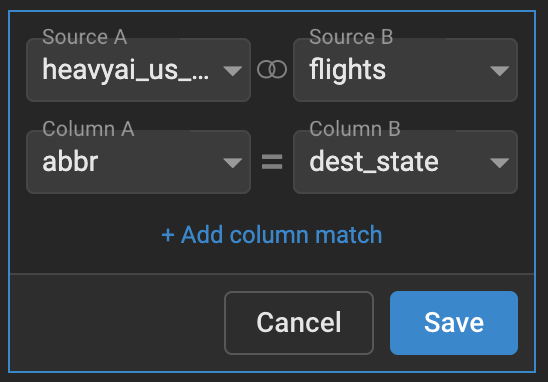
In the above scenario a crosslink is setup between the datasource `heavyai_us_states,`column `abbr` and datasource `flights`, column `dest_state`. This means that if you crossfilter a chart that uses datasource `heavyai_us_states` immerse will automatically crossfilter any charts that use the `flights` table to contain only records where `dest_state` matches the `abbr` column from the filtered `heavyai_us_states` chart.
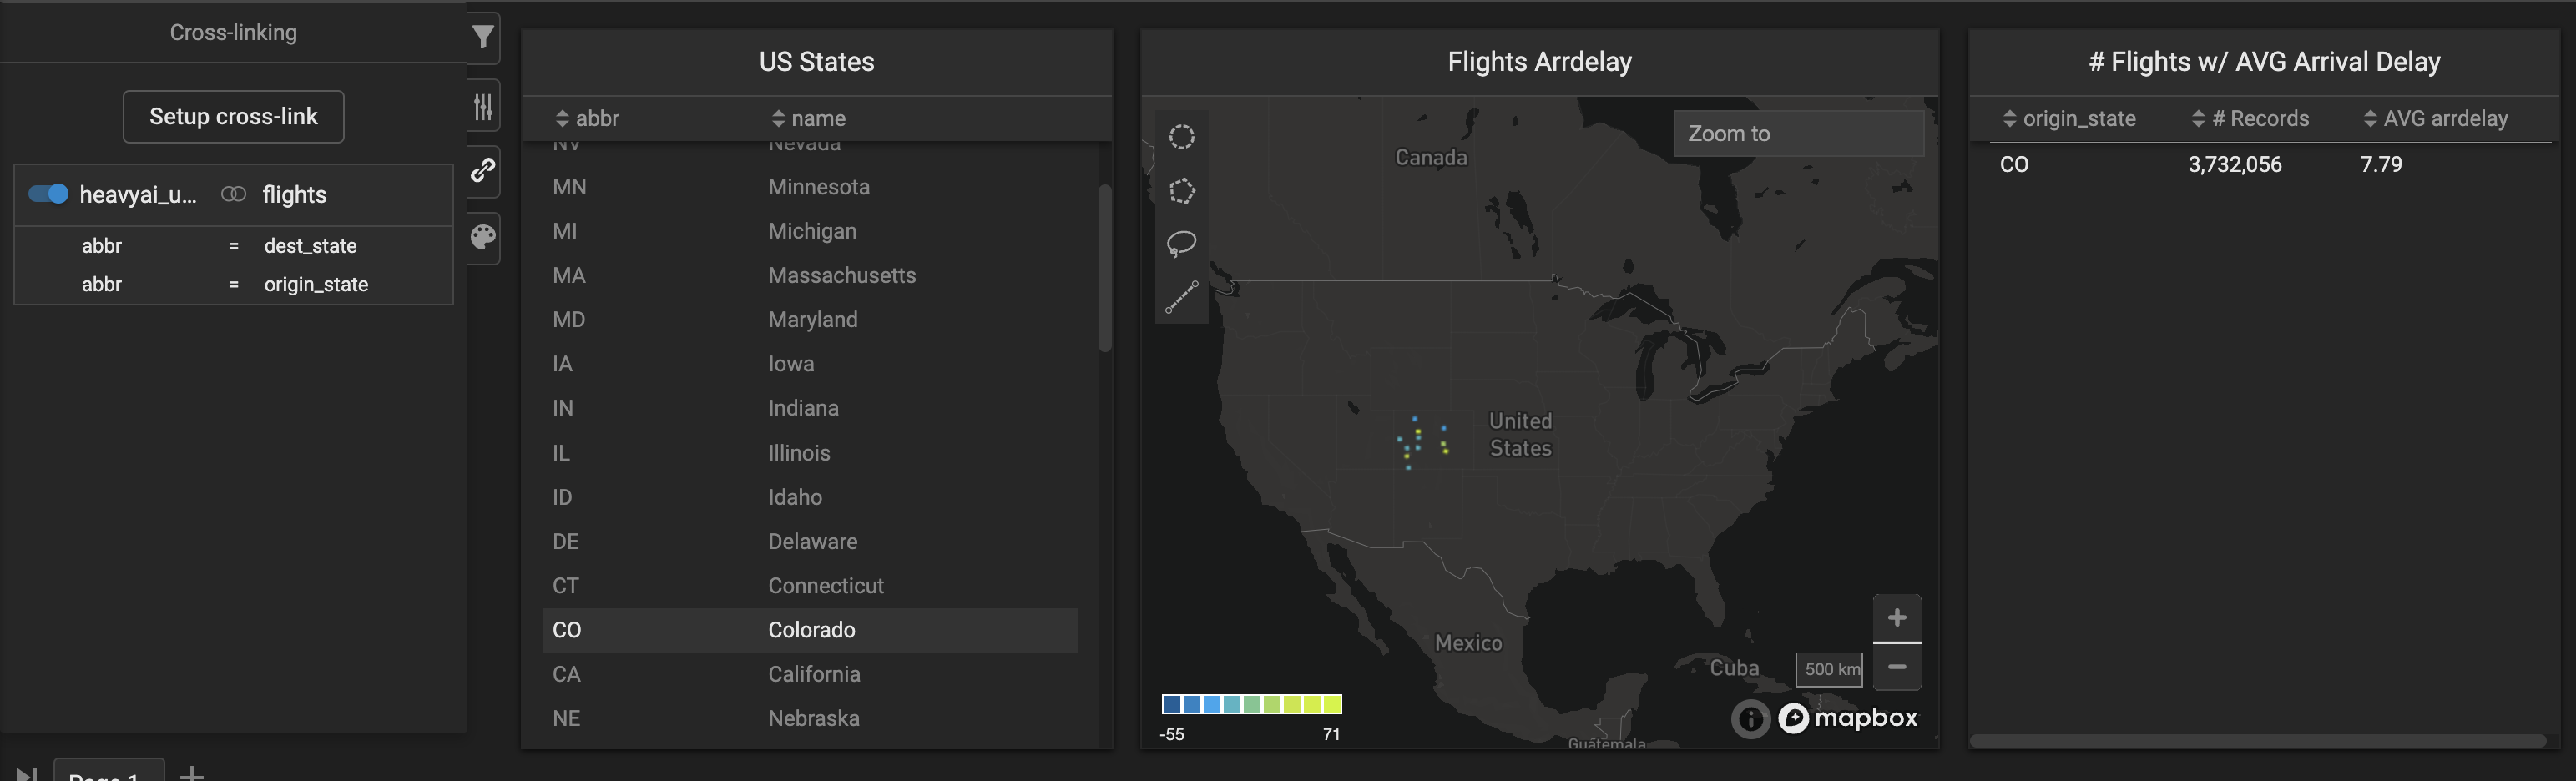
In the full example below, a crosslink is setup as described above. The `US States` chart is crossfiltering to records only containing the `abbr` of `CO`. On the right are two charts showing flight data in a point map and in a table grouped by state. Because of the cross-link, these two charts are only showing records with a `dest_state` that equals `CO`.
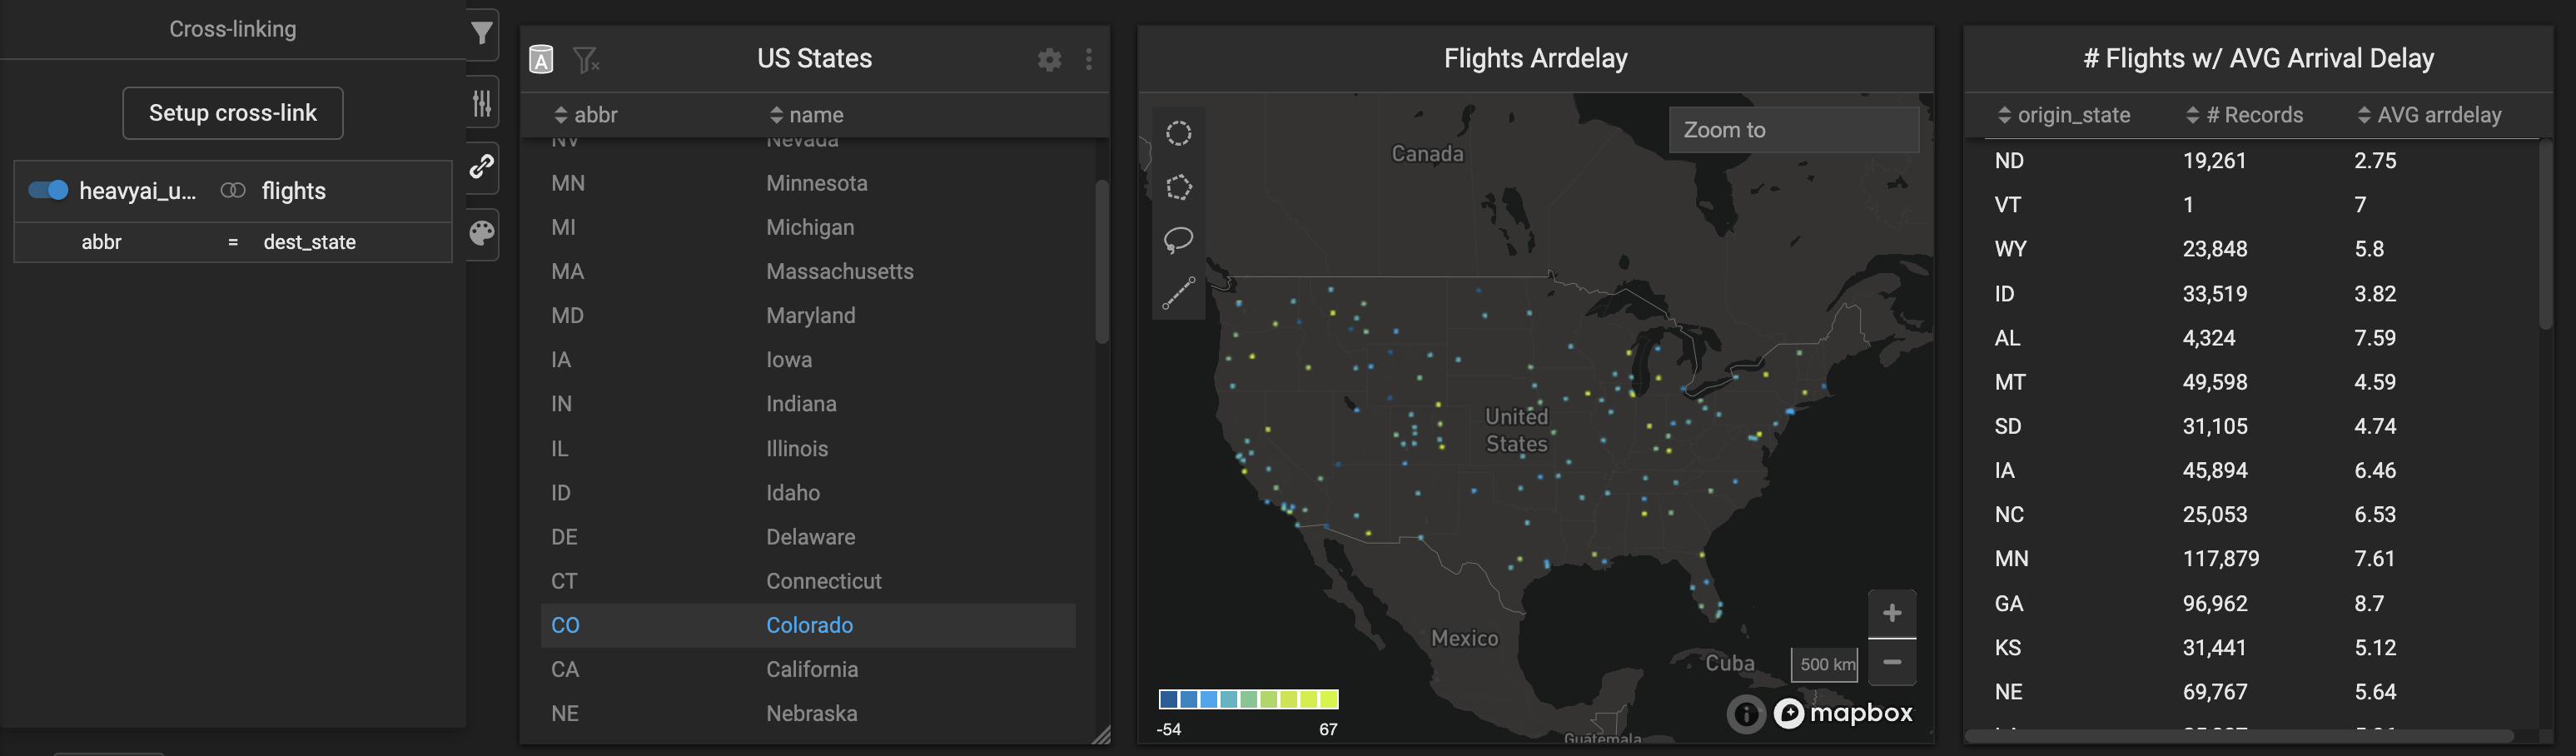
**Note:** Cross-links go both ways, so in our example if I filter `heavyai_us_states` by an `abbr` of `CO` it will filter the flights table by a `dest_state` of `CO`, but if I filter `flights` by a `dest_state` of `CO` it will also filter the `heavyai_us_states` chart by an `abbr` of `CO.`
### Editing a cross-link
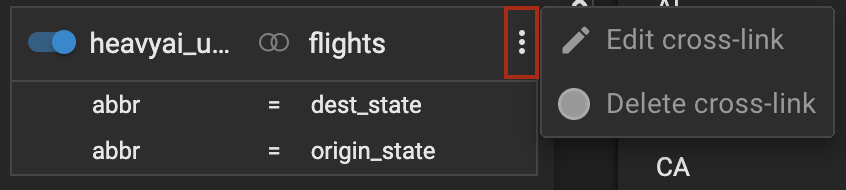
Once a cross-link is saved, you can access other actions like "Edit a cross-link" by selecting the ellipses in the upper right corner, which appear on hover.
From here you can select Edit or Delete actions. Selecting edit will enable edit mode where you can select datasources and update or add columns. You have the option to Save or Cancel your changes.
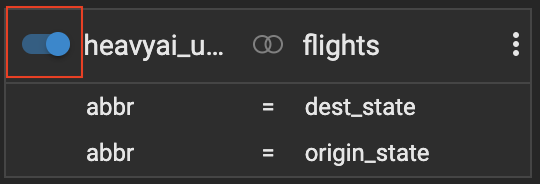
 You can toggle cross-links on and off using the toggle switch in the upper left corner.
## Advanced Usage
For more complex use cases you can set up multiple cross-links or create cross-links with multiple sets of columns
### Multiple cross-links
If you have many datasources in a dashboard, you can also setup multiple cross-links between them.
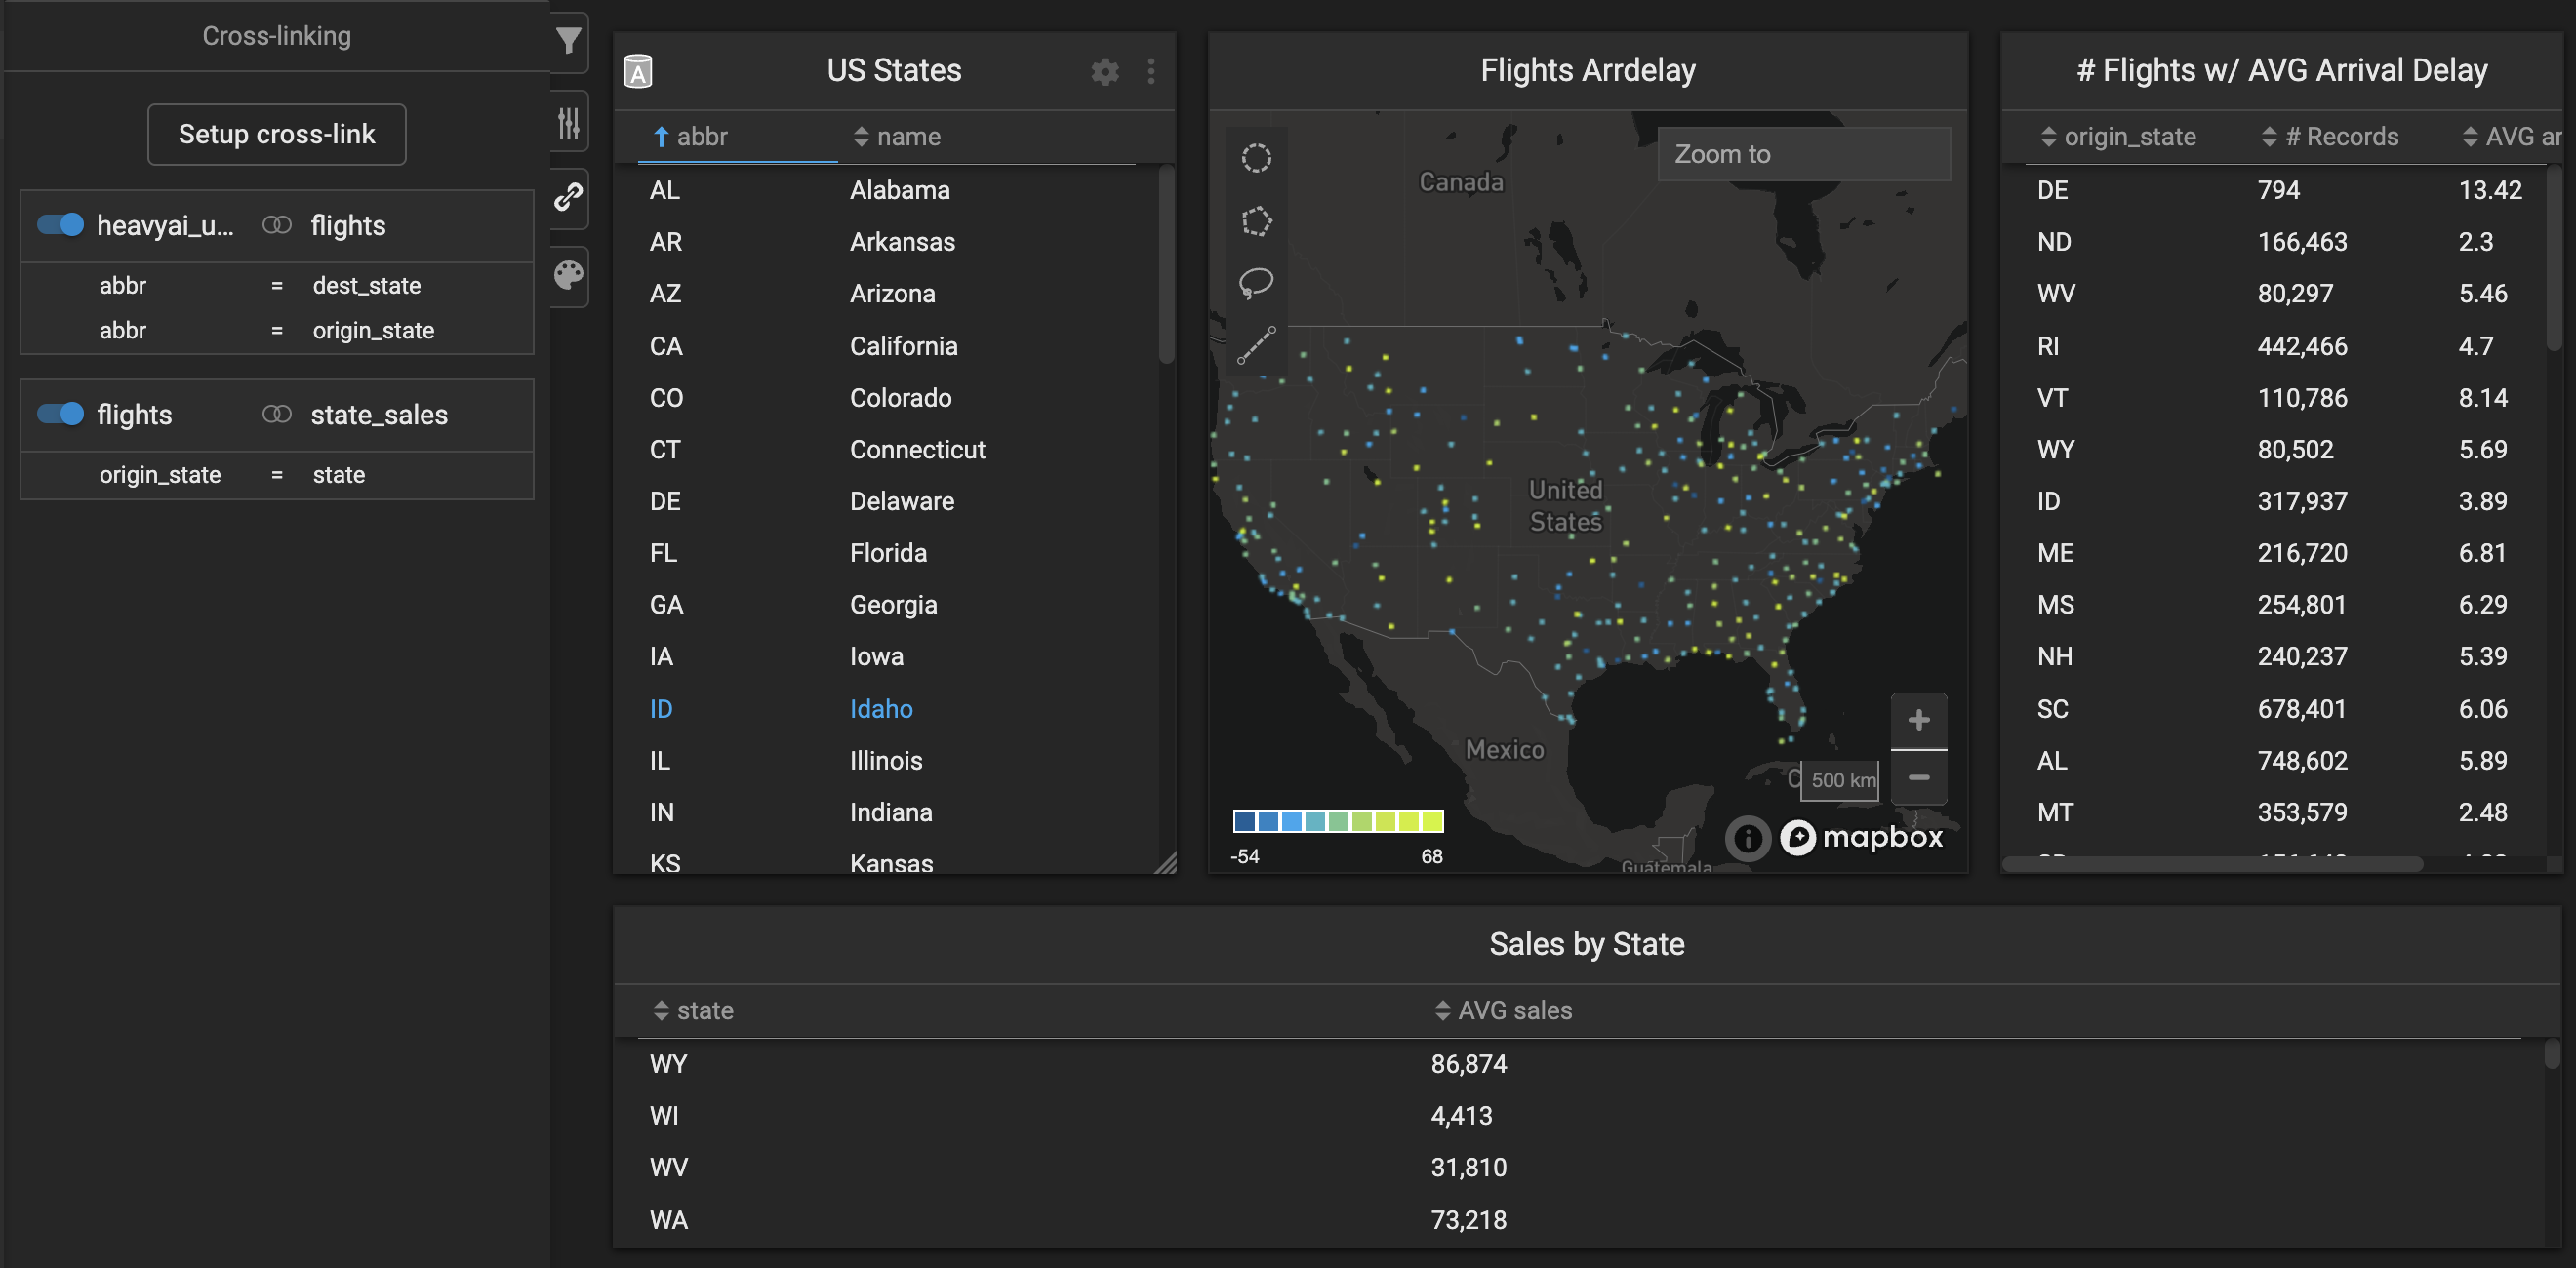
In the above dashboard we have added a chart with a third datasource `sales` and setup a cross-link between the `origin_state` of the `flights` table with the `state`column of the `sales` table.
**Scenario 1:** Selecting "CO" of the US States chart
In this scenario the two charts that use the `flights` table will be filtered by `dest_state` and `origin_state` equal to `CO` but the Sales by State table will not also be filtered by `state` equals `CO`.
**Scenario 2:** Selecting the row with `origin_state` of `CO` in the "# Flights" chart
In this scenario both the Sales by State and US States tables will be filtered, because there is a crosslink setup between the `flights` table and both the `heavyai_us_states` and the `sales` tables.
Cross-links do not chain. The above scenario only works because the `flights` table is being filtered, which is cross-linked to both other tables. Filtering `heavyai_us_states` for example would not filter `flights` AND `state_sales`, it would only filter the flights table
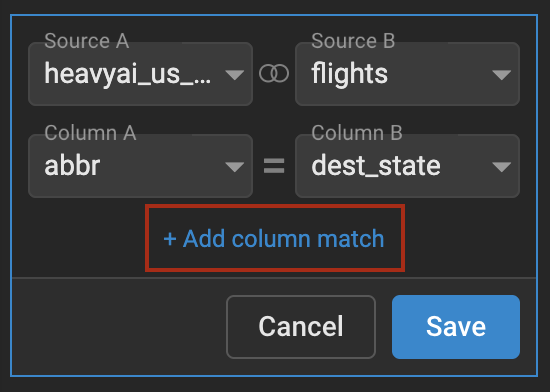
### Multiple Column Match
To add additional sets of columns to cross-link on, click the "Add column match" link when editing a cross-link.
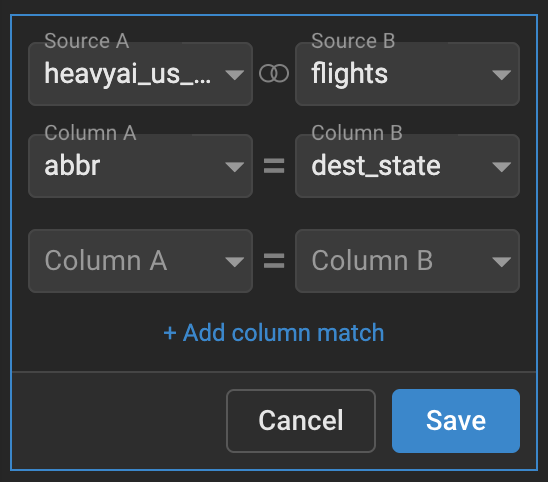
This will add an additional row of columns, where you can select an additional column to link.
In our example, if we wanted the `CO` crossfilter to filter both `dest_state` *and* `origin_state` we could add an additional column match for this.
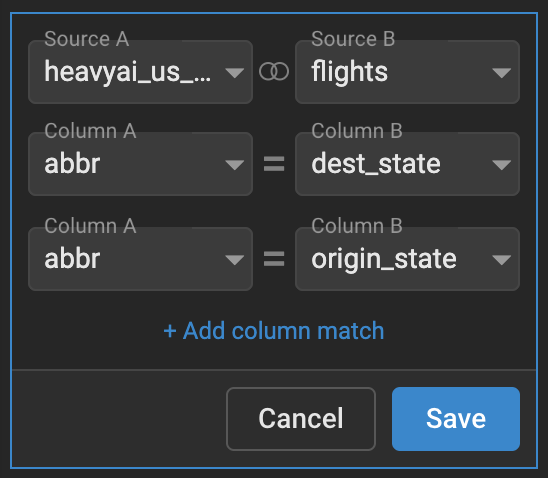
Now if we filter `heavy_ai_states` by an `abbr` of `CO`, Immerse will only show us flights that departed *and* landed in Colorado in the charts that use the `flights` datasource.
You can add as many column matches as you would like.
##
You can toggle cross-links on and off using the toggle switch in the upper left corner.

## Advanced Usage
For more complex use cases you can set up multiple cross-links or create cross-links with multiple sets of columns
### Multiple cross-links
If you have many datasources in a dashboard, you can also setup multiple cross-links between them.

In the above dashboard we have added a chart with a third datasource `sales` and setup a cross-link between the `origin_state` of the `flights` table with the `state`column of the `sales` table.
**Scenario 1:** Selecting "CO" of the US States chart
In this scenario the two charts that use the `flights` table will be filtered by `dest_state` and `origin_state` equal to `CO` but the Sales by State table will not also be filtered by `state` equals `CO`.
**Scenario 2:** Selecting the row with `origin_state` of `CO` in the "# Flights" chart
In this scenario both the Sales by State and US States tables will be filtered, because there is a crosslink setup between the `flights` table and both the `heavyai_us_states` and the `sales` tables.
Cross-links do not chain. The above scenario only works because the `flights` table is being filtered, which is cross-linked to both other tables. Filtering `heavyai_us_states` for example would not filter `flights` AND `state_sales`, it would only filter the flights table
### Multiple Column Match
To add additional sets of columns to cross-link on, click the "Add column match" link when editing a cross-link.

This will add an additional row of columns, where you can select an additional column to link.

In our example, if we wanted the `CO` crossfilter to filter both `dest_state` *and* `origin_state` we could add an additional column match for this.

Now if we filter `heavy_ai_states` by an `abbr` of `CO`, Immerse will only show us flights that departed *and* landed in Colorado in the charts that use the `flights` datasource.

You can add as many column matches as you would like.
##