Getting Started
Overview
This guide helps you get familiar with the following:
Installing and running Graph Composer.
Load and run pre-built graphs.
Create your own graphs.
We will start by first setting up the system and explain the basic layout of the Composer. Then, we will load, understand, and run a simple application. This will provide an understanding of how the Composer works.
Finally, we will create a simple application without writing a single line of code.
Installation
System Requirements
The table below lists the system requirements for Graph Composer Global Access (GA) release:
Platform |
x86_64, Jetson 1 |
OS |
Ubuntu 20.04, Windows 10 2 |
Python |
3.8 |
CUDA |
11.6 (for x86_64), 11.4 (for Jetson) |
GPU |
CUDA-capable GPU, iGPU 2,3 |
DeepStream SDK |
6.1 (for DeepStream extensions) |
Docker |
>=19.03.3 |
1 As remote execution target only
2 (Alpha) With remote execution only
3 (Alpha) Need Vulkan support (Intel Iris Graphics 540 or later)
Installing the Composer
The Graph Composer has separate packages for x86_64 and Jetson. These packages contains the following tools:
Tool
x86_64
Jetson
Registry
2.0.0
2.0.0
Composer
2.0.0
NA
Container Builder
2.0.0
NA
Graph Execution Engine
2.4.2
2.4.2
Download Graph Composer Debian package for x86 from [here] and Graph runtime for ARM from [here]
Graph development is currently supported only on x86. Graph Composer package for arm64 can be used to deploy or execute graph on Jetson:
x86_64:
graph_composer-2.0.0_amd64.deb
aarch64:
graph_composer-2.0.0_arm64.deb
Install the package:
sudo dpkg -i graph-composer-2.0.0-<arch>.deb
This command will install all tools in the
/opt/nvidia/graph-composerdirectory with links to tools in/usr/bindirectory. You can access the tools without switching to the installation directory.
After installation, check if the installation was successful using the following commands in a terminal:
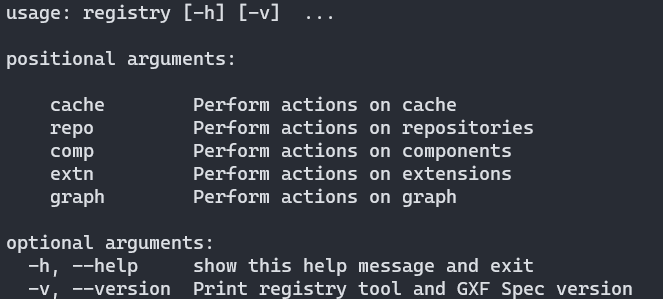
registry --help Output should look similar to the following:
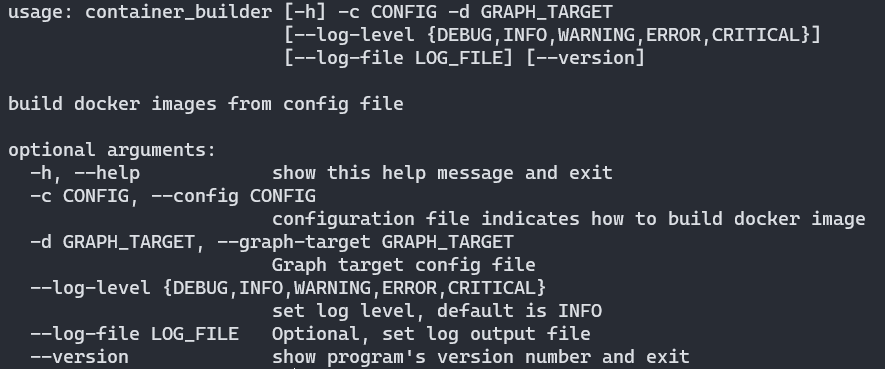
container_builder --help Output should look similar to the following:
If you still don’t see the components, check the FAQ section.
Note that GXF is installed as a part of the Graph Composer installation described above.
Installing the Composer on Windows
Download Graph Composer Windows Installer from [here]
On Windows, Graph Composer can be installed with graph_composer_installer.exe.
By default, it installs on C:\Program Files (x86)\NVIDIA Corporation\Graph Composer\. You can always choose to select a different directory.
It can be launched from the installtion directory by running composer.exe
Installer also creates Desktop shortcut and Start Menu shortcut with the name Graph Composer
Please note it will need administrative permissions to run the Composer.
Getting Started with the Composer
To run the Graph Composer, run the command:
composer
This will open the following window:
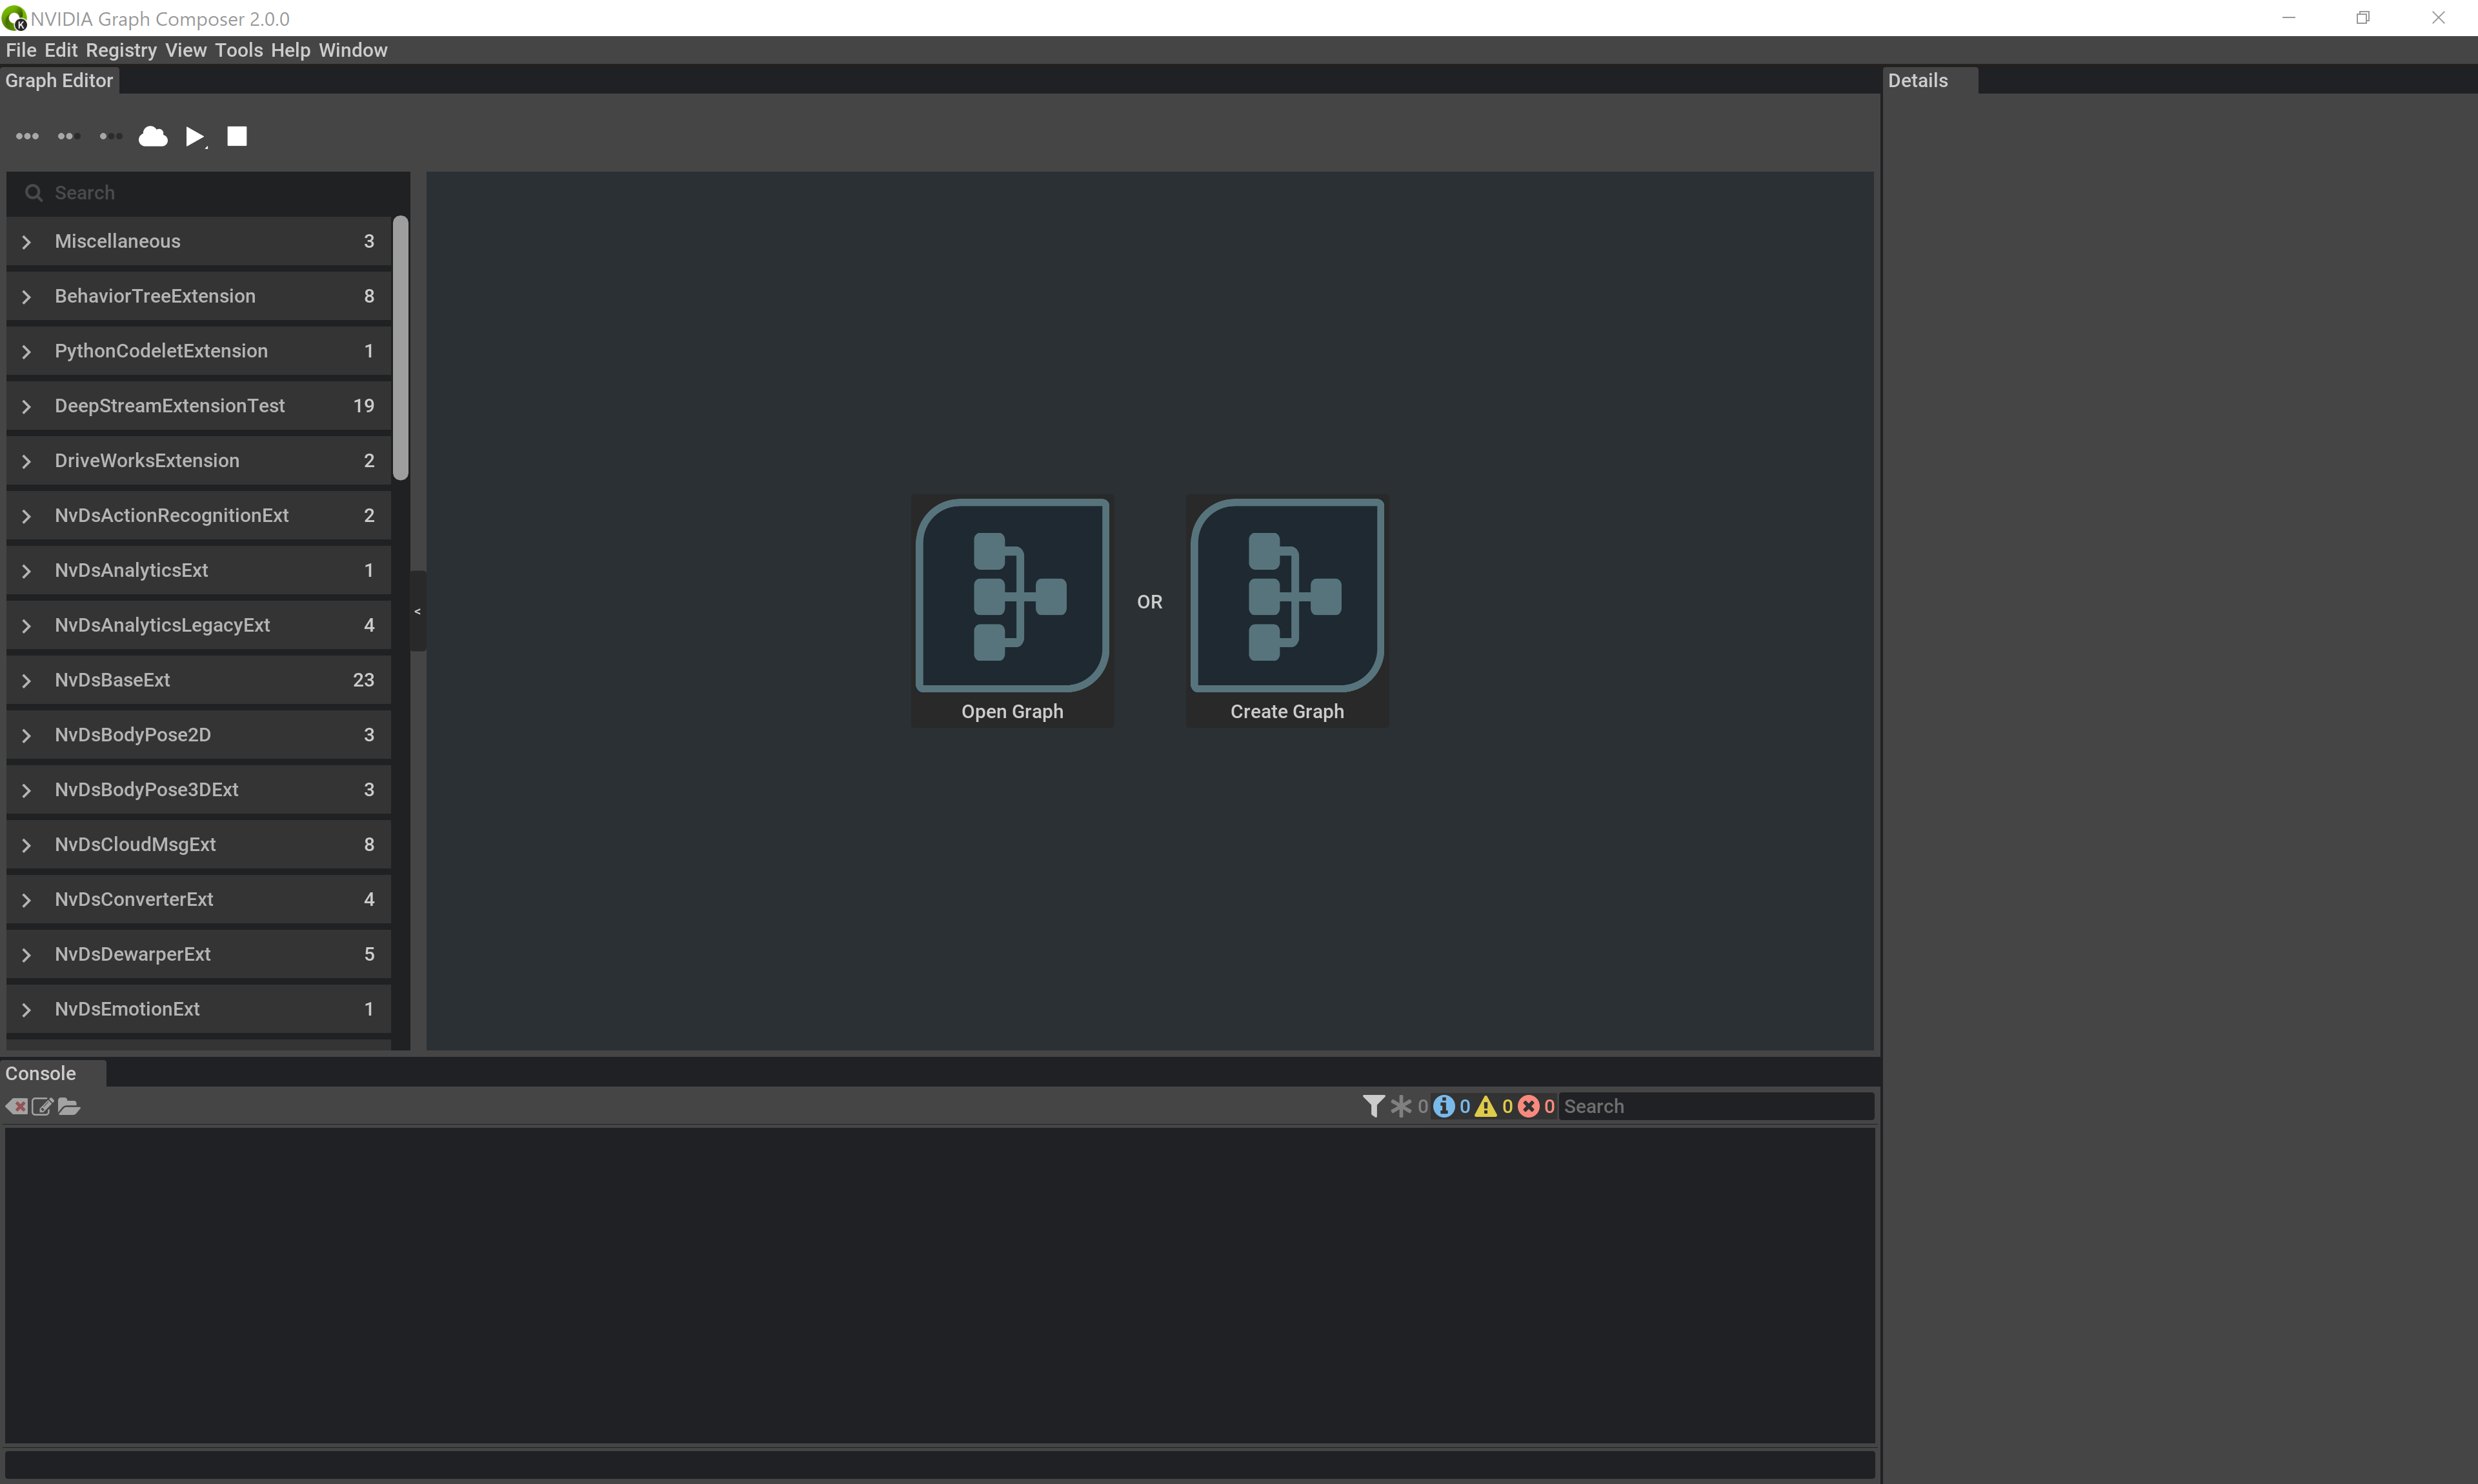
In the panel on the left, you should see components listed which are picked up from your registry. If you don’t see any components that means registry is not synced.
You can sync the registry by using the Registry menu.
After syncing the registry, you should see all the components listed.
You can read more about registry in Registry and about the related commands in Registry Command Line Interface
Loading and Running an existing Graph
Loading an existing Graph
Before we build our own graph, let’s first run a sample graph.
Download the reference graph package and install it using the command:
dpkg -i deepstream-reference-graphs-6.1.deb. This will install sample graphs and their required file in /opt/nvidia/deepstream/reference-graphs.
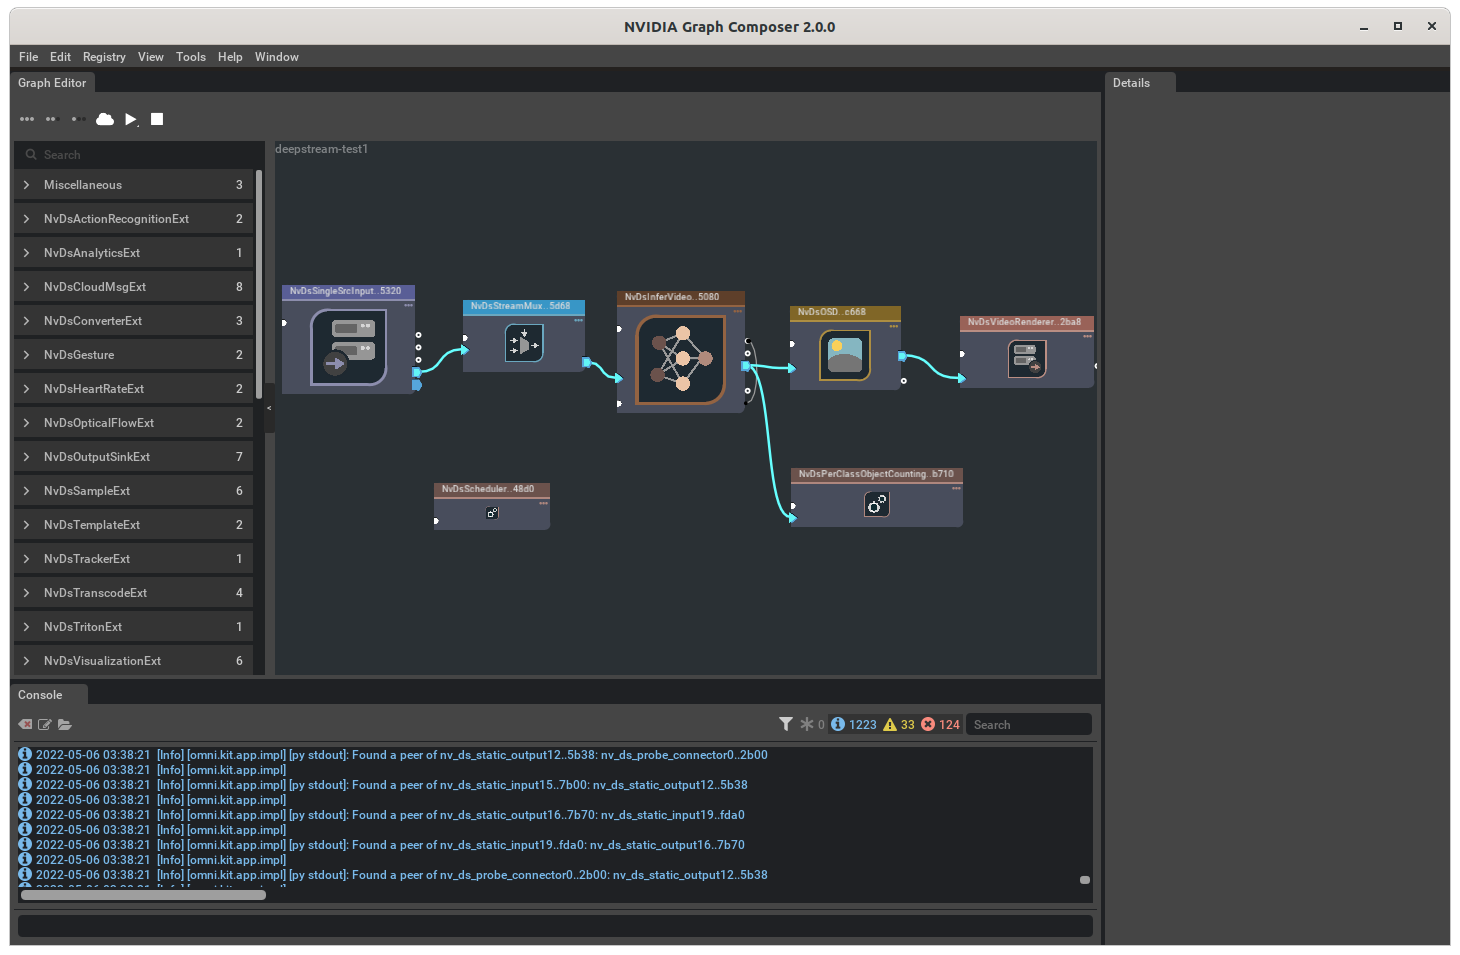
From your composer window, open /opt/nvidia/deepstream/deepstream-6.1/reference_graphs/deepstream-test1/deepstream-test1.yaml from Files -> Open Graph. This will open all the components in the Graph Editor Window.
You should be able to see all the components and how they are connected to each other.
The window will look something like:
Running a Graph
To run a graph click on the Play button on the left panel. This will open a dialog where you can choose a graph file and the targer config file /opt/nvidia/deepstream/deepstream-6.1/reference_graphs/common/target_<arch>.yaml.
Optionally, you can also specify the details of a remote machine where you might want to run this graph. Once all the details are filled, click on Run. This will execute the graph and you can see the output in an external terminal.
Creating a Graph
Now, let’s create a simple graph and run it. For this example we will create a simple Ping Graph using components present in the Sample Extension and Standard Extension. In this Ping Graph, we simply send a message from one entity to another periodically. It uses the following components:
- Transmitter:
DoubleBufferTransmitter- This is a queue which is holds a message being transmitted.
PingTx- This component creates and publishes a message every time it’s executed.
PeriodicSchedulingTerm- Scheduling Terms determine when to execute an entity in this case Transmitter. PeriodicSchedulingTerm is used to execute entities periodically.
CountSchedulingTerm- CountSchedulingTerm is used to stop the execution after a certain count.
- Receiver:
DoubleBufferReceiver- This is a queue which hold the messages sent by other components.
PingRx- This component receives a message on DoubleBufferReceiver every time it’s executed.
MessageAvailableSchedulingTerm- This Scheduling Term determines if a new message has arrived.
- Scheduler:
GreedyScheduler- Scheduler determines the order in which components are executed. GreedyScheduler is a simple single-threaded scheduler which executes components one after another.
ManualClock- A clock used by Scheduler to track time.
Follow the steps:
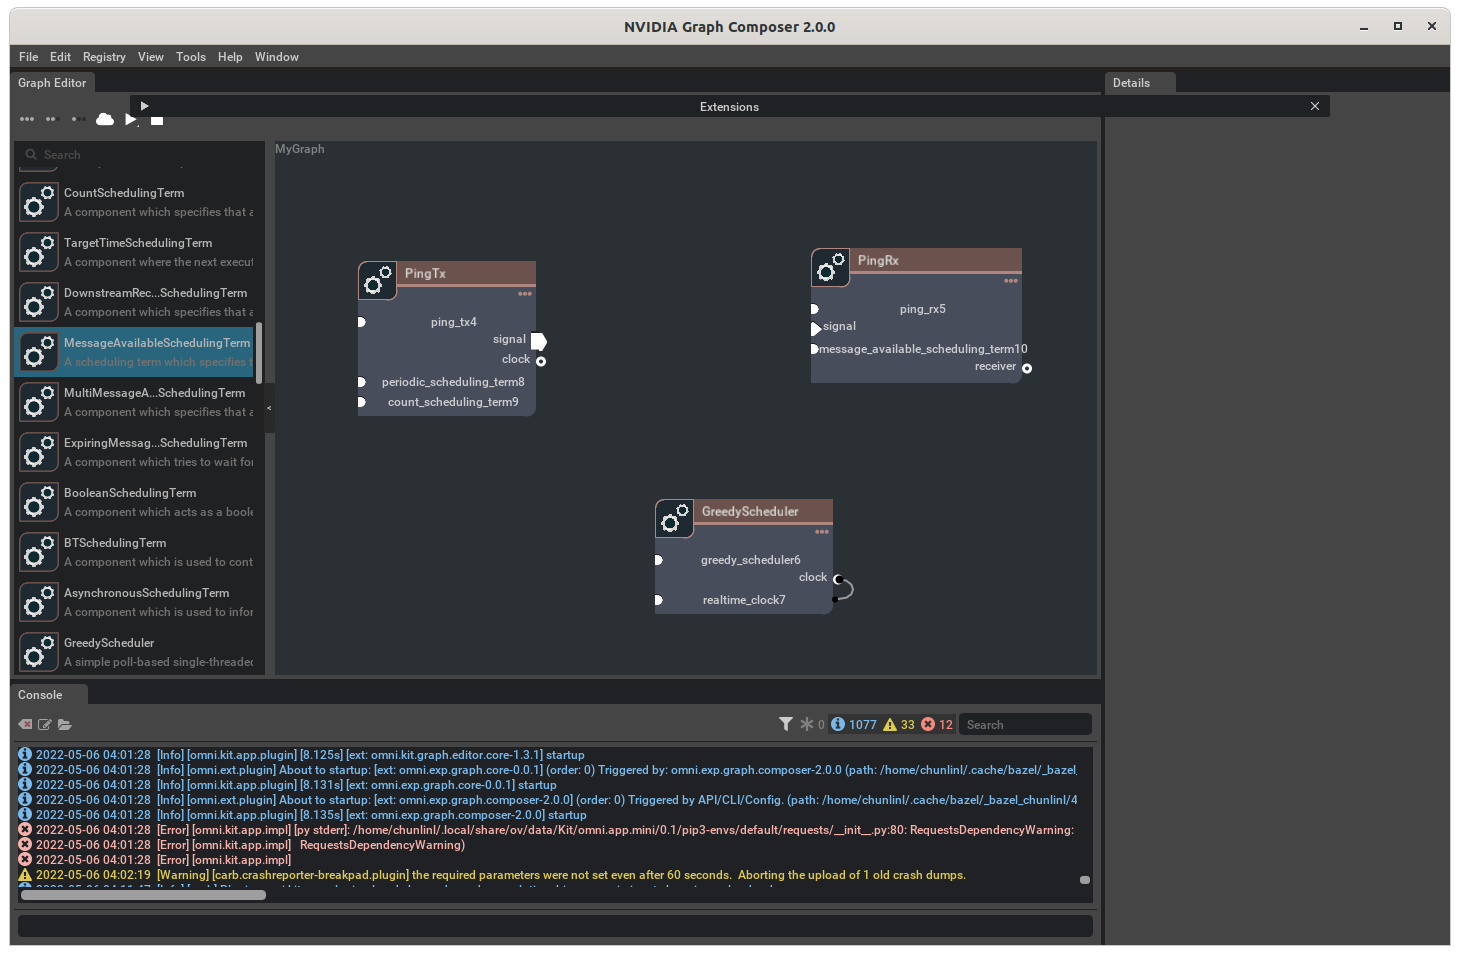
Add PingTx, PingRx and GreedyScheduler by dragging and dropping them from the components panel the graph window.
Add the rest of the components such as CountSchedulingTerm, PeriodicSchedulingTerm and MessageAvailableSchedulingTerm by dragging and dropping into the respective entity.
Now, right click on the signal in PingTx and click Create DoubleBufferTransmitter. Follow the same steps for PingRx’s signal and GreedyScheduler’s clock.
We can create a graph by simply dragging and dropping components from the Component Panel and add more components to it.
After adding the components your graph will look like the image below:
Now we make connections between components. For instance, you will have to connect a DoubleBufferTransmitter to a DoubleBufferReceiver to pass messages between them. PingTx/clock needs to be linked to GreedyScheduler/ManualClock. These connections are made by creating an edge between the components as shown below:
Finally, we have to set the required parameters for the components:
In
PingRx/MessageAvailableSchedulingTerm: set min_size to1In
PingTx/CountSchedulingTerm: set count to5In
PingTx/PeriodicSchedulingTerm: set recess_period to5
Now you can save the graph using File -> Save Graph (as). This will create a yaml file with all the components and the connections.
Finally, we can run this graph following the steps in Running a Graph section. Once you run the graph you will see the output in the terminal where you can see five messages being sent and received.