

Connecting to NVIDIA Mission Control autonomous hardware recovery#
NVIDIA Mission Control autonomous hardware recovery’s authentication relies on BCM’s LDAP authentication so that users will leverage their BCM credentials to login to NVIDIA Mission Control autonomous hardware recovery.
Upon successful authentication, the user session receives a short lived JWT and refresh token. The JWT is used for identity and refreshed by the UI at expiration time.
An administrator can opt to manage users and groups using BCM. Any changes will automatically be reflected within NVIDIA Mission Control autonomous hardware recovery. There are two options to access NVIDIA Mission Control autonomous hardware recovery. The first option is to authenticate using SSO with BCM identity. The other option is to go to the url for the NVIDIA Mission Control autonomous hardware recovery UI. You will be presented with a login screen.
Login screen
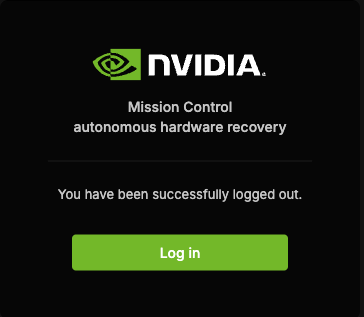
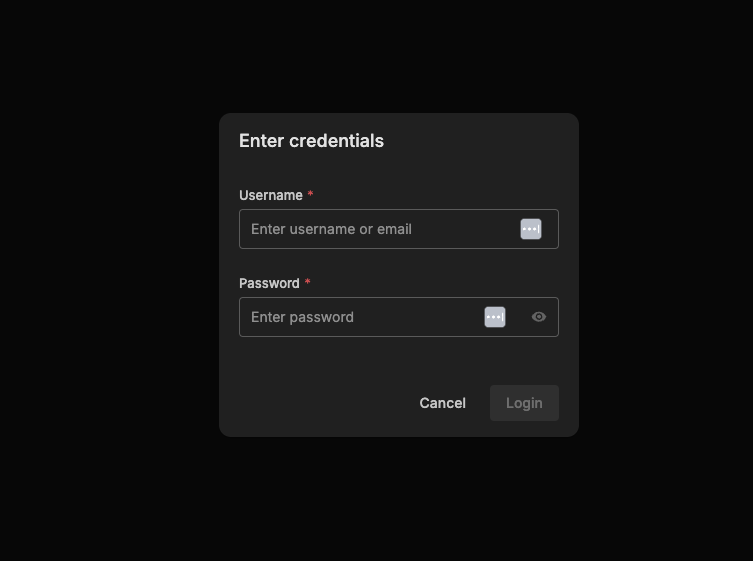
Once you click the login button, the authentication page appears where you can enter credentials.
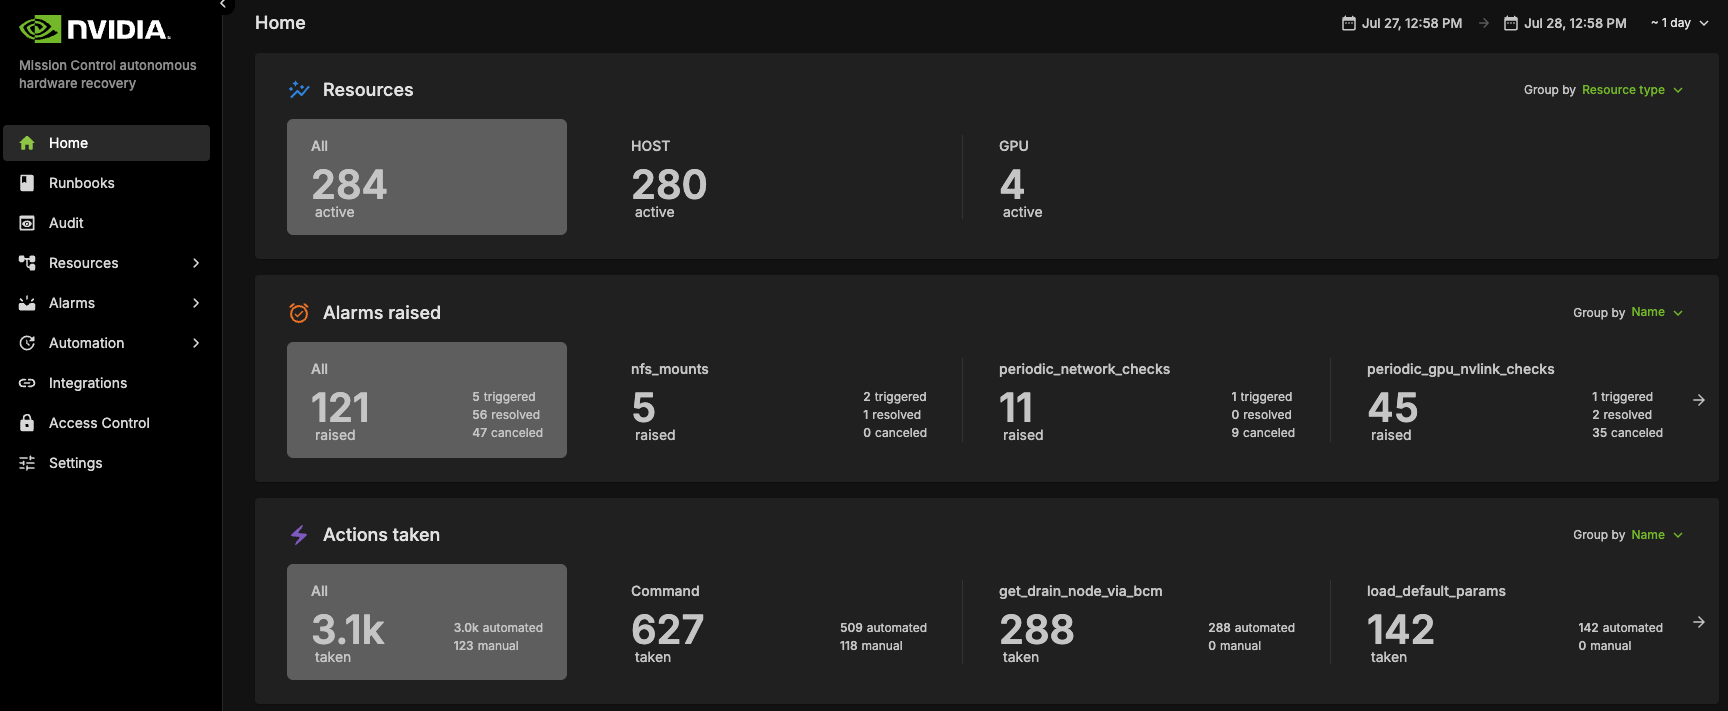
Main landing page
Users are authorized to perform different operations within NVIDIA Mission Control autonomous hardware recovery by configuring permission policies. Policies determine if the user can view resources and execute actions (named and/or anonymous). Action execution can be limited to a maximum number of impacted resources and / or specific resources. Permissions can also be attached to runbooks to allow / disallow certain users or groups. Please refer to documentation on Access Control for additional details.
New users are first created in BCM before they are able to access NVIDIA Mission Control autonomous hardware recovery. Upon logging in, there is a default permission policy that every user is assigned. The permissions of this policy are determined by the administrator. The administrator role has permission to perform any action in NVIDIA Mission Control autonomous hardware recovery. The configurator role has the permission to create, edit, delete any artifacts in NVIDIA Mission Control autonomous hardware recovery. By default, new users are granted administer and configure roles until the privileges are overridden. Defaults can be modified in the Access Control section of the NVIDIA Mission Control autonomous hardware recovery UI.
GB300#
Automated Baseline Testing with NVIDIA Mission Control autonomous hardware recovery#
Introduction#
The NVIDIA Mission Control autonomous hardware recovery portal enables efficient automation of baseline testing procedures. This comprehensive testing framework can be flexibly executed across various scales of infrastructure, from individual compute nodes to complete racks or multiple rack configurations. The system performs extensive validation of critical compute node components, including CPU/GPU/Memory/storage functionality, network connectivity, and firmware versioning. Additionally, it incorporates industry-standard performance benchmarking tools such as HPL, NCCL, and Nemotron(Large Language Model) to assess system capabilities. This streamlined approach significantly enhances both testing efficiency and thoroughness while reducing execution time.
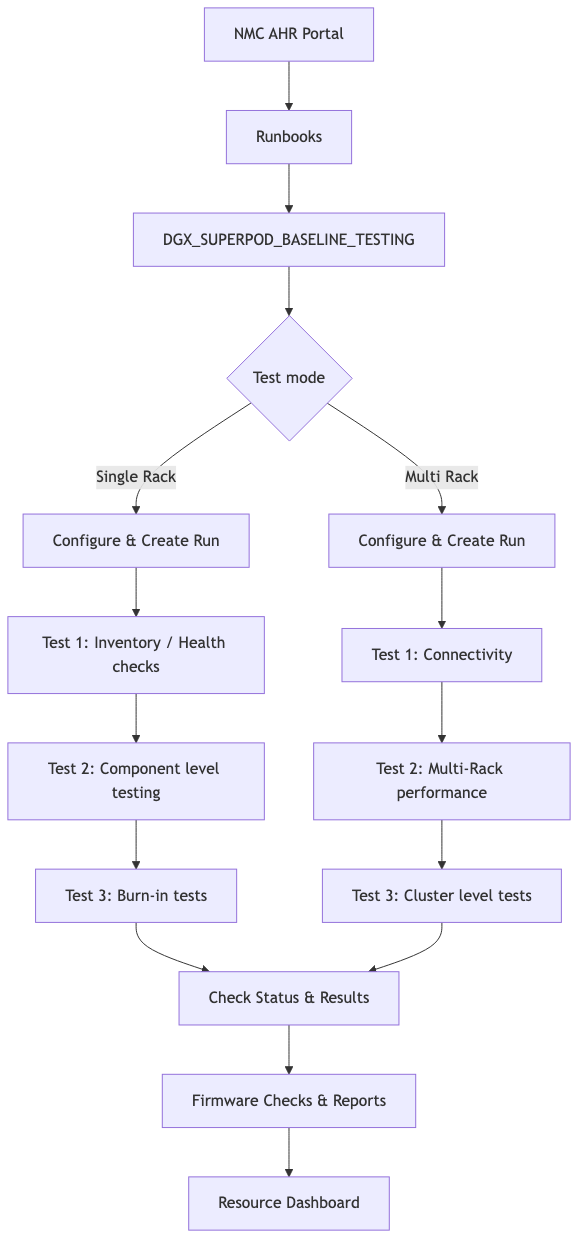
Entrypoint of Automated Testing#
A centralized automated baseline testing interface has been established to facilitate streamlined test execution and management. This unified entry point provides comprehensive access to the testing framework, enabling efficient navigation and one click implementation of all testing procedures.
To access the baseline testing interface:
Access the NVIDIA Mission Control autonomous hardware recovery portal using your credentials and navigate to the Runbooks section.
Locate the “DGX_SUPERPOD_BASELINE_TESTING” runbook through the search functionality (reference the interface depicted following)
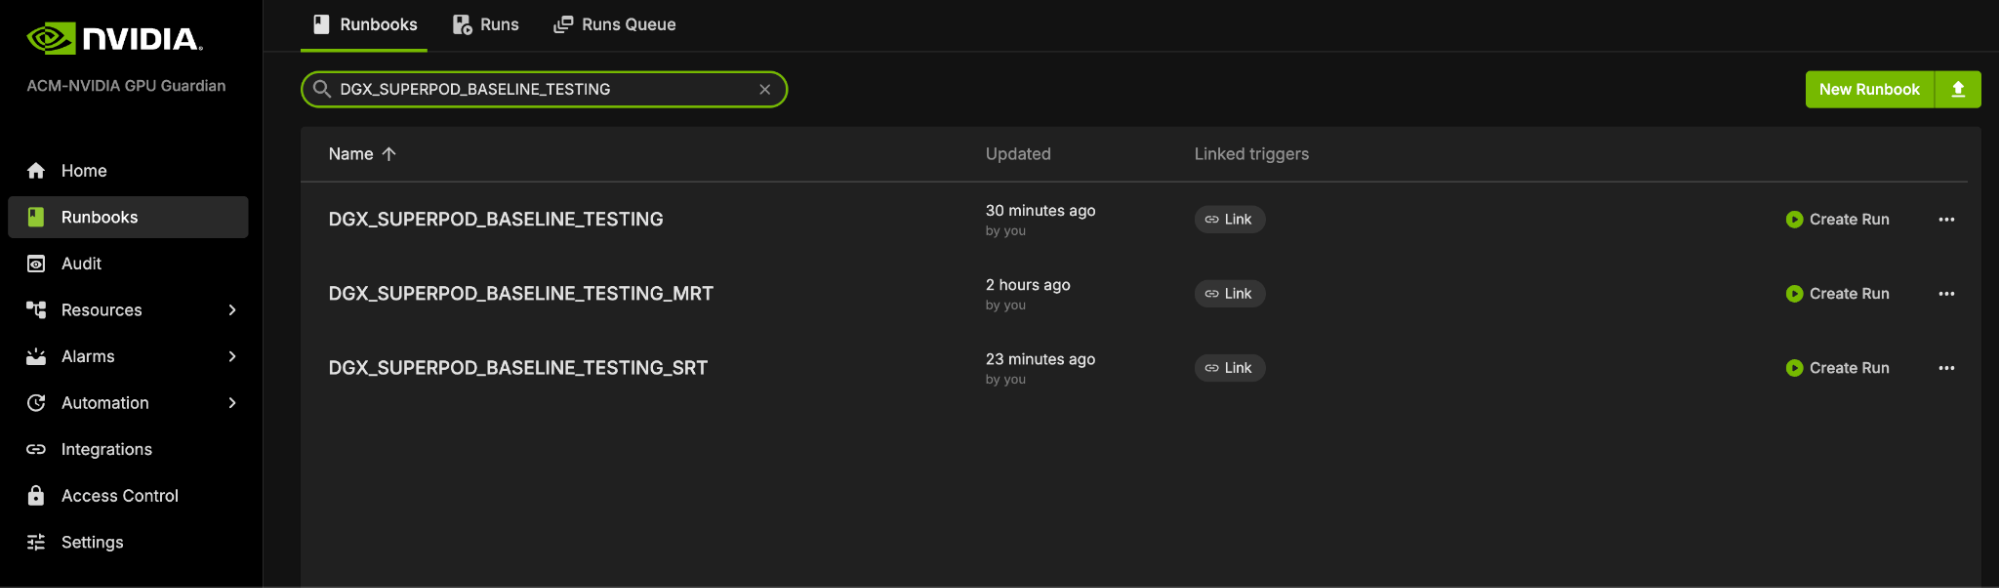
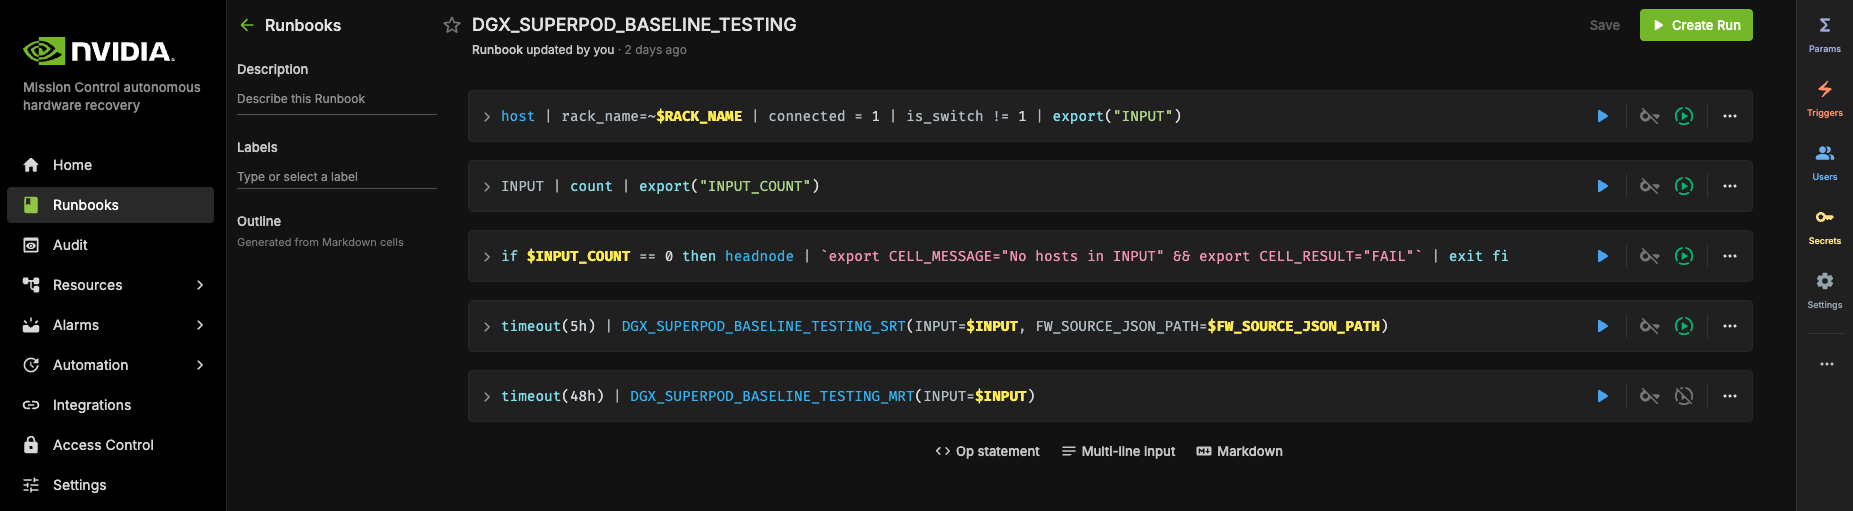
Upon selecting the “DGX_SUPERPOD_BASELINE_TESTING” runbook, you will be presented with the following interface. The subsequent sections of this documentation will provide detailed guidance on executing various testing procedures.
Run SRT (Single Rack Testing) Job#
Guide to Initiating Baseline Testing Procedures for Single Rack Configuration when one or multiple racks are ready for testing.
Navigate to the “DGX_SUPERPOD_BASELINE_TESTING” runbook utilizing the previously outlined navigation protocol.
Ensure the “DGX_SUPERPOD_BASELINE_TESTING_SRT” component is activated by toggling its switch control. This control is located on the right side of its immediate group of interface icons. The switch indicator in its default deactivated state should be visually distinct from the activated state. Note: When activated, the switch indicator displays as a green circle with a play icon.
Verify that the “DGX_SUPERPOD_BASELINE_TESTING_MRT” component is in its deactivated state. This deactivated state is indicated by its corresponding switch control displaying as a grey circular icon containing a muted play symbol, signifying it is ‘Off’.
Select the “Save” button positioned in the top right corner of the interface to preserve your settings.
Upon successful completion of these preliminary steps, your runbook configuration should reflect the specified parameters as illustrated below.
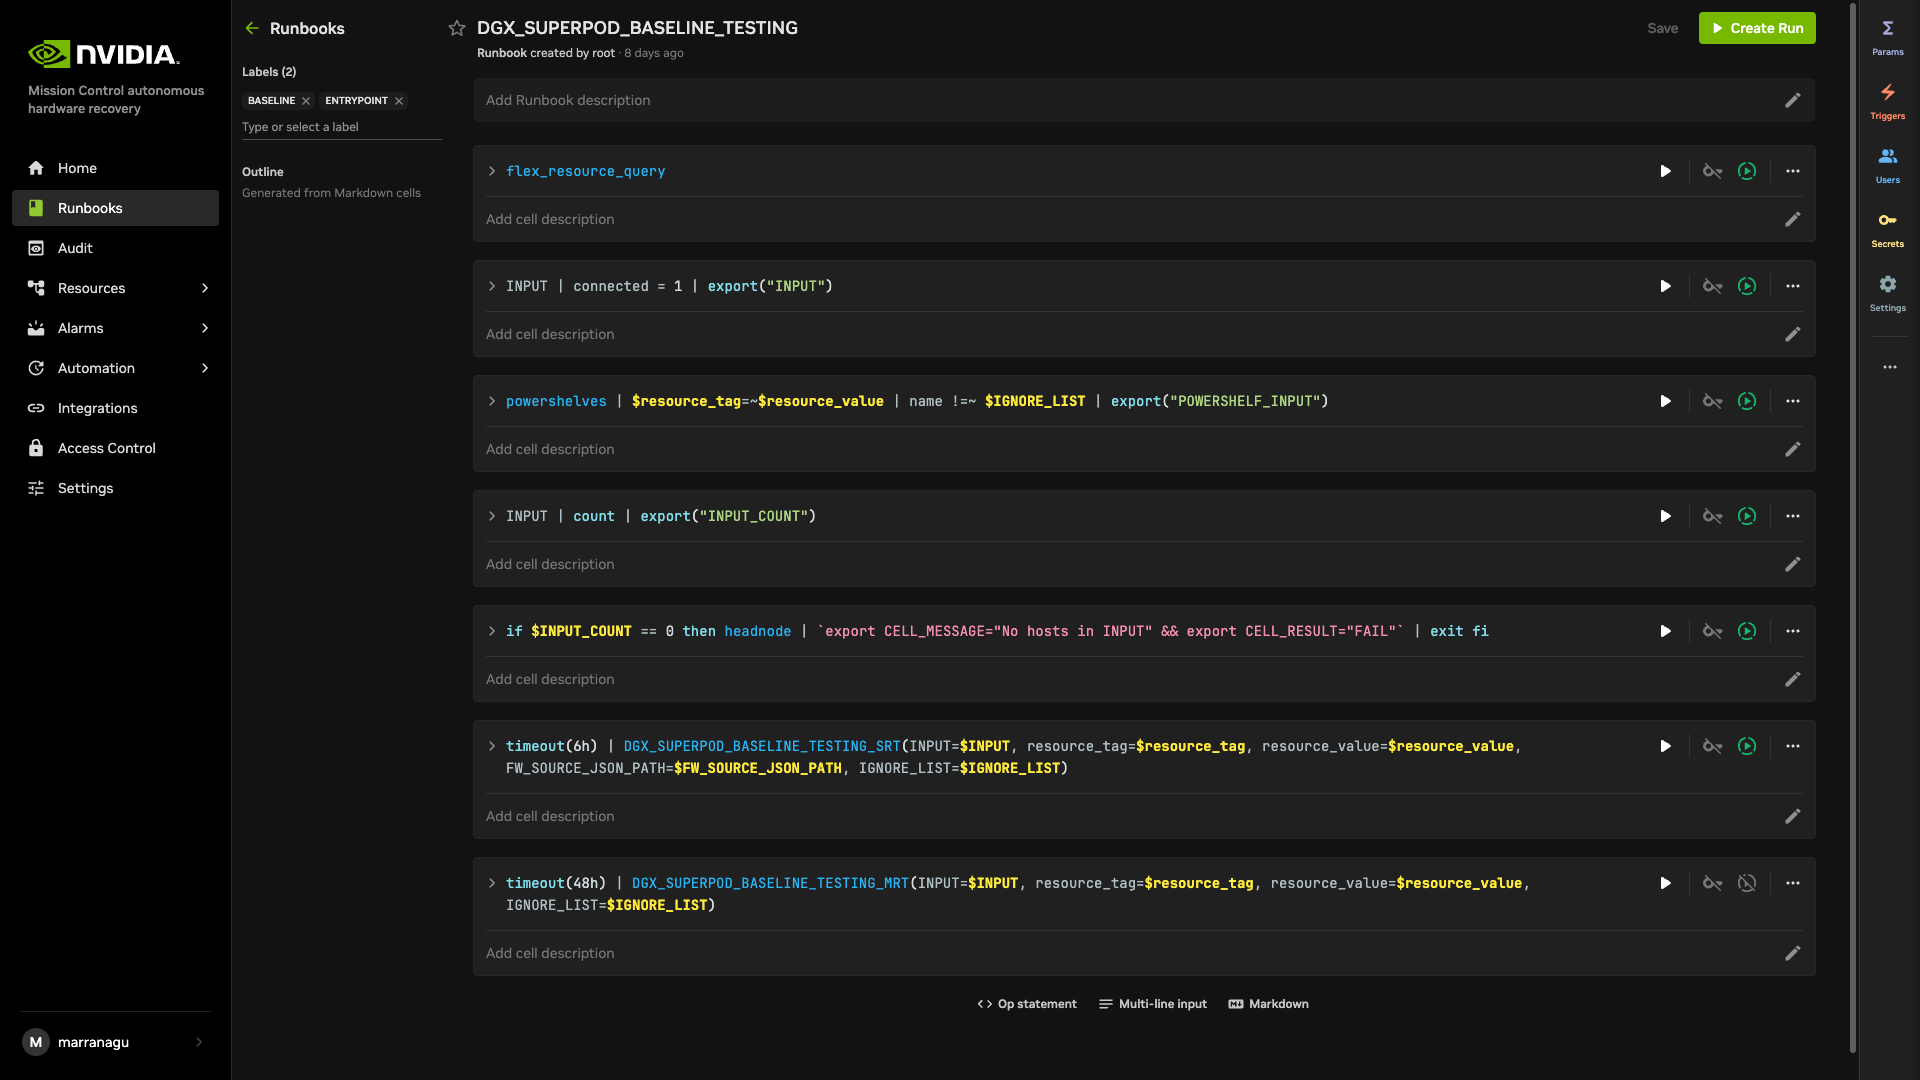
To initiate a run, select the Create Run button located at the top right corner of the interface. A new window will appear as shown below. For detailed information about each parameter, simply hover over the info icon beside it.
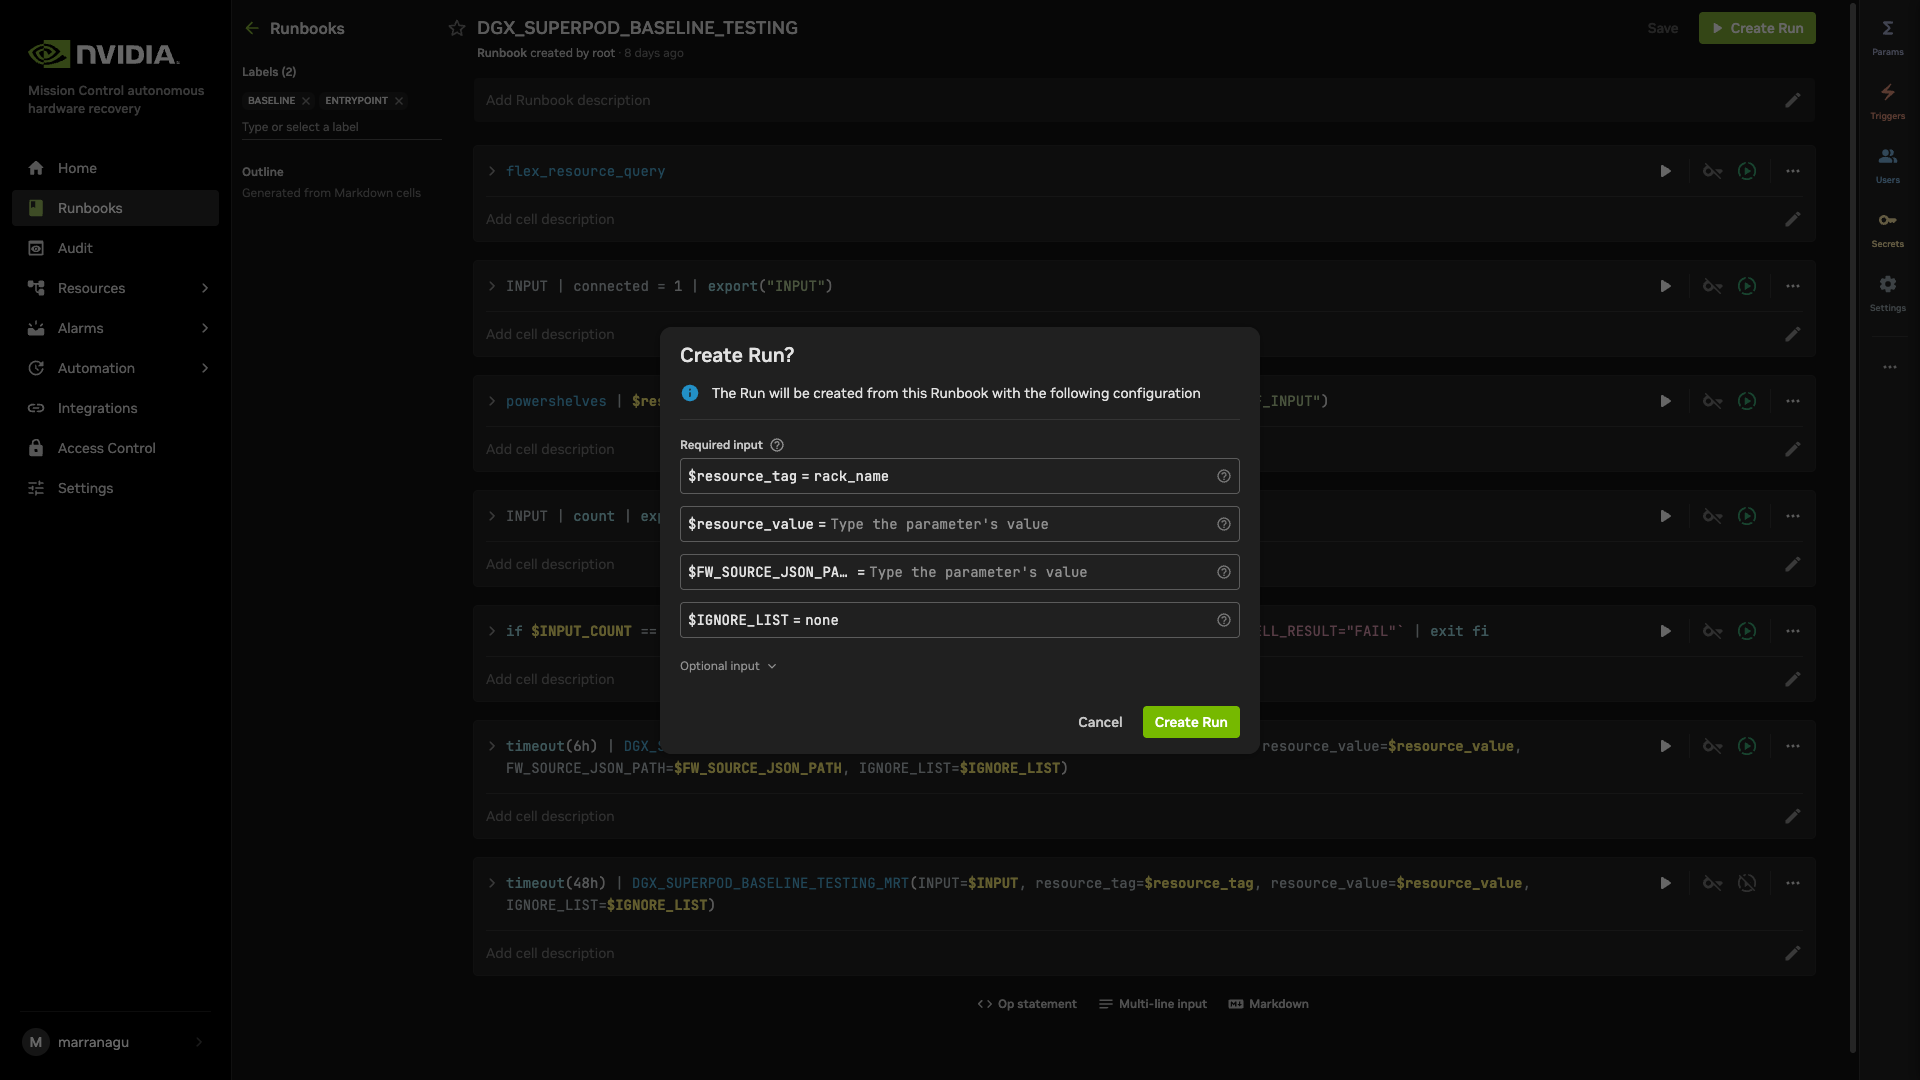
You are required to provide the following inputs for the runbook
Resource filtering (flex query): Runbooks use a flexible resource query instead of hardcoding a single rack. You specify:
resource_tag (required): Tag for the flex resource query. Use
rack_namefor rack-based filtering (e.g., to run on a specific rack or set of racks).resource_value (required): Value for the flex resource query. Set to the same value you would have used for the rack name (e.g., B05, A01, m06|m07 for multiple racks), or use “none” if you do not want to filter by that tag. This allows you to target any resource—not just a single hardcoded rack.
FW_SOURCE_JSON_PATHSpecify the file path to the golden configuration JSON file included in the firmware package. This file defines the reference settings used for validation. If the file is not available, set this parameter to NA.IGNORE_LISTProvide a list of nodes to exclude from the test only if required. Leave the value as “none” if no nodes need to be ignored. This parameter supports regular expressions. Here are some examples:Single node: node01
List format: [“node01”, “node02”]
Pipe-delimited string: node01|node02
After entering the correct resource_tag and resource_value (e.g., resource_tag=rack_name, resource_value=m06 or m06|m07), select the “Create Run” button to initiate the process. A confirmation dialog will appear with a “View Run” link illustrated below. Selecting this link will redirect you to a new page displaying comprehensive job status and details. For additional information regarding job monitoring and results, please refer to the “Check Job Status and Result” section of this documentation.
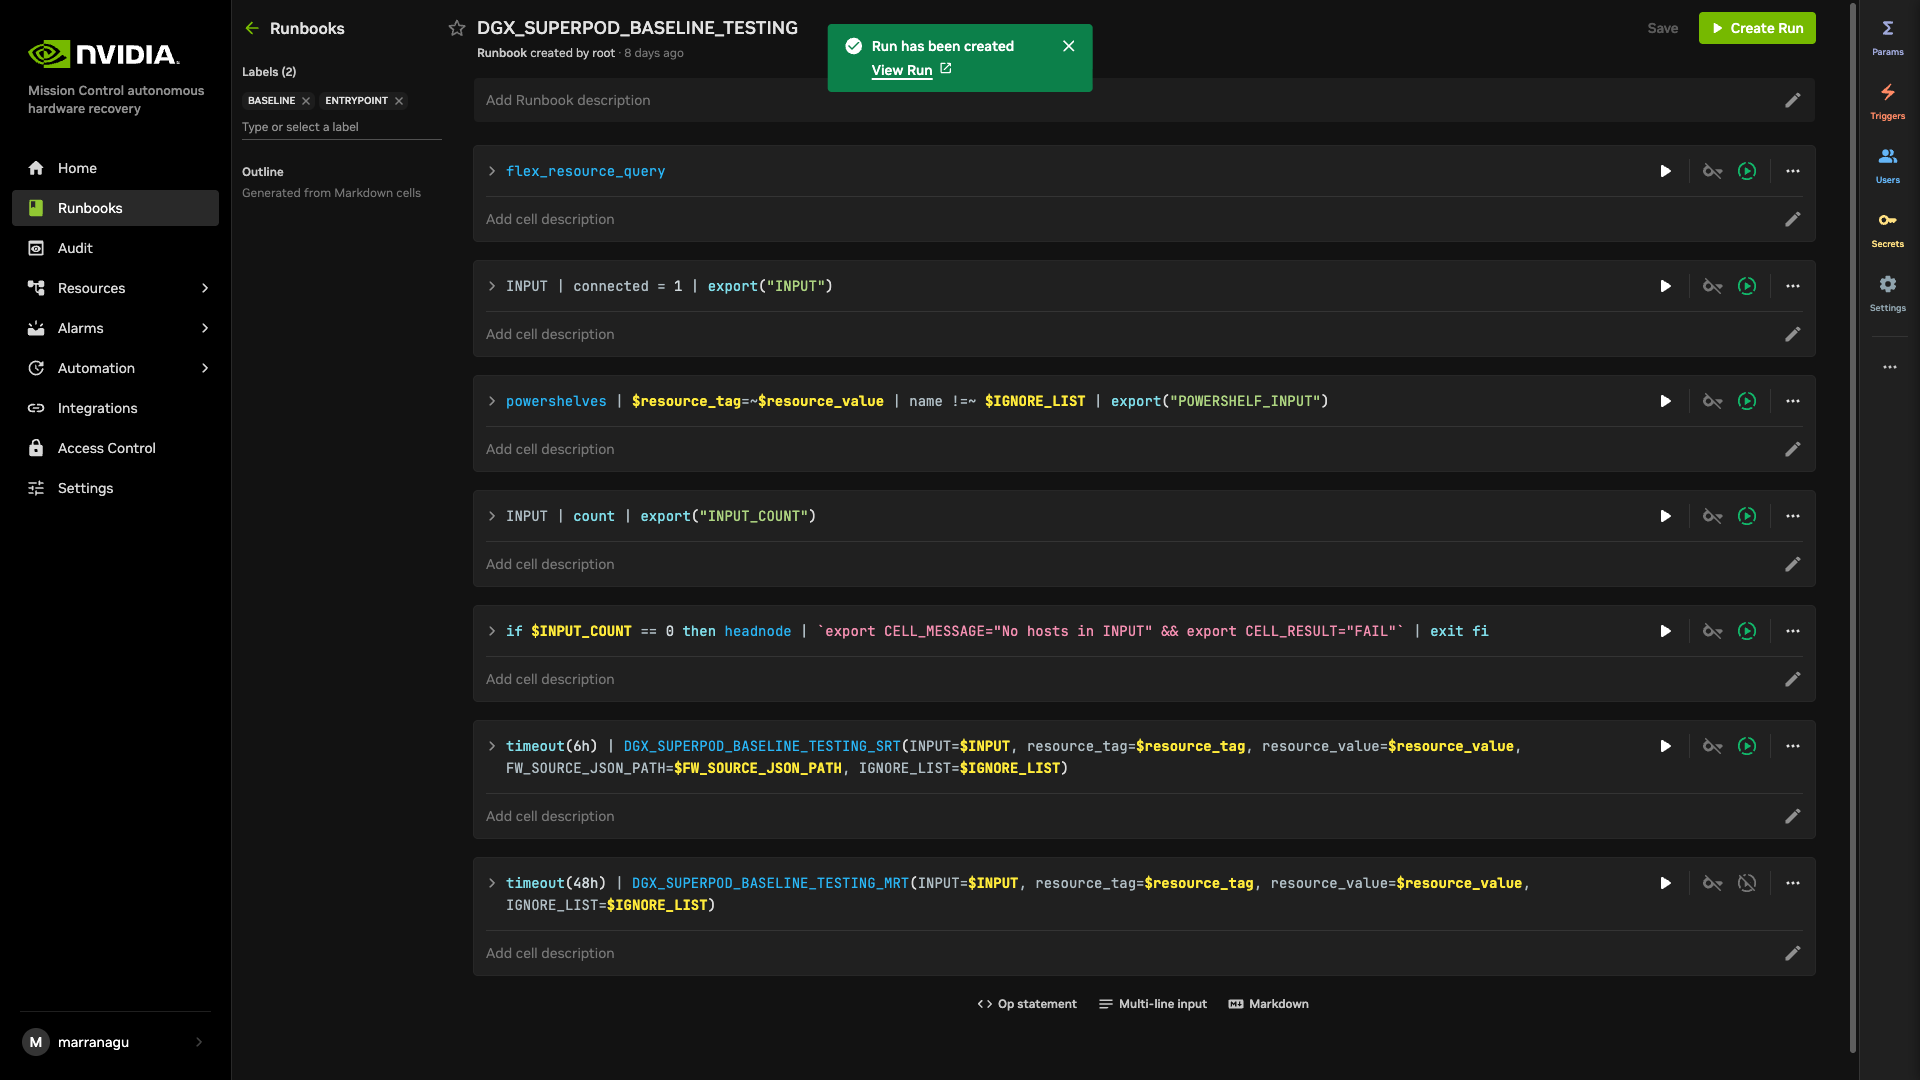
IMPORTANT NOTES:
How to get the value for resource_value (e.g. rack_name):
Be noted the value (e.g. rack_name) is generated and captured automatically from BCM Inventory. below are the steps to get the value
Access the NVIDIA Mission Control autonomous hardware recovery portal using your credentials and navigate to the Runbooks section.
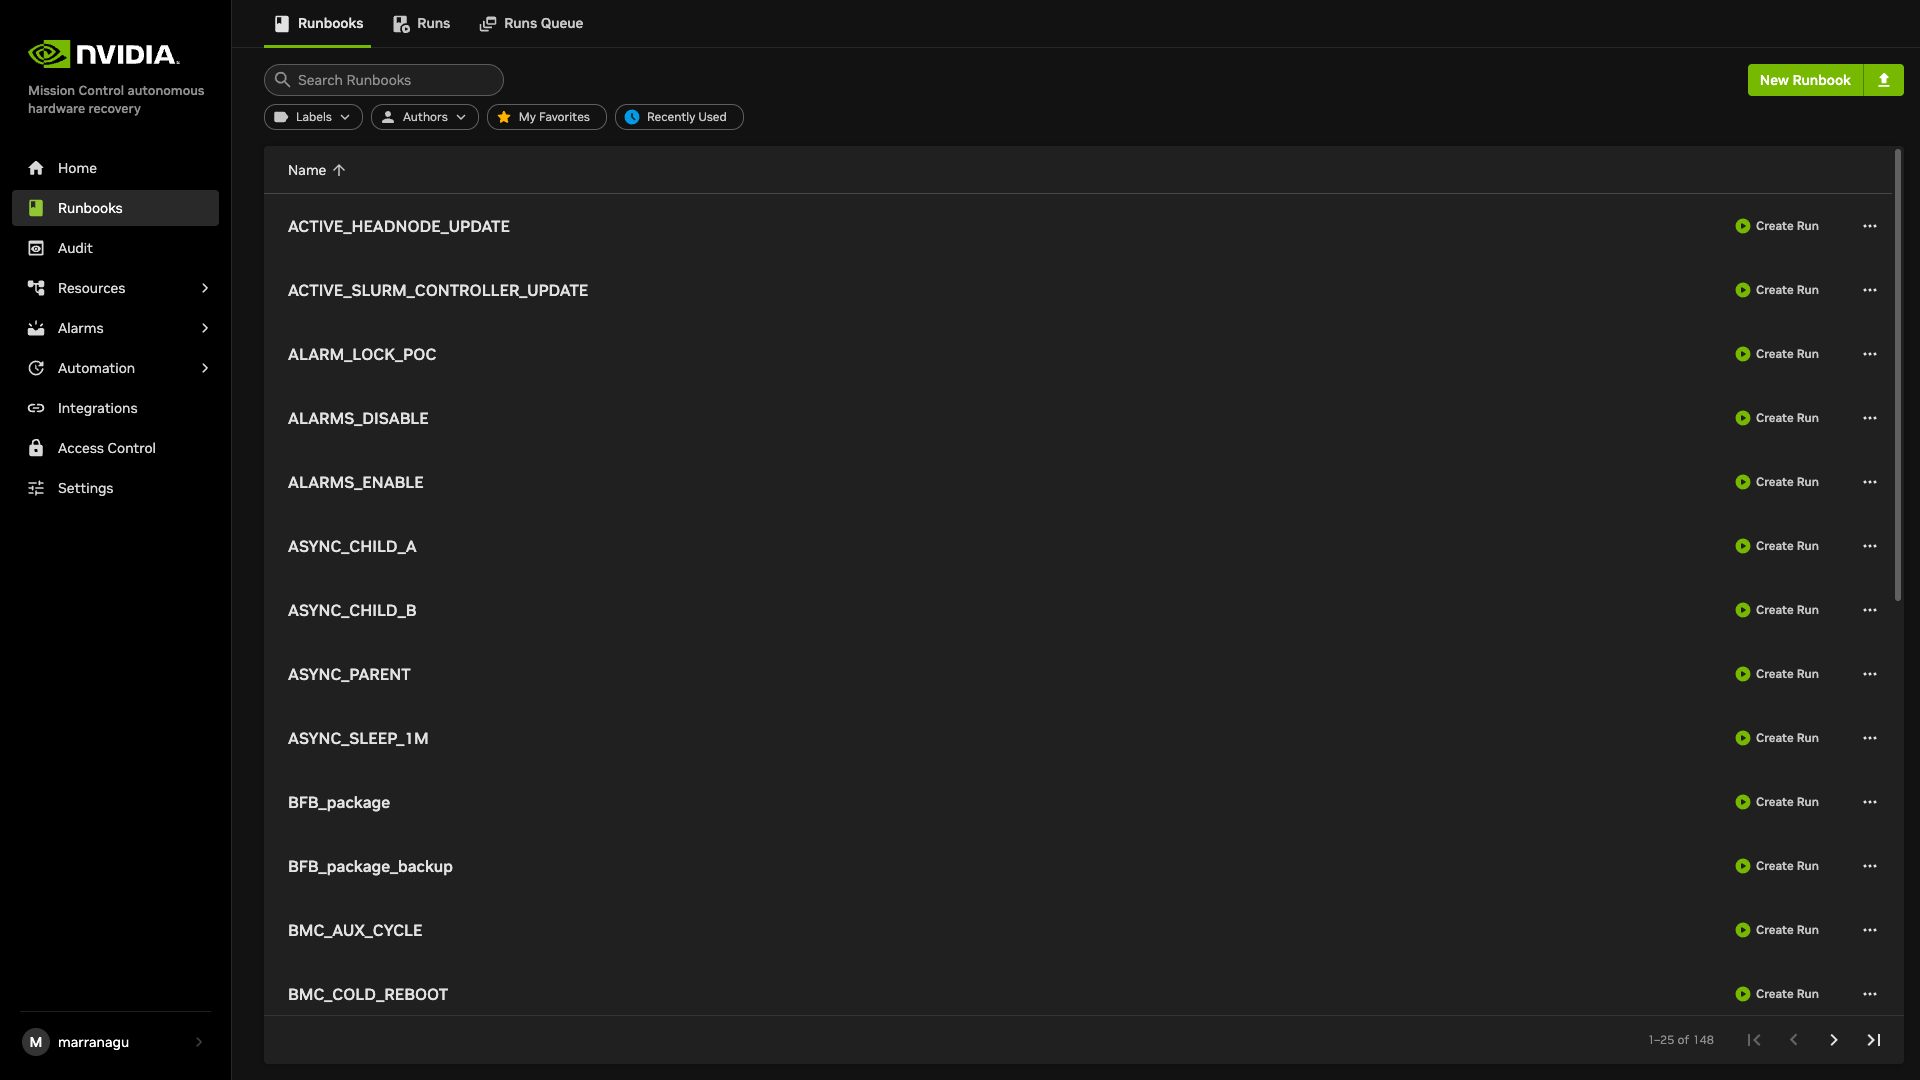
Click the button at right top “New Runbook” then you will see below.
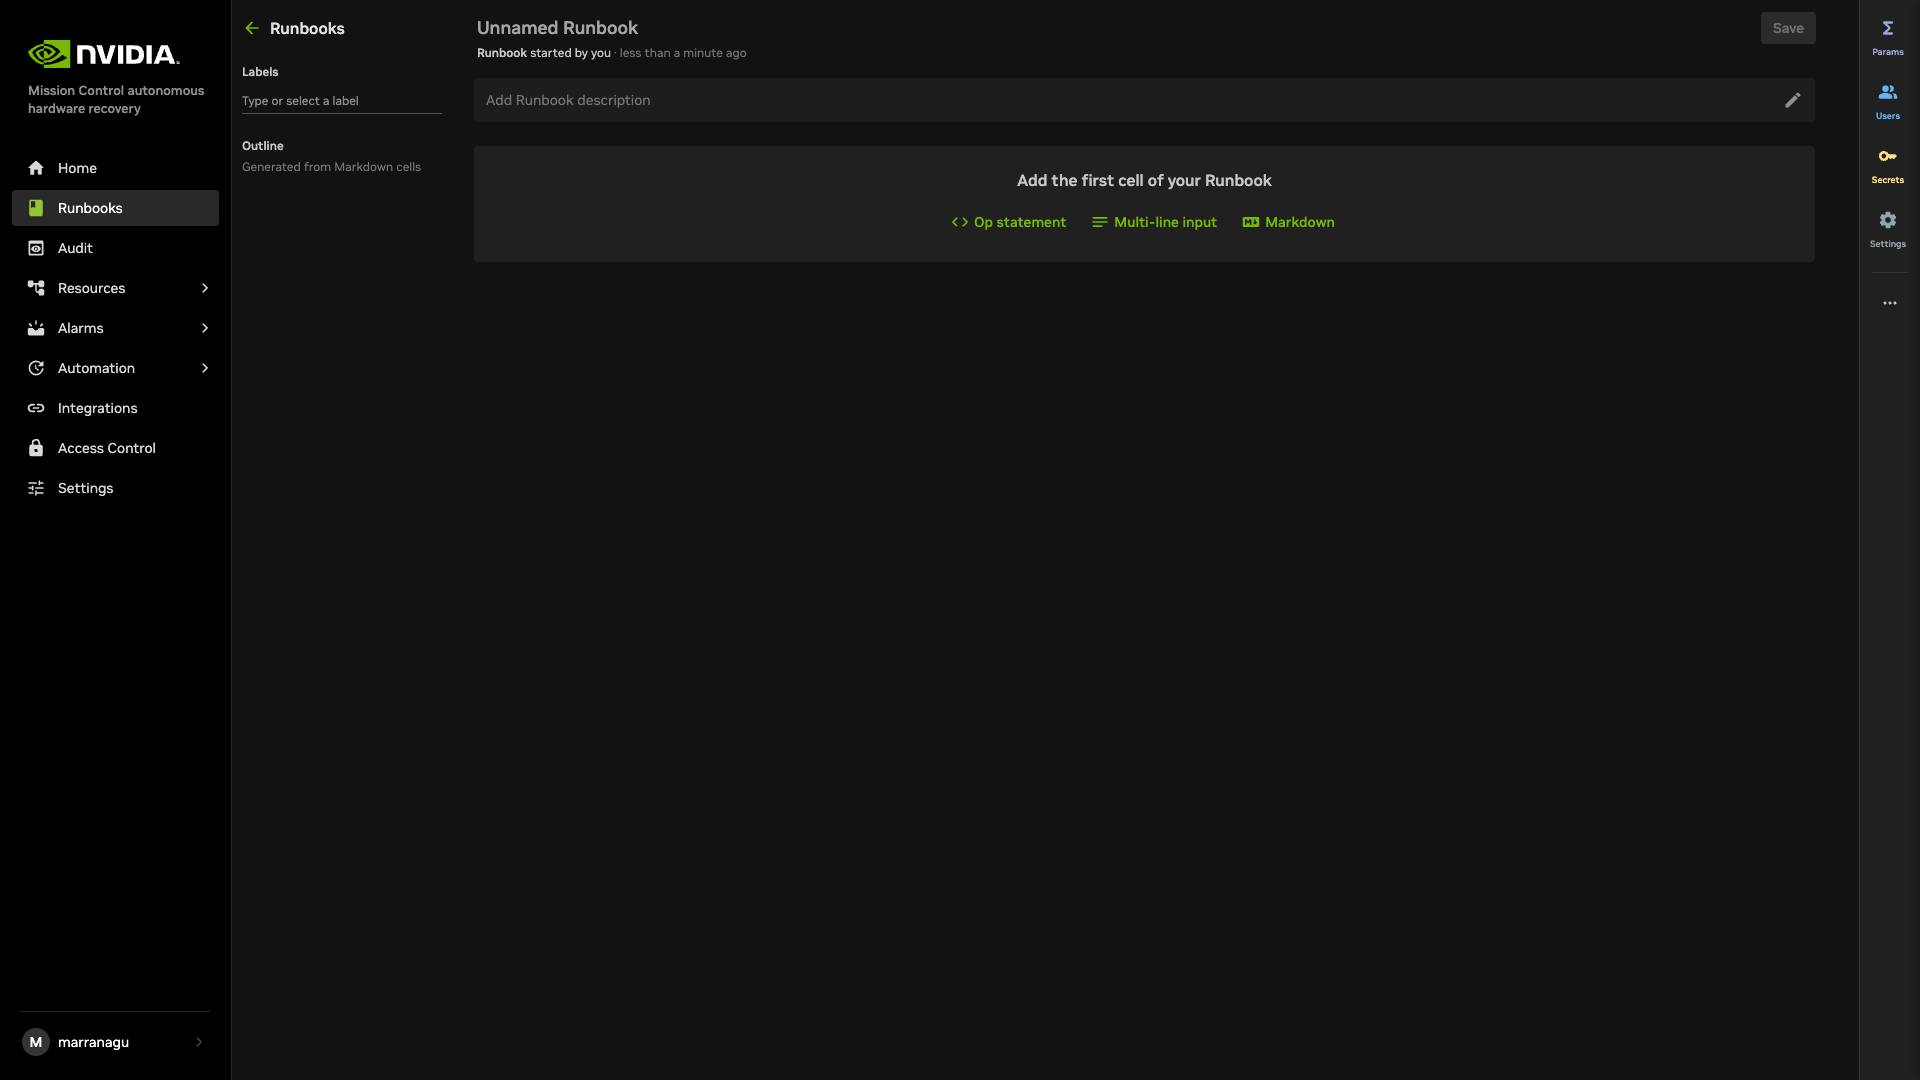
In the central page, click “Op Statement” to create your first cell to query the resource
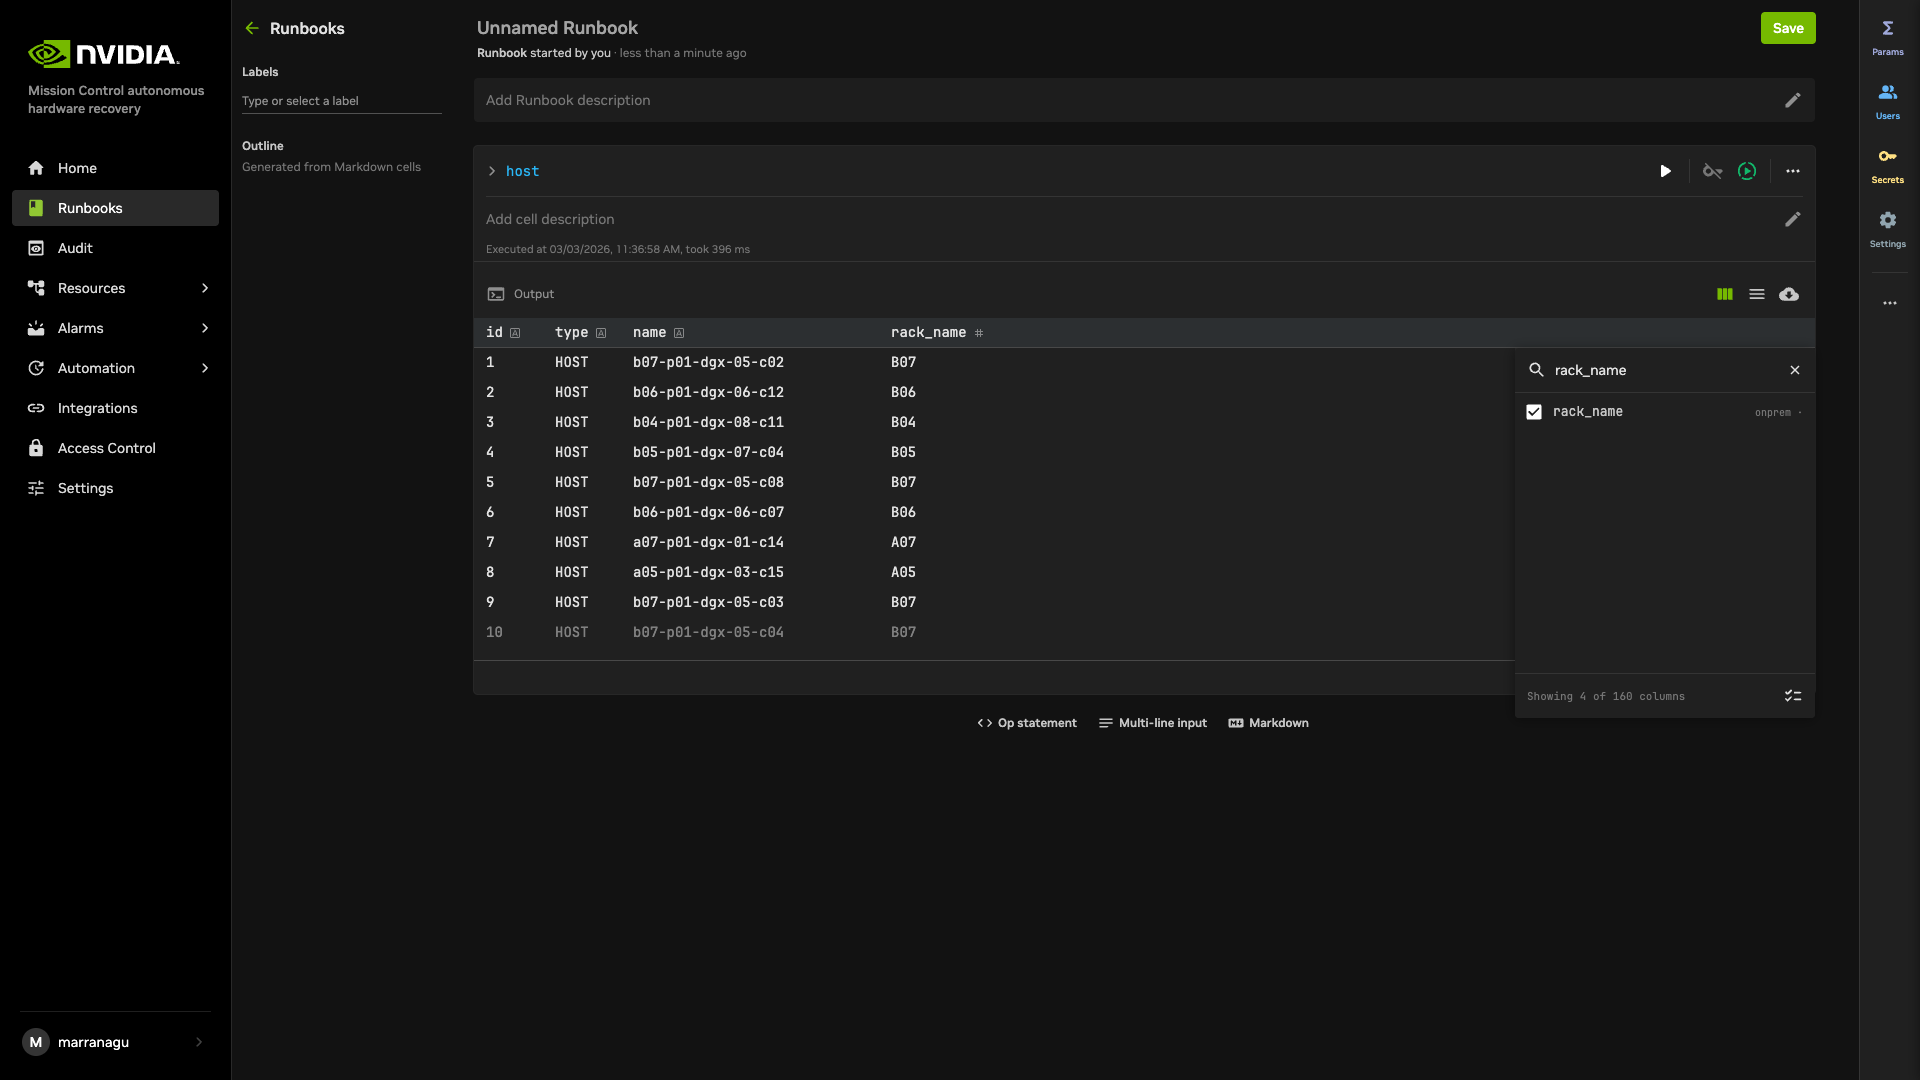
Type “host” in the cell as your first query and press Enter so then you can see all the host information as below example.
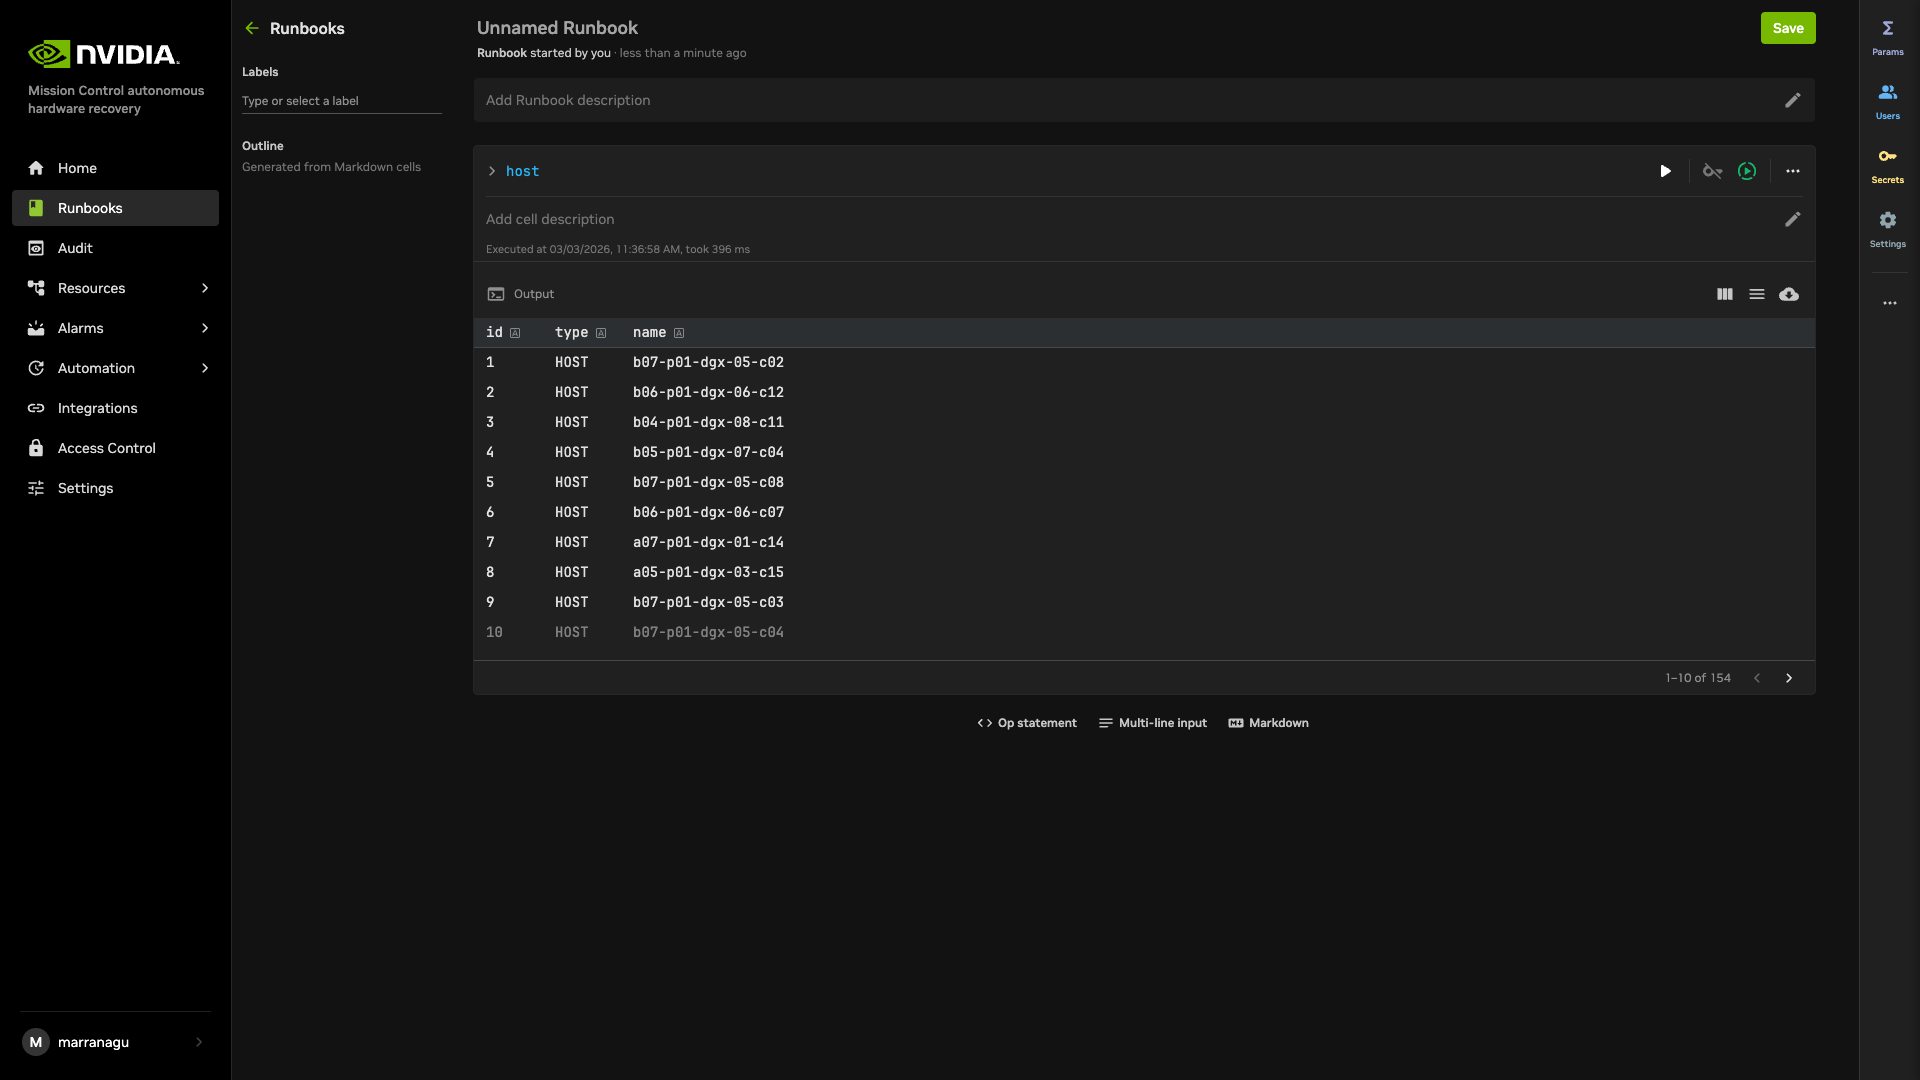
You will be able to see the value for the chosen tag (e.g. “rack_name”). In case it’s not show up, click “Show Panel” and type the tag name (e.g. “rack_name”) in Search and ensure it’s selected.
Predefined the timeout for SRT is 4 hours. You can adjust based on your requirements.
Run MRT (Multi Rack Testing) Job#
Guide to Initiating Baseline Testing Procedures for Multi-Rack Configuration.
Navigate to the “DGX_SUPERPOD_BASELINE_TESTING” runbook utilizing the previously outlined navigation protocol.
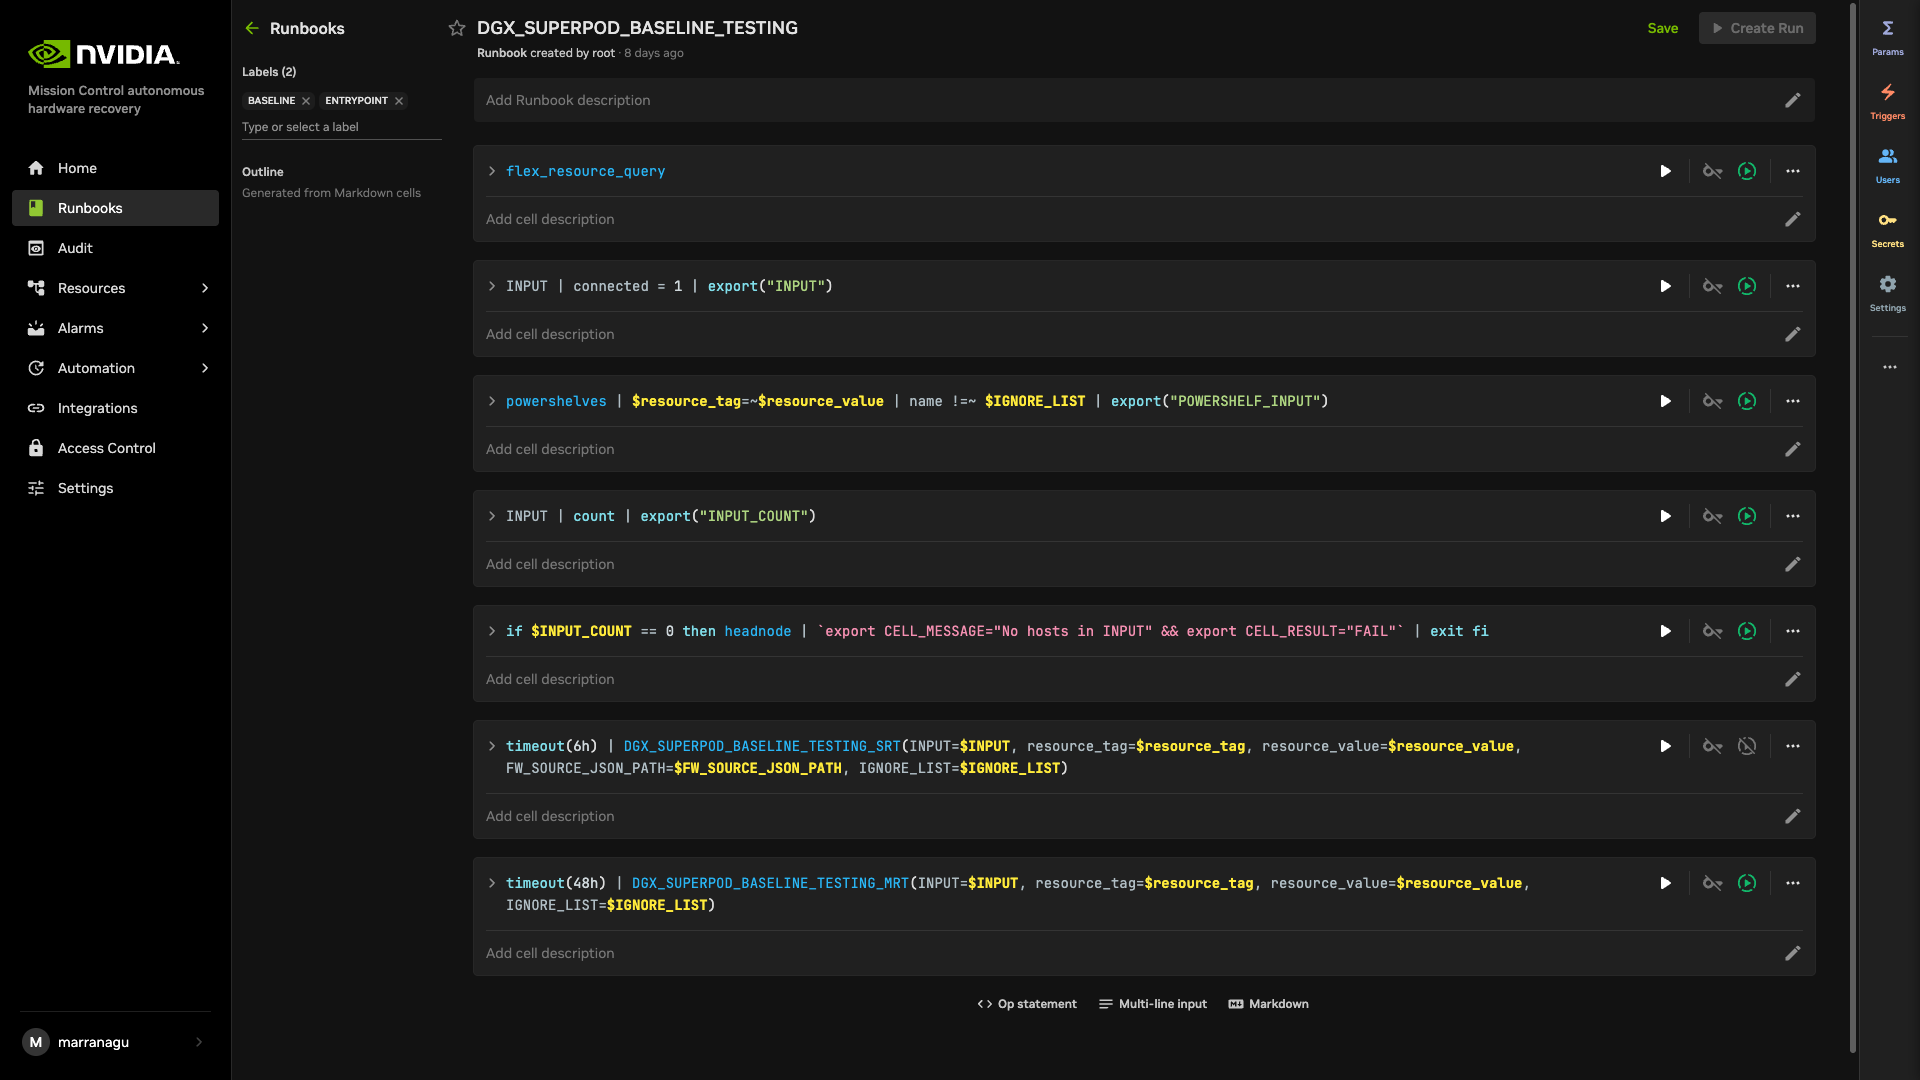
Ensure the “DGX_SUPERPOD_BASELINE_TESTING_MRT” component is activated by toggling the switch control. This control is located on the right side of its immediate group of interface icons. The switch indicator in its default deactivated state should be visually distinct from the activated state. Note: When activated, the switch indicator displays as a green circle with a play icon.
Verify that the “DGX_SUPERPOD_BASELINE_TESTING_SRT” component is in its deactivated state. This deactivated state is indicated by its corresponding switch control displaying as a grey circular icon containing a muted play symbol, signifying it is ‘Off’.
Select the “Save” button positioned in the top right corner of the interface to preserve your settings.
Upon successful completion of these preliminary steps, your runbook configuration should reflect the specified parameters as illustrated below.
Select the “Create Run” button positioned in the top right corner of the interface, the new window will pop out as illustrated below.
The identifier represents the resource filter. For rack-based runs, use resource_tag=rack_name and resource_value set to the rack designation. The system accommodates both single and multiple rack configurations, as detailed below:
Single Rack Format:
Standard notation: resource_value (Example: m06)
Multiple Rack Format:
Standard notation: resource_value|resource_value (Example: m06|m07)
Critical: No spaces are permitted between rack identifiers and the delimiter (|)
After entering the correct resource_tag and resource_value, select the “Create Run” button to initiate the process. A confirmation dialog will appear with a “View Run” link illustrated below. Selecting this link will redirect you to a new page displaying comprehensive job status and details. For additional information regarding job monitoring and results, please refer to the “Check Job Status and Result” section of this documentation.
IMPORTANT NOTES:
how to get the value for resource_value (e.g. rack_name):
Be noted the value (e.g. rack_name) is generated and captured automatically from BCM Inventory. below are the steps to get the value
Access the NVIDIA Mission Control autonomous hardware recovery portal using your credentials and navigate to the Runbooks section.
Click the button at right top “New Runbook” then you will see below.
In the central page, click “Op Statement” to create your first cell to query the resource
Type “host” in the cell as your first query and press Enter so then you can see all the host information as in the below example.
You will be able to see the value for the chosen tag (e.g. “rack_name”). In case it’s not showing up, click “Show Panel” and type the tag name (e.g. “rack_name”) in Search and ensure it’s selected.
Predefined the timeout for SRT is 4 hours. You can adjust based on your requirements.
Runbook Configurations#
Before you initiate real jobs, we’d like to provide you with a guide on how to check the Runbook Configurations.
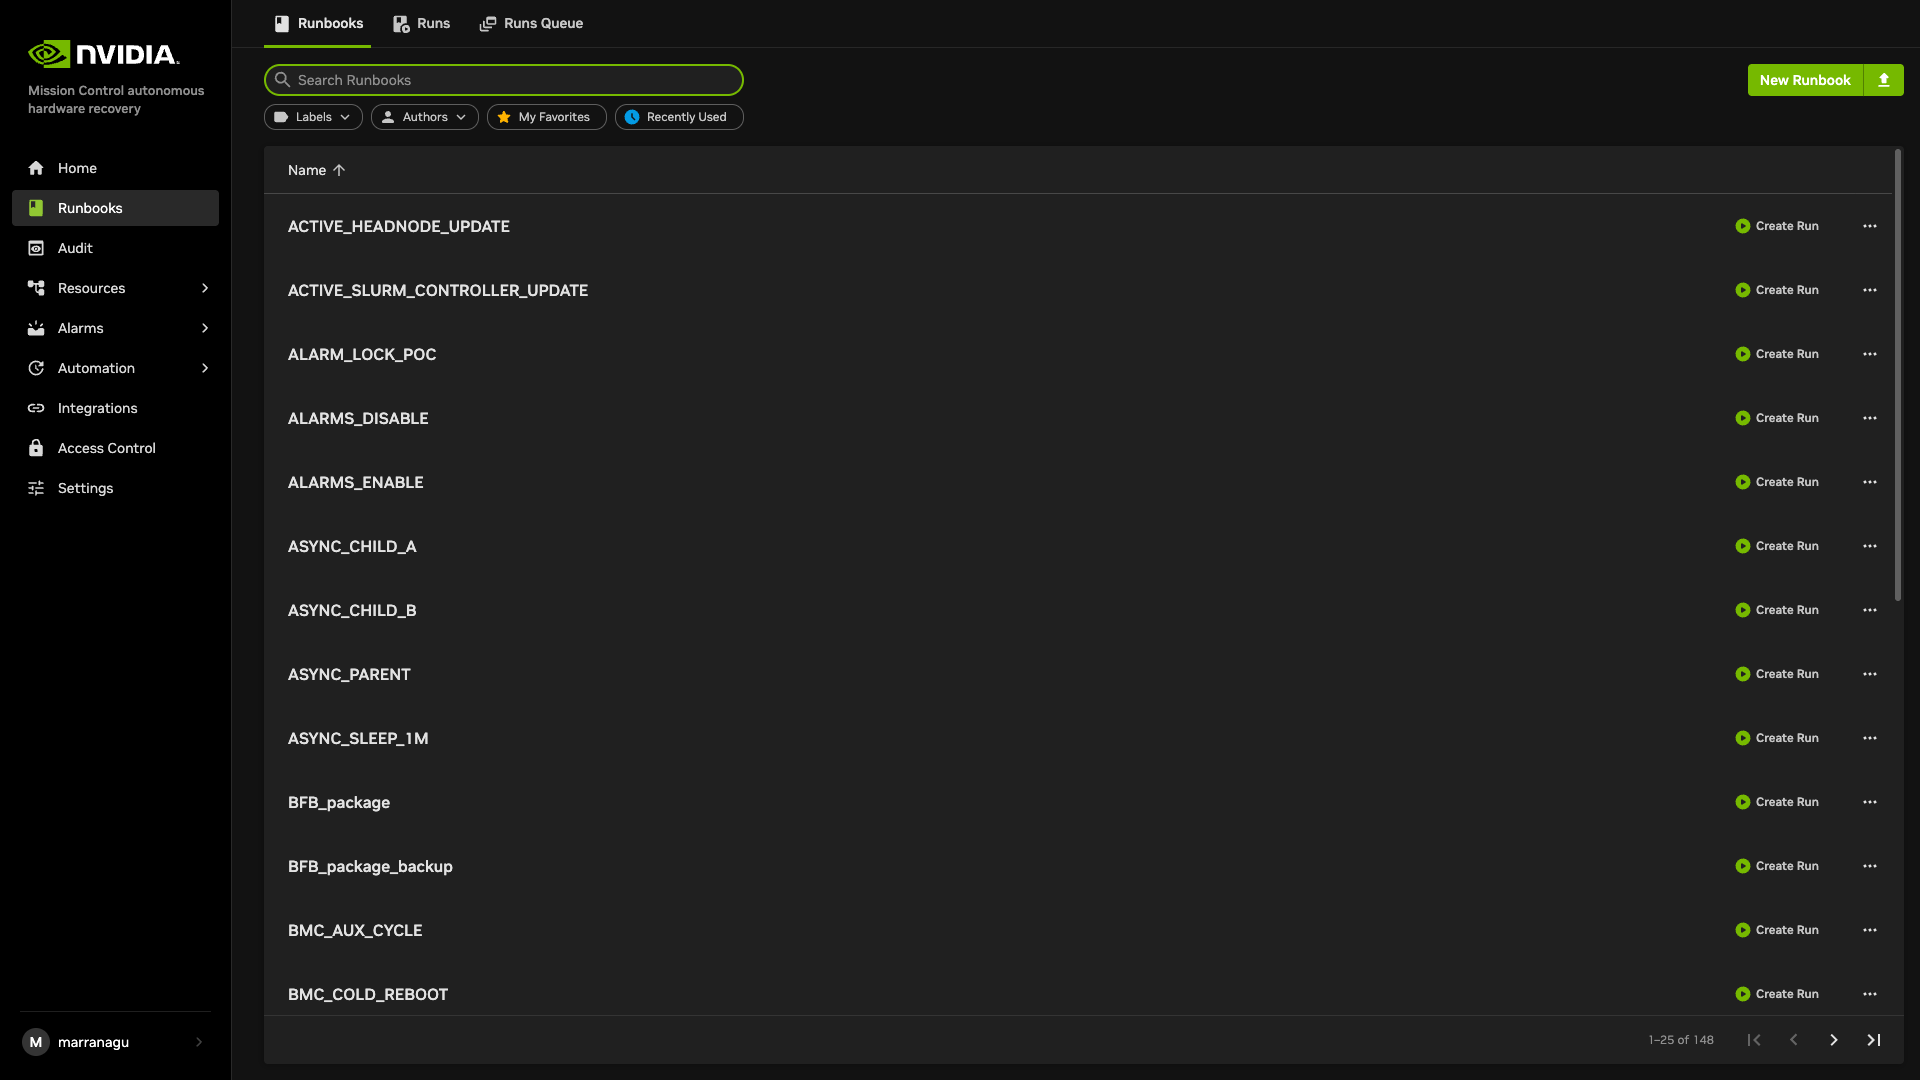
Select “Runbook” from the left navigation panel, then use the search field on the right side of the page to find your runbook by name, as shown in the illustration below.
Below is the list of all mission control related runbooks including its name and description.
Category |
Runbook Name |
Description |
|---|---|---|
DGX_SUPERPOD_BASELINE_TESTING |
EntryPoint Runbook |
|
SRT |
DGX_SUPERPOD_BASELINE_TESTING_SRT |
EntryPoint Runbook of SRT |
SRT1 |
EntryPoint Runbook of all single node health checks |
|
SINGLENODE_HEALTHCHECK_GPU_CPU |
Baseline health checks for GPU and CPU |
|
SINGLENODE_HEALTHCHECK_MEMORY_STORAGE |
Baseline health checks for Memory and Storage |
|
SINGLENODE_HEALTHCHECK_NETWORK |
Baseline health checks for Network |
|
SINGLENODE_HEALTHCHECK_SOFTWARE |
Baseline health checks for installed software |
|
SINGLENODE_HEALTHCHECK_FIRMWARE |
Baseline health checks for firmware |
|
SRT2 |
EntryPoint Runbook of component testing |
|
SR_MEMORY_BENCHPRESS |
Benchmark testing for memory |
|
SR_CUDA_SAMPLES |
Benchmark testing for CUDA |
|
SR_P2P_IPERF |
Benchmark testing for pairwise ethernet interfaces |
|
HPL_MXP_TEST_SINGLE_NODE_MPIRUN |
HPL_MXP testing on single node separately |
|
HPL_MXP_TEST_MPIRUN |
HPL_MXP testing on the single rack |
|
SR_NVBANDWIDTH |
Bandwidth testing running in single nvldomain |
|
NCCL_TEST |
NCCL testing on the single rack |
|
SRT3 |
EntryPoint Runbook of burn-in performance testing |
|
HPL_MXP_TEST_BURN_IN_MPIRUN |
HPL_MXP testing on the single rack with long duration |
|
MRT |
DGX_SUPERPOD_BASELINE_TESTING_MRT |
EntryPoint Runbook of MRT |
MRT1 |
EntryPoint Runbook of rack level connectivity testing |
|
MR_INFINIBAND_CHECK_UFM |
InfiniBand connectivity check via UFM |
|
IB_PERF_TEST_SINGLE_NODE |
InfiniBand performance test on single node |
|
MRT2 |
EntryPoint Runbook of multi-rack performance testing |
|
MR_HPL_TEST |
HPL testing cross multiple racks |
|
MR_NCCL_TEST |
NCCL testing cross multiple racks |
|
MR_HPL_TEST_BURN_IN |
HPL testing cross multiple racks with long duration |
|
MR_NCCL_TEST_BURN_IN |
NCCL testing cross multiple racks with long duration |
|
MRT3 |
EntryPoint Runbook of cluster level testing |
|
Nemotron_15B |
LLM testing with mocked data |
Runbook Interface Guide#
When accessing the runbook as shown in the example below, please note these important configuration elements:
Central Workspace#
The main content area displays your resource queries, commands, scripts, or nested runbooks.
Each row represents an individual cell
Each cell includes a play button for isolated execution
Toggle switches allow you to enable/disable specific cells
Configuration Panel (Right Side)#
The right panel contains several critical configuration sections:
Parameters Contains all required inputs for runbook execution
Triggers Configure automated execution methods:
Alarm triggers
Time Trigger (cron jobs)
Other integrations like AlertManager
Users Manage permissions for who may run or edit the runbook
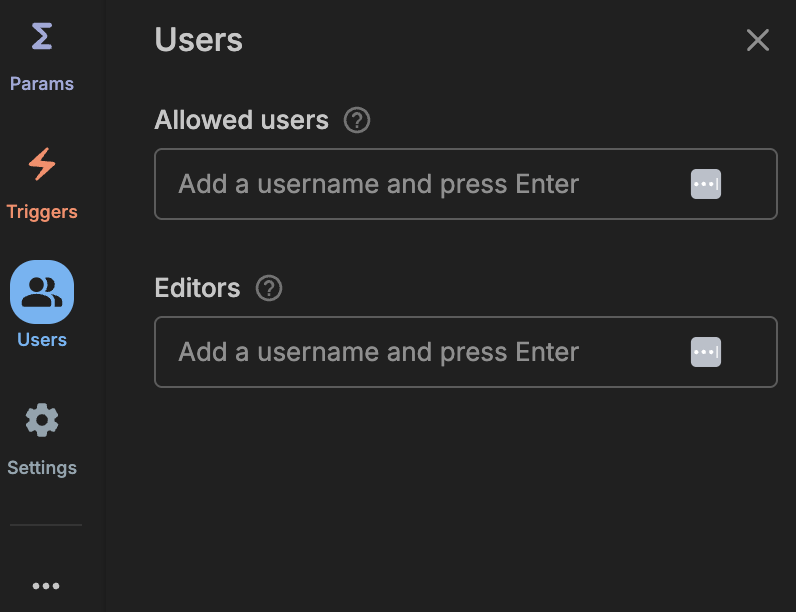
Settings General runbook configuration options
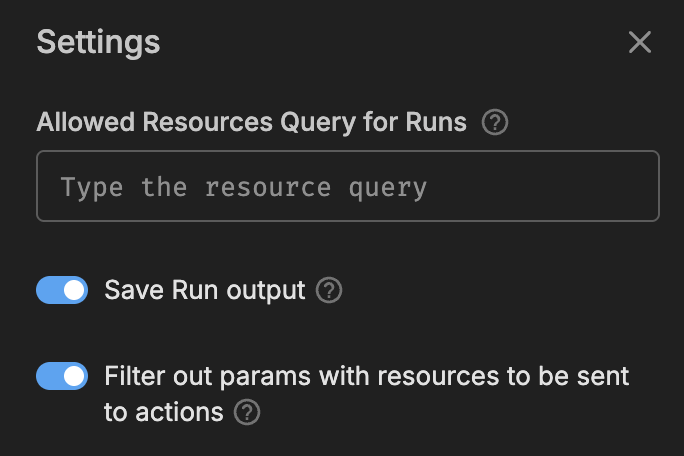
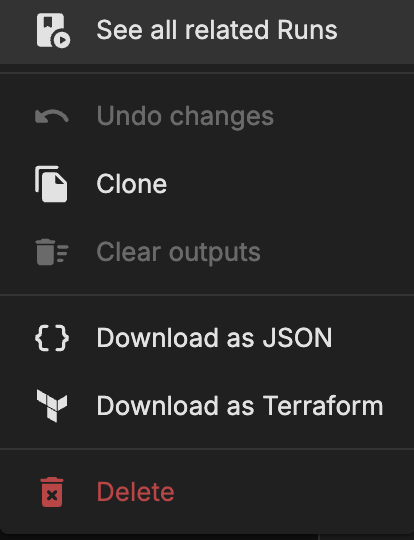
… more runbook operations including:
Clone functionality
Export options
Delete runbook
etc.
Check Job Status and Result#
Once you’ve initiated the SRT or MRT using the steps above, there are 2 options to check the job status and results:
Click “View Run” right after you “Created the Run” in above sections to redirect you to another page
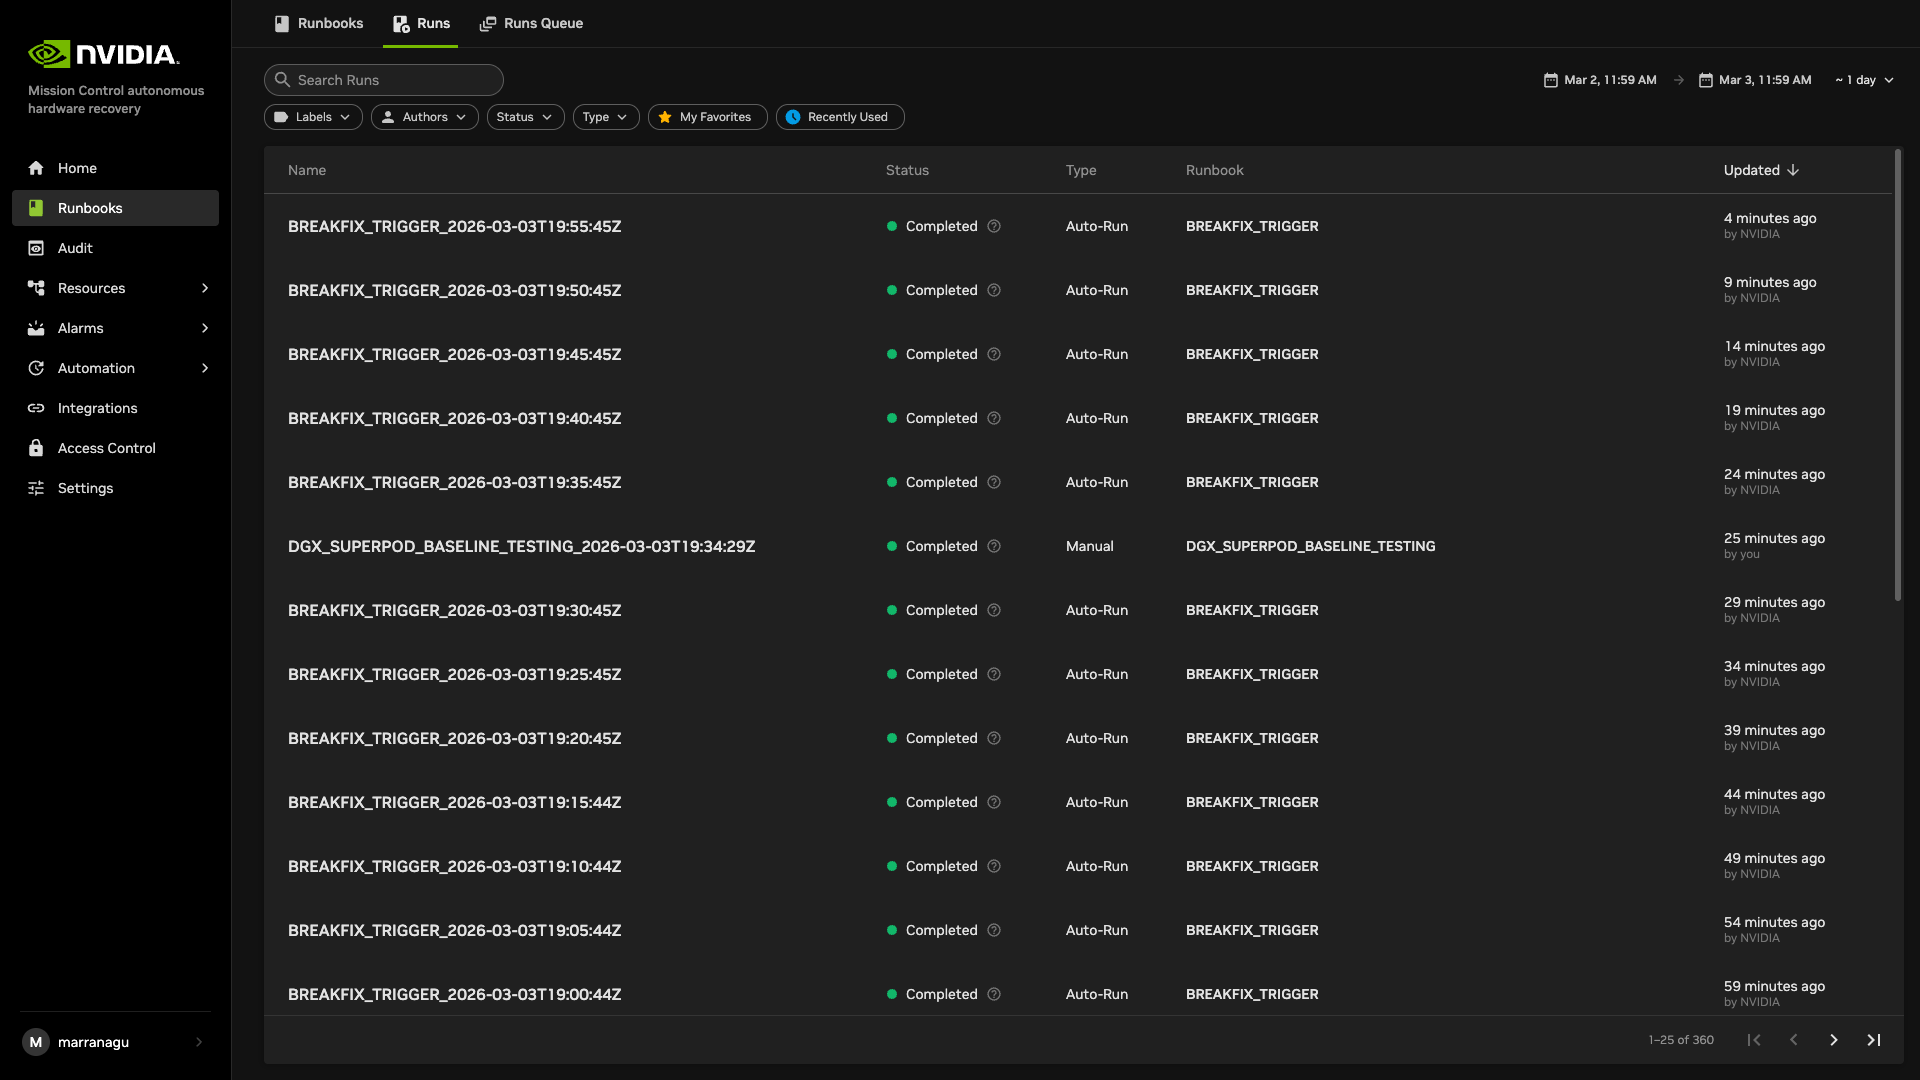
Navigate to the “Runbook” section in the left panel, then click the “Run” button located in the upper left corner of the page as shown below. Important: Make sure you’ve selected the correct range in the upper right corner before proceeding.
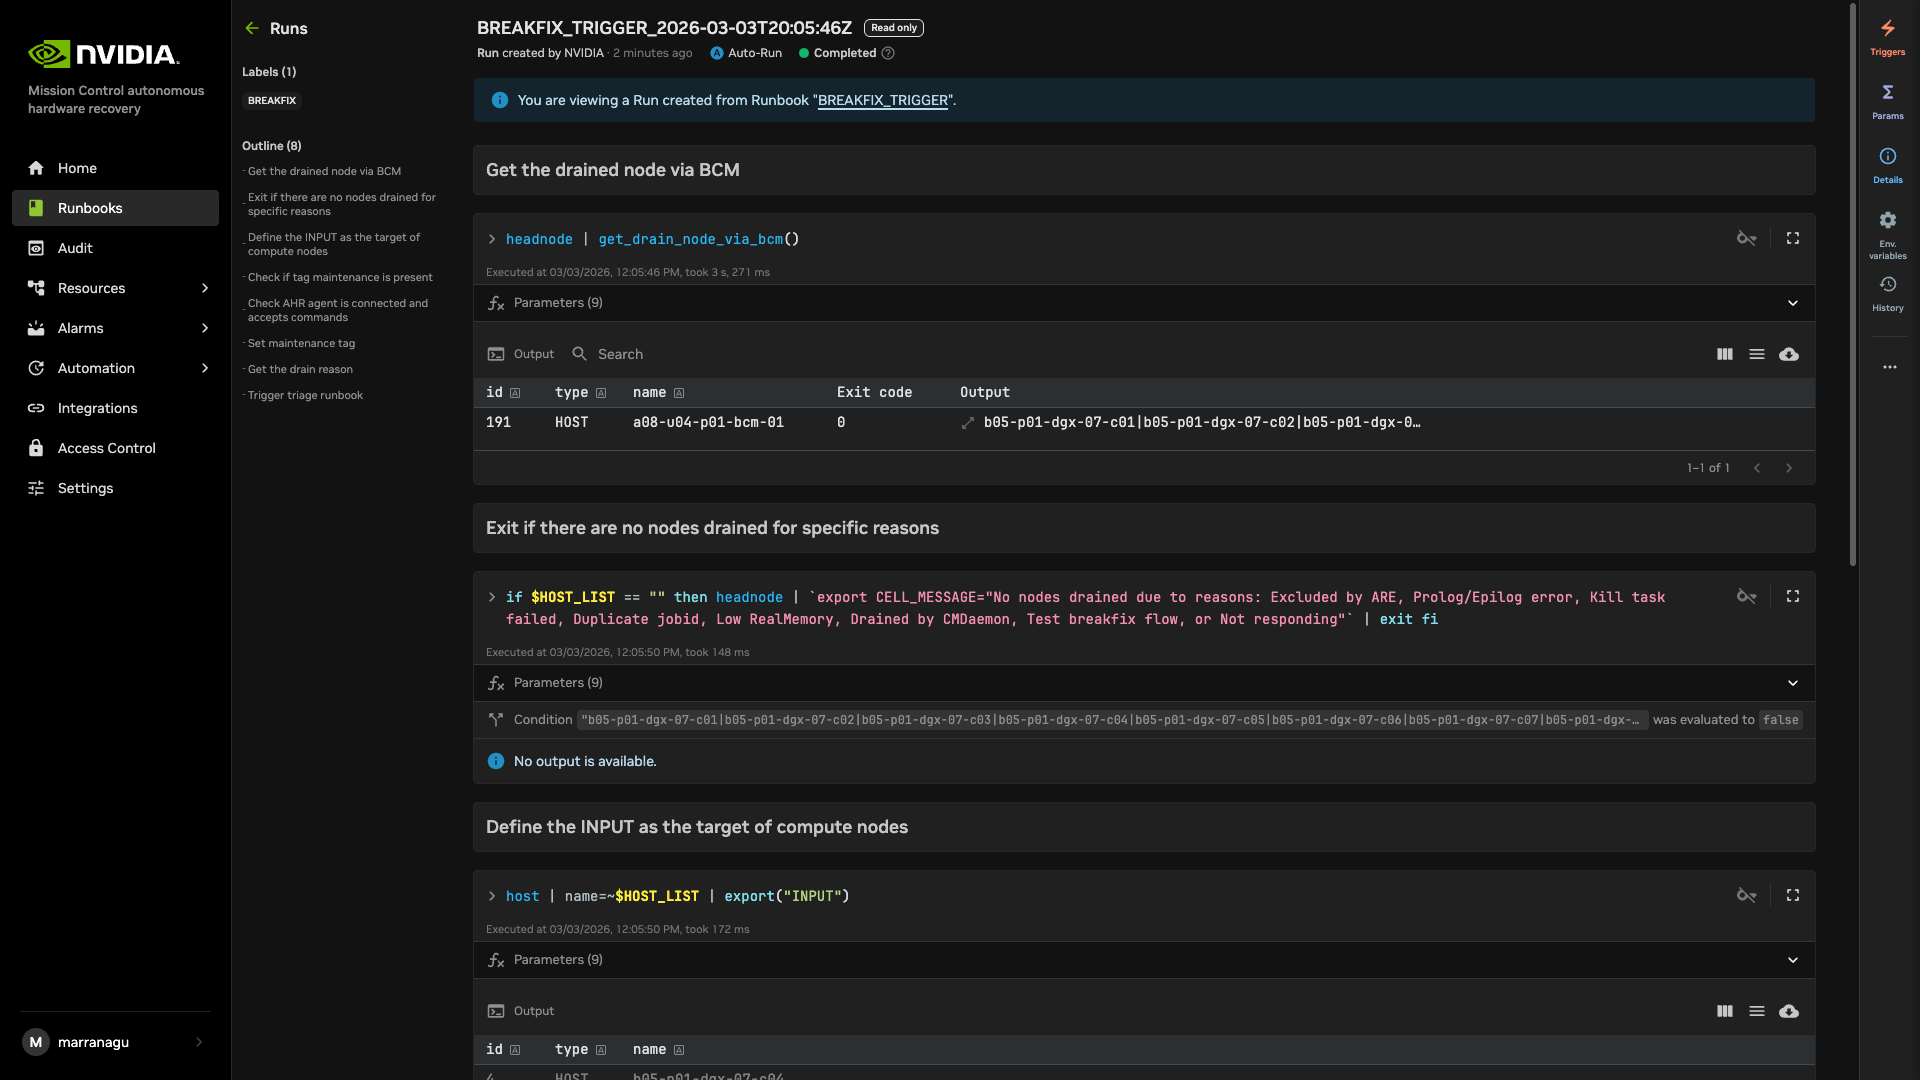
Note: Runbooks can be nested within other runbooks. When this occurs, you may see a “Execution succeeded - View Run” link after a cell completes. Clicking this link will redirect you to a detailed results page for the nested runbook execution.
In the following part of this section, we will walk you through the topics below.
Check Job status - Whether the job is Running, Completed, Aborted, Terminated or Timed out.
Check Job results - if the job passed or failed, along with detailed logs
Check Job Status#
At the top of each job execution, you will observe one of the following status indicators:
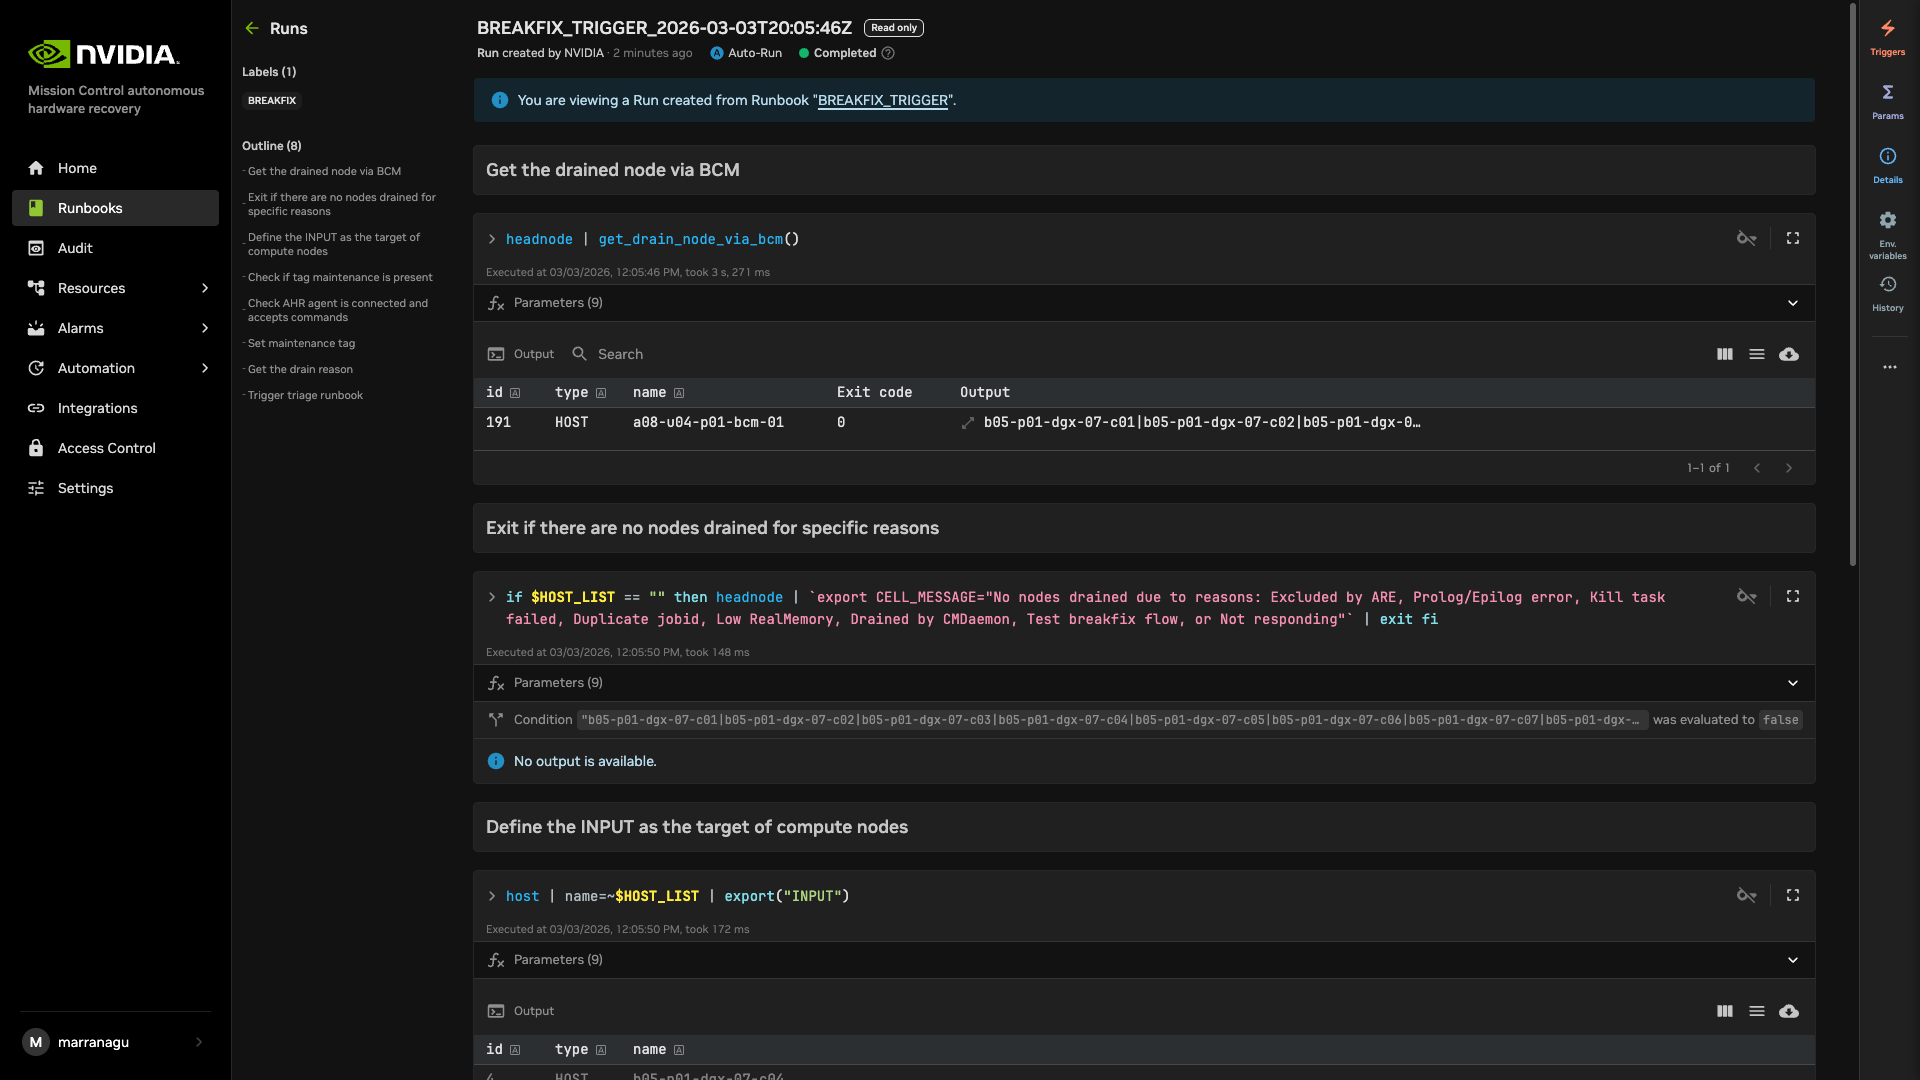
Status Types and Definitions#
Running The job is currently executing. Progress is displayed as a percentage based on completed cells.
Completed The job has finished execution. Note that completion status does not guarantee successful results. Please review the detailed output in the results section.
Aborted The job terminated prematurely due to execution errors, such as cell syntax issues.
Terminated The job was forcibly ended by the system.
Timed Out The job exceeded its maximum allowed execution duration (default timeout is 1 hour for runbook, 1 minute for action)
Canceled The job was manually terminated by a user.
Check Job Results#
When the job status displays “Completed,” you may proceed to review the job results. If the job status shows otherwise, you may click into the job for more details and troubleshooting.
Cell Structure Overview#
Each cell in the runbook contains three primary components:
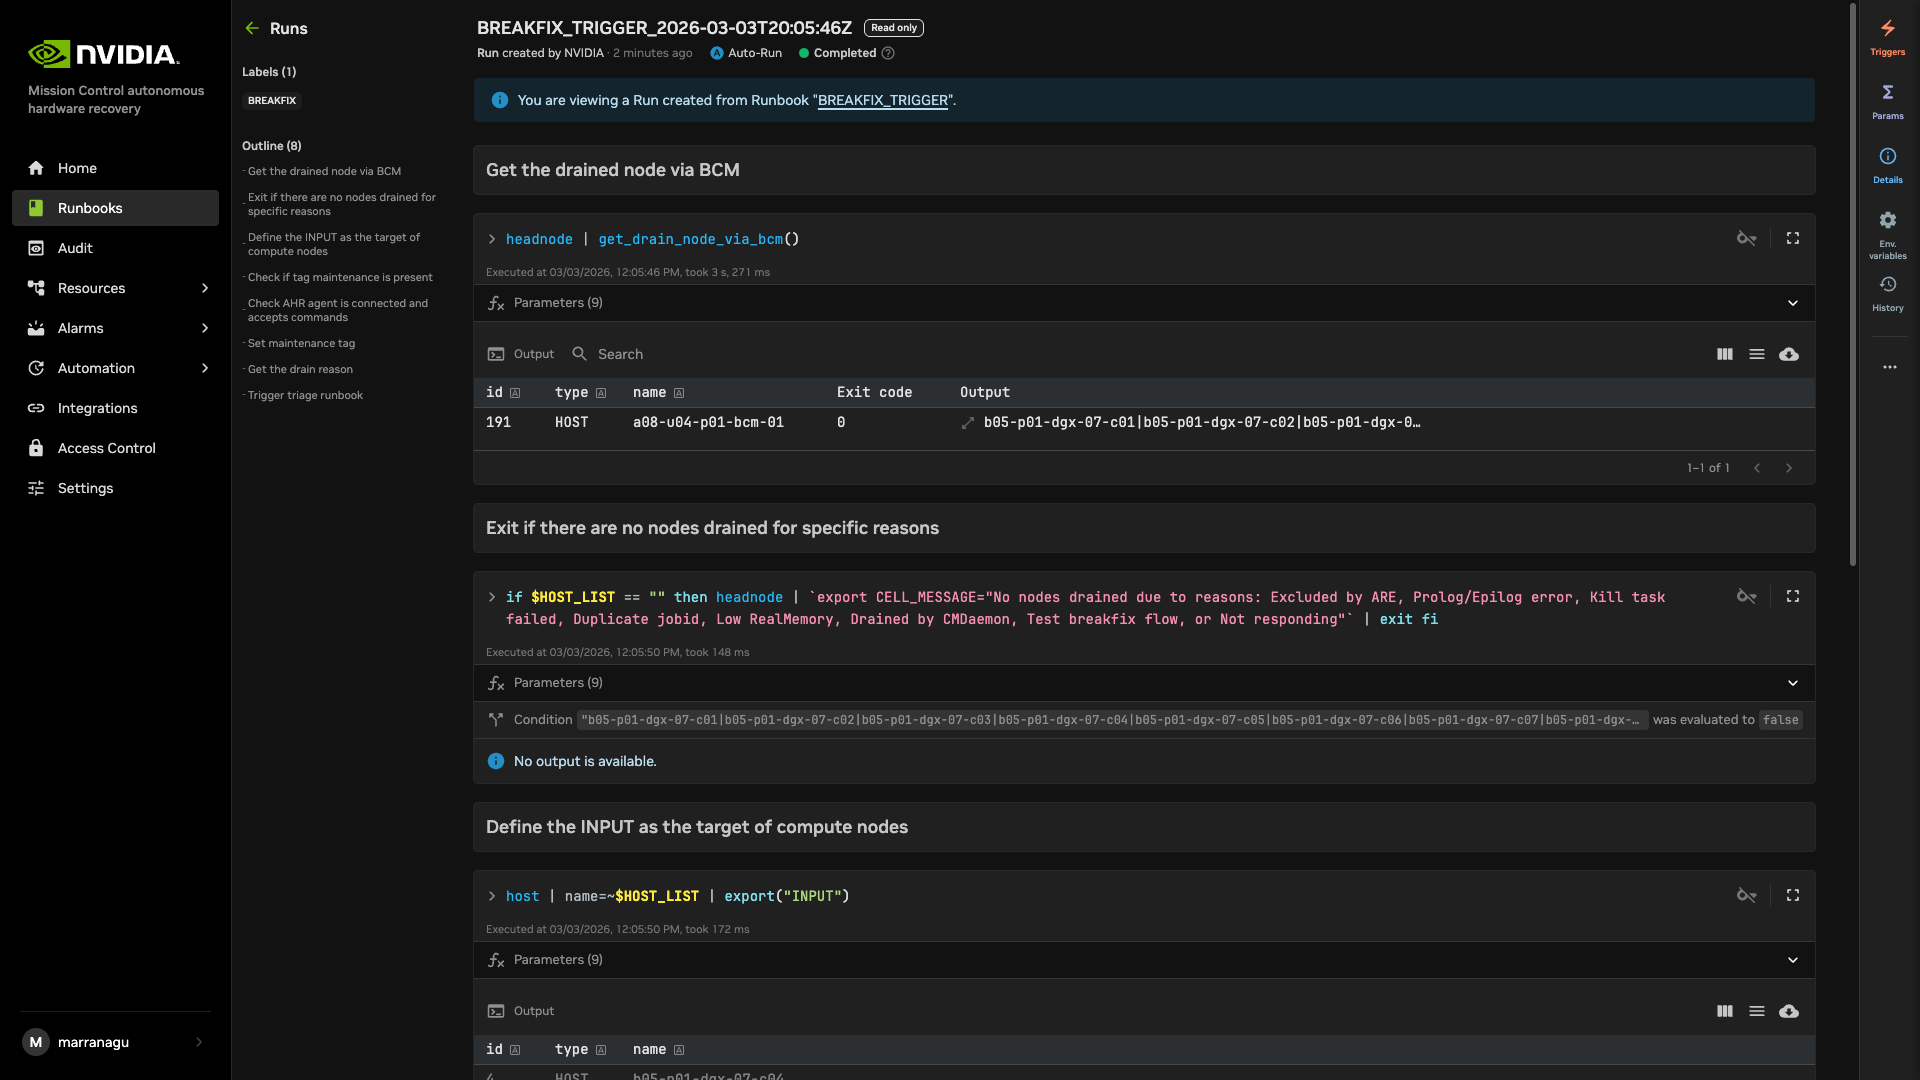
Main Content Area: This section displays the executed script or command. On the right side of the cell, you’ll find several control icons. While most icons were detailed in the previous section, the “fx” icon is particularly valuable as it displays all parameters along with input/output values for the specific cell when hovering over it.
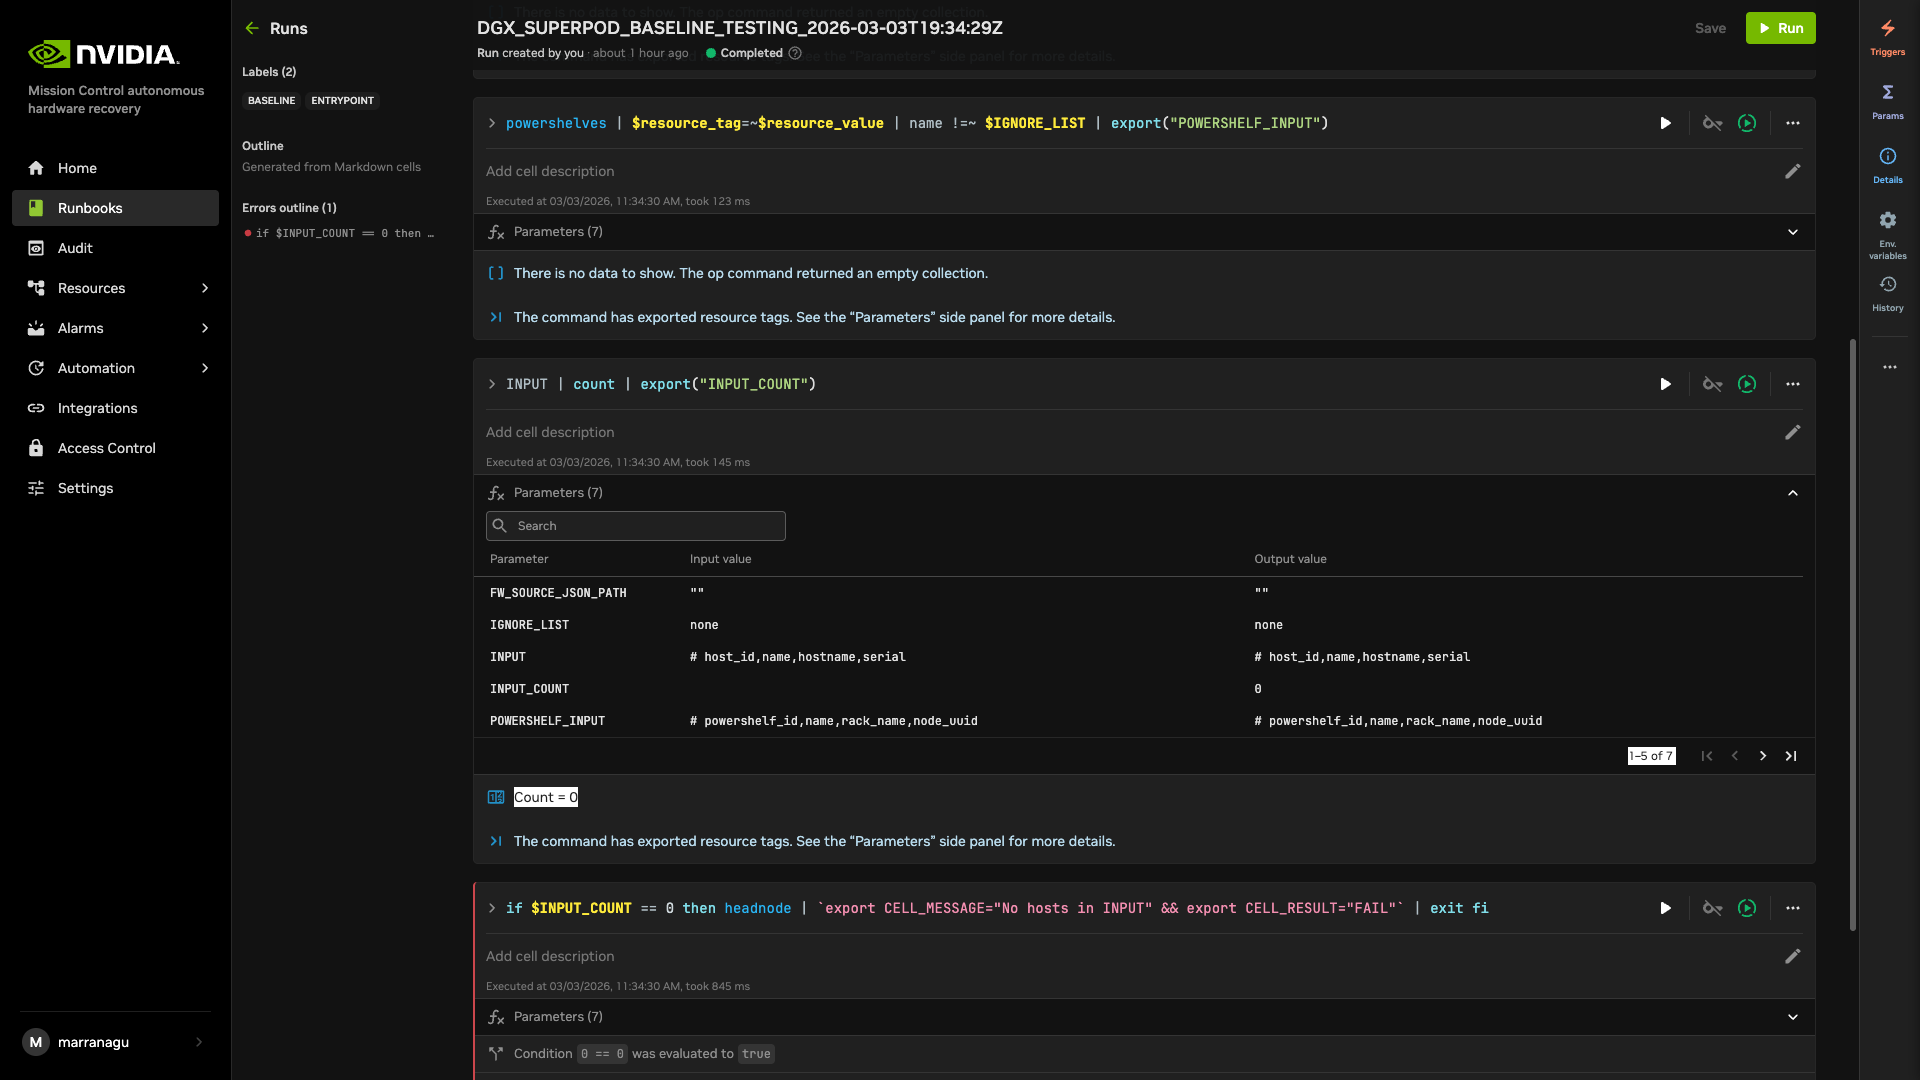
Execution Information Bar: Located in the middle of the cell, this light grey text line indicates the execution start time and duration of the operation.
Results Section: The bottom portion displays:
Exit code status
Execution location information
Complete command output (accessible by clicking the “Output” column contents)
Additional Features:
Configure output display preferences
Toggle the density
Download results in various formats using the download options menu
Streamlined Error Navigation: When a job contains numerous cells, manually checking for failures becomes inefficient. Use the “Error outline” feature in the middle panel to quickly locate problematic cells. Simply click any item in this list to automatically navigate to the corresponding failed cell.
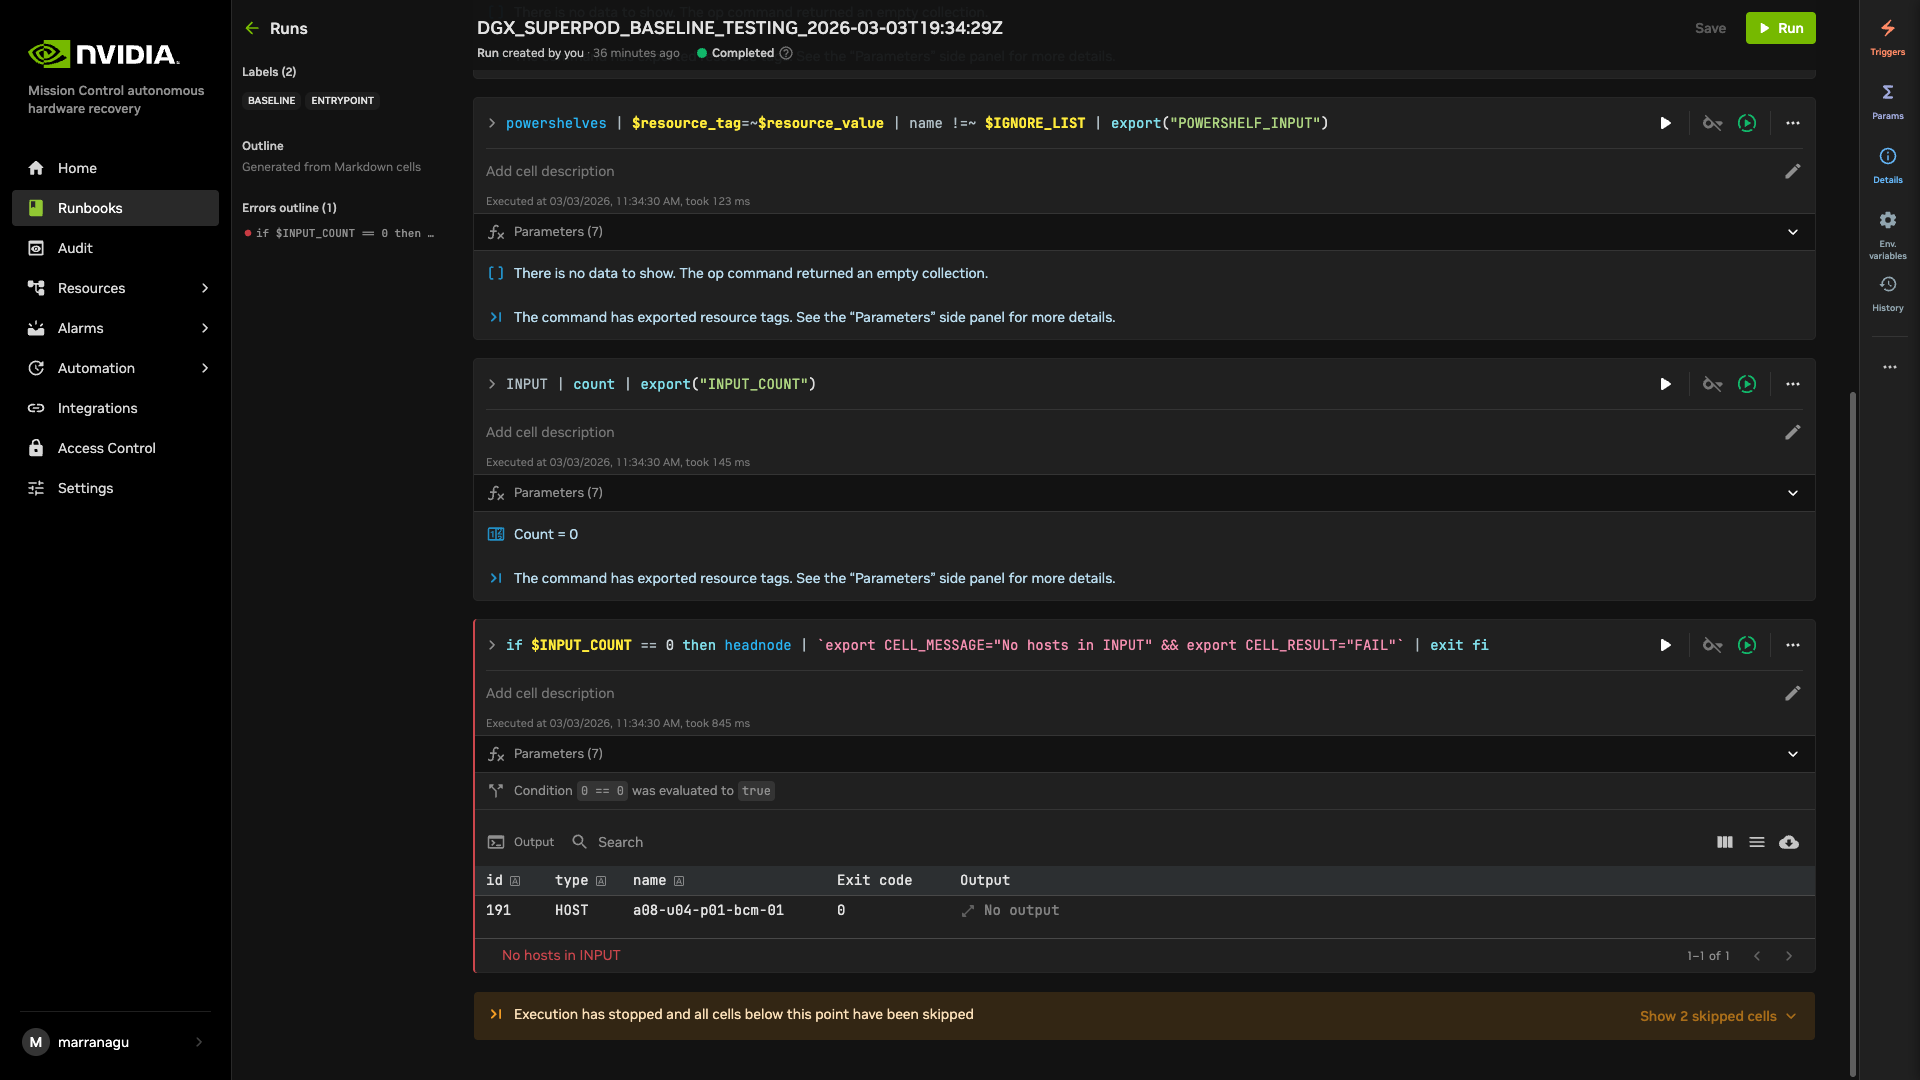
Notes: there are reports available for the major runbooks. Details can be found “Reports of Testings”
Handling Job Failures#
In the event of job or cell execution failures, the following remediation options are available:
Major Issue Resolution: Upon resolution of critical infrastructure issues (e.g., hardware replacement), a complete re-initialization of the SRT or MRT job is recommended.
Targeted Component Resolution: When specific components have been updated (e.g., firmware version upgrades), execute the relevant job or runbook within the existing session by selecting the “Run” button located in the upper-right interface section. This maintains all previously established parameters.
Individual Cell Correction: For isolated cell failures that have been addressed, execute the specific cell independently by activating the execution control (play button) positioned on the right margin of the cell interface. Note: This option might cause the difficulty to locate the job/run from the reports panel (Please refer Reports of Testing section below).
Firmware checks#
NVIDIA Mission Control autonomous hardware recovery includes firmware checks that extract the current firmware versions of the trays and switches, and compare them with the expected versions specified in the Source of Truth (SOT) file. The SOT file includes the expected versions for all components such as OS, HMC, ConnectX, etc., and is prepopulated. The SOT file can be obtained from the NVIS team.
Reports of Testings#
NVIDIA Mission Control autonomous hardware recovery provides reports for baseline testing, reflecting the status of nodes (compute and switches) at each test stage. These reports help identify and troubleshoot root causes.
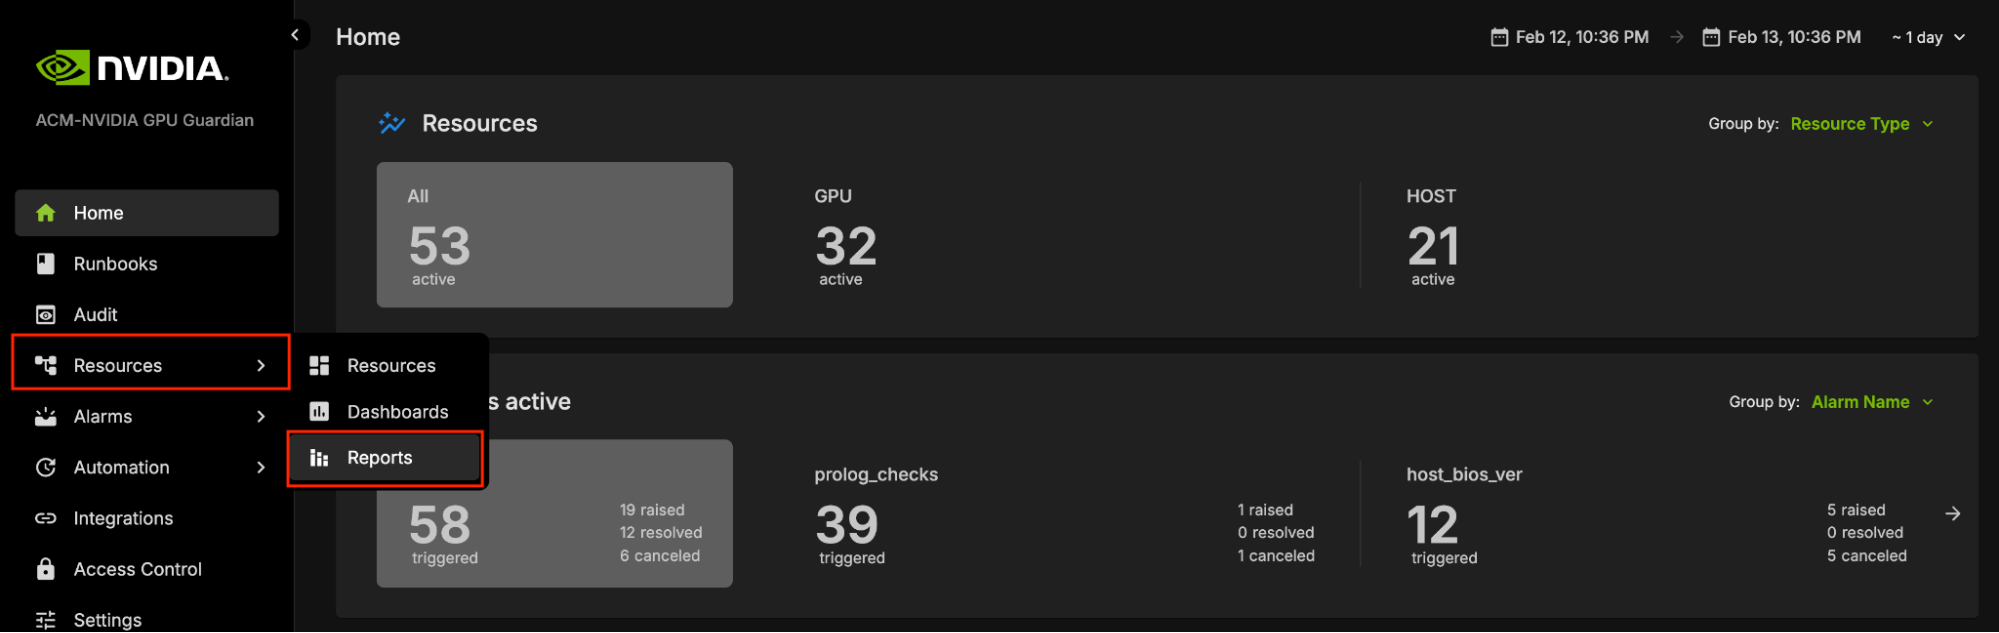
To access the NVIDIA Mission Control autonomous hardware recovery reports, click on Resources in the side menu, then select Reports.
The Landing page contains two tabs: Report Templates and Published Reports.
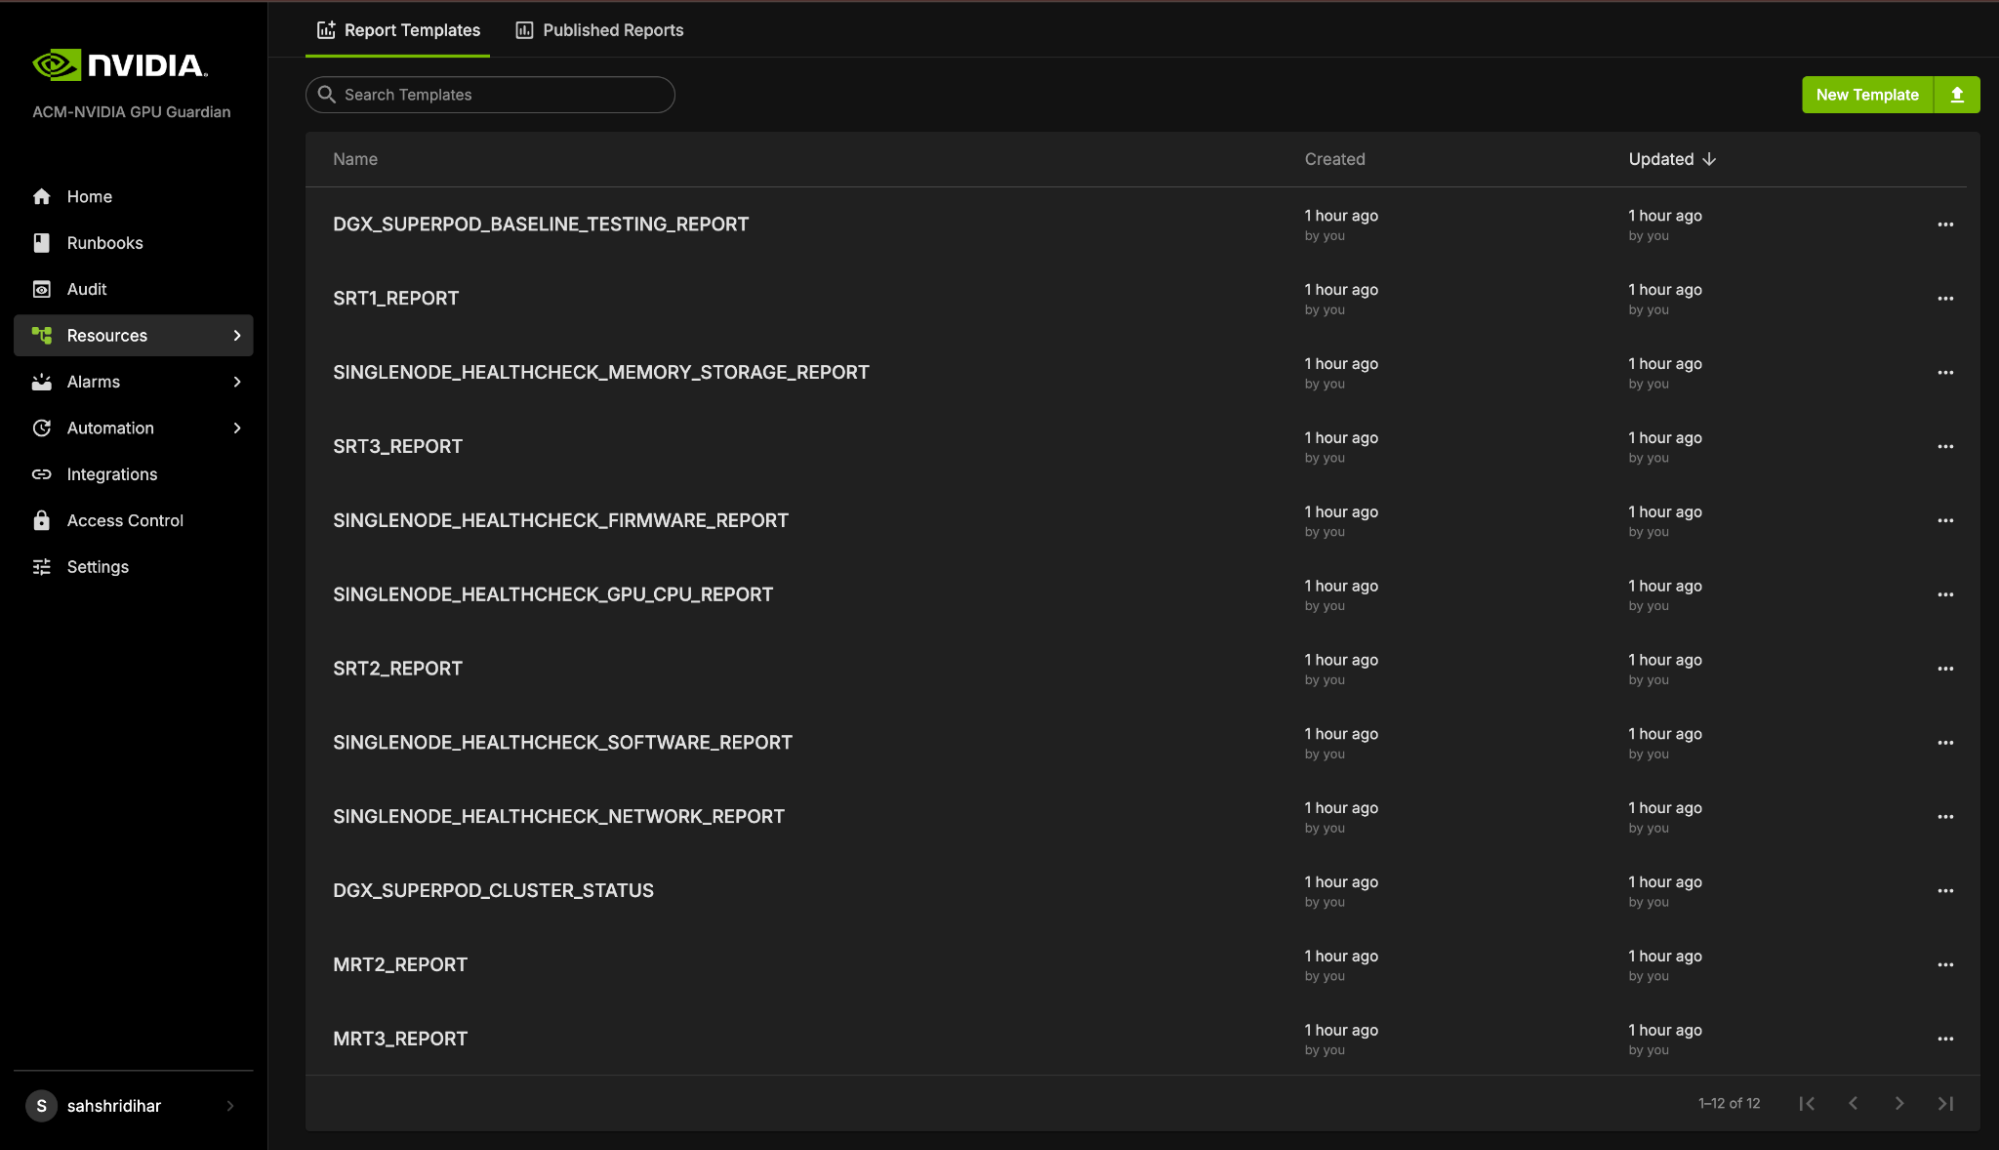
Report Templates provide templates for each stage of Baseline testing. These templates include bar graphs that display the PASS or FAIL status for different nodes during the tests. However, these templates are static and do not store any test data. This means that while you can view the templates, you cannot save or modify the test results within them.
Health Checks & Alerts#
NVIDIA Mission Control autonomous hardware recovery provides a full suite of automated health checks to detect failures at the tray, rack, and system levels for GB200. In addition, system wide health checks are performed by integrating with the UFM and NetQ network control planes. Health check data is reported back to BCM’s BaseView and/or the in-cluster LGTM stack. These health checks are performed at two layers: BCM job invocation, and as periodic health checks through NVIDIA Mission Control autonomous hardware recovery.
Alarms Dashboard#
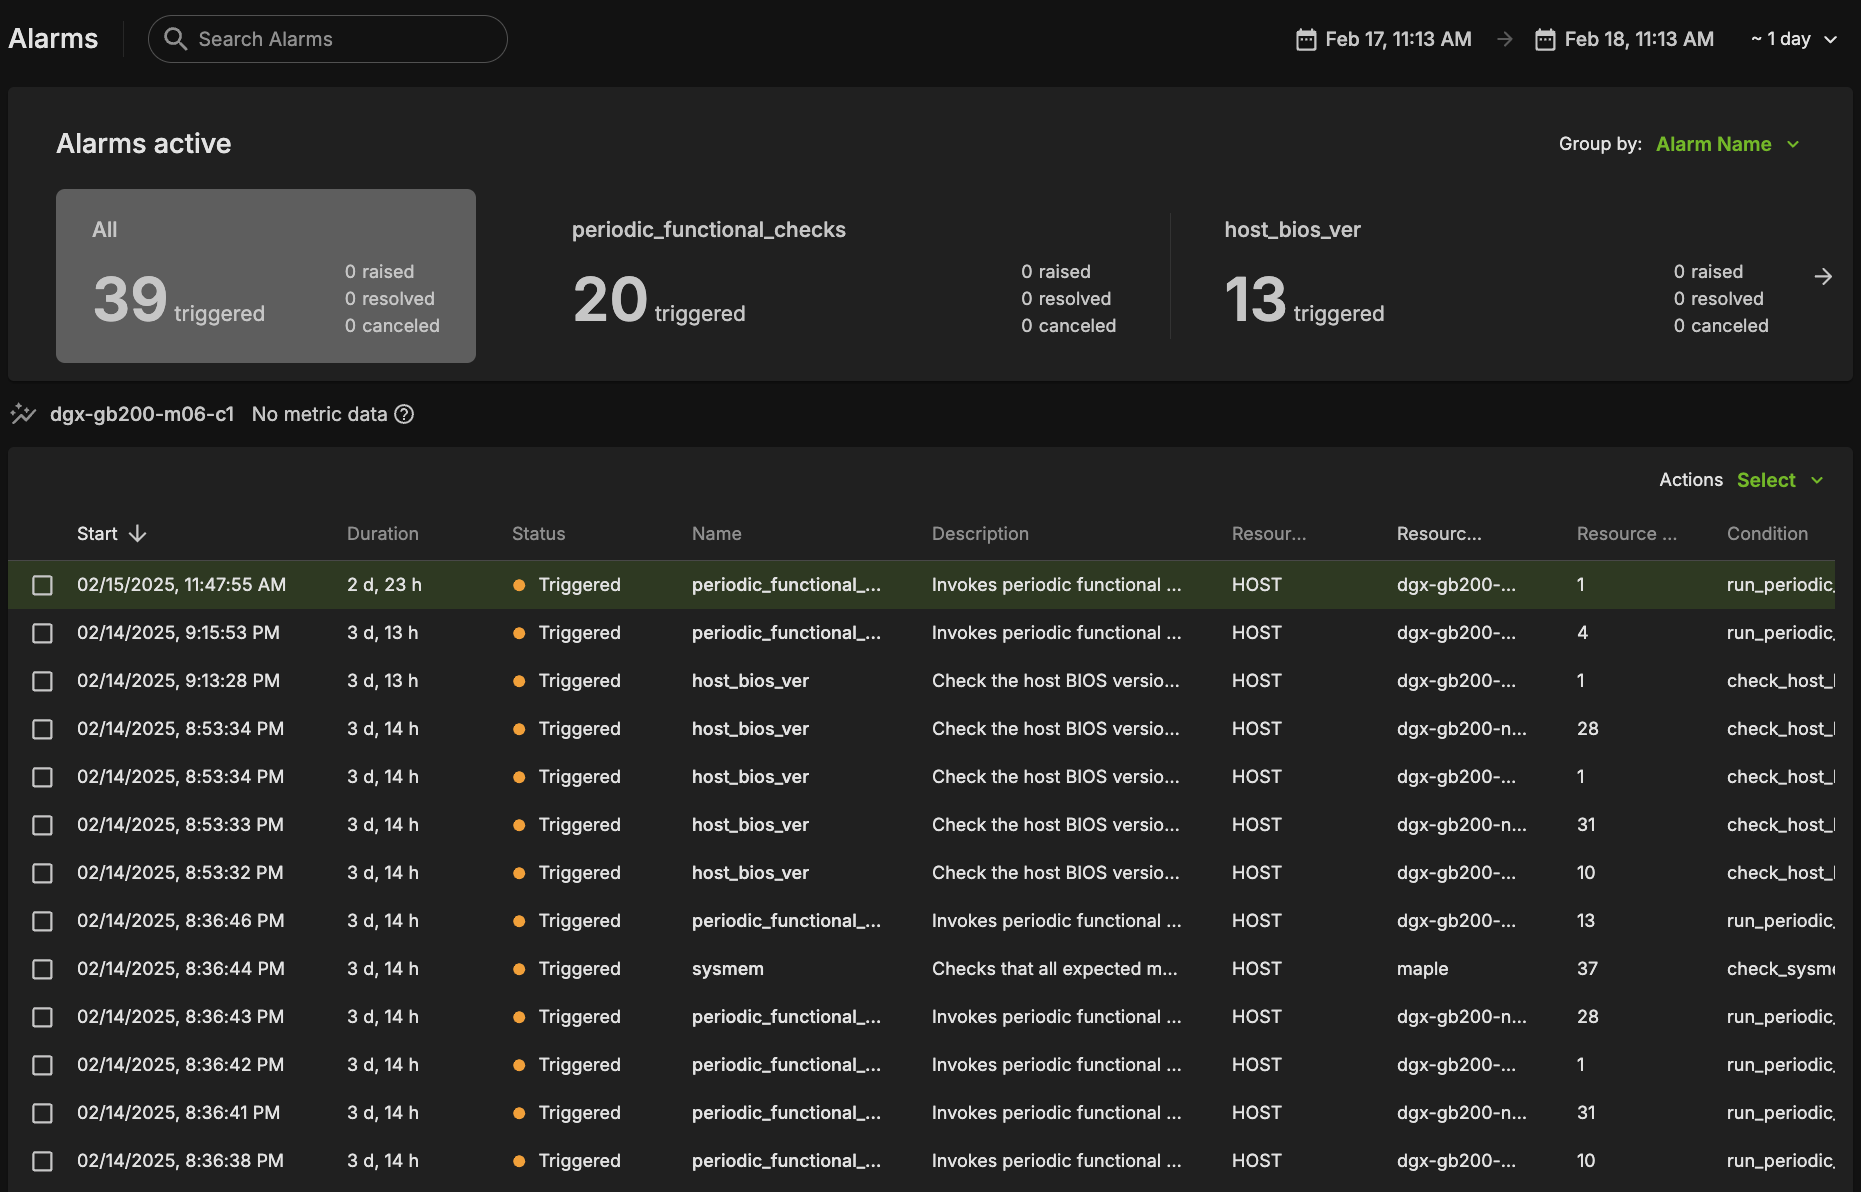
The alarms dashboard is an overview of all alarms and the state of your system. In this view, alarms are summarized by counts of alarms firing, alarms firing most frequently, and a configurable list of most frequently firing, canceled, or resolved alarms. This is meant to be a starting point for any investigations of possible issues with your systems, and you may click any alarm for further details.
BCM Slurm Job Lifecycle Checks (Prolog and Epilog)#
When a Slurm job is submitted, the Autonomous Hardware Recovery Agent automatically runs a set of checks at the start and end of the job to validate node health and stability. These are known as Prolog and Epilog checks.
Prolog Checks (run before the job starts):
If a check fails, the node is marked as DRAIN, and the job is re-queued.
If it passes, the job proceeds normally. Epilog Checks (run after the job finishes):
If a check fails, the node is also marked as DRAIN.
These scripts are automatically pushed to each node when the job runs, but they are not visible or configurable through the NVIDIA Autonomous Hardware Recovery UI. To review them, navigate to Shoreline_files/scripts/slurm in the NVIDIA Mission Control package.
Note: Prolog and Epilog checks are disabled by default and should only be enabled after the nodes are confirmed to be healthy. Use the following runbooks to manage them:
SLURM_CHECKS_ENABLE– enables the checksSLURM_CHECKS_DISABLE– disables the checks
Unlike the Prolog and Epilog checks, Periodic Checks are defined within the NVIDIA Mission Control autonomous hardware recovery interface as Alarms, and are detailed in the next section. They will be automatically enabled for racks that pass Single Rack Testing but may also be manually enabled or disabled for specific racks by running the ALARMS_ENABLE AND ALARMS_DISABLE runbooks.
Periodic Health Checks (Alarms)#
Periodic Checks are separate from Prolog and Epilog and run at regular intervals to monitor system health. These are managed as Alarms in the NVIDIA Autonomous Hardware Recovery UI and perform the following:
Automatically enabled for racks that pass Single Rack Testing
Automatically disabled during firmware upgrade and Break/fix
Can be manually enabled or disabled at any time
The alarm_base is the Resource Query they run against. To control them manually, use the following runbooks:
ALARMS_ENABLE– enables periodic alarms for selected racks. Note that a node having themaintenancetag will override these settings.ALARMS_DISABLE– disables them
Periodic Checks are fully visible and configurable in the UI through the alarm section. The following is a list of the configured Alarms, grouped by their check interval:
Frequent Checks (5m)#
The system will run the following checks to check your system on a regular, 5 minute time period.
bmc_sensors#
Checks the sensors from the Baseboard Management Controller (BMC) to ensure the proper data is returned.
sysmem#
Checks that all expected memory DIMMs are present.
dns_host#
Checks the DNS configuration and resolution for the host.
eth_state#
Checks that the ConnectX devices are present, active, and in the physical LinkUp state using ibstat, and also matching the expected transfer rate.
raid_count#
Checks that the raid configuration matches the expected mdstat configuration.
gpu_temp_history#
Checks System Event Log (SEL) history looking for GPU temperature issues.
gpu_alloc_temp#
Checks if the GPU temperatures are above a threshold.
periodic_bmc_host_checks#
The following groups of periodic functional checks are a subset of the BCM Prolog checks that run at predefined intervals as NVIDIA Mission Control autonomous hardware recovery Alarms. These checks consist of:
check_bmc_ipmi_version : Checks BMC IPMI version against an expected value
check_nvidia_module_loaded : Verifies the NVIDIA module is loaded in the host OS
check_host_os_version : Verifies the DGX OS version matches the expected value
check_nvsm_status : Verify the NVSM service is currently active
periodic_cpu_mem_checks#
The following groups of periodic functional checks system memory:
check_cpu_health : Verifies CPU sockets and cores are present and online
check_dimm_count : Checks that all expected memory DIMMs are present
check_dimm_size : Checks that the size of each memory DIMM matches the expected values
check_memory_swap_size : Checks that the memory swap size matches the expected value
periodic_gpu_nvlink_checks#
The following groups of periodic functional perform NV Link related checks:
check_gpu_pci : Checks that all GPUs are present on the lspci interface and with the correct link width and speed
check_gpu_error : Checks GPUs for ECC errors, retired pages, and throttles present
check_gpu_powerstate : Checks the powerstate for each GPU and compares against an expected value
check_gpu_param : Checks that specified GPU parameters are present and correct for the host
check_nvlink_health : Checks that links are active for each GPU, the speed is correct, fabric registration has been completed, are running at full bandwidth, and belong to the same NVLink domain and partition.
check_gpu_topology :Checks that there are no issues with the p2p topology within the node
check_gpu_telemetry : Checks that various sensors can be successfully read from the GPU using nvidia-smi
check_gpu_power_limit : Checks that the power limit is correct for each GPU
check_nvidia_inforom_ver : Checks that the inforom version is correct for each GPU
check_gpu_clock_info :Checks that the maximum clock speed is correct for each GPU
check_remapped_row : Checks if any remapped row events have occurred
periodic_network_checks#
check_ib_ber_and_ro : Checks if the PCI_WR_ORDERING field is set to relaxed and also the bit error rate of the CX7 using mlxlink
check_ib_port_rcv_errors :Check Infiniband devices port RCV errors
check_ib_cables : Checks the cable info using mlxcables
check_bf3_speed : Validates that the BlueField devices are operating at the correct speed and that the proper number of devices are in the “Up” state. This check will run, but never fail
periodic_storage_checks#
check_pex_switch_health : Checks that the PEX switches are present, have the correct PCIe link speed and width, and the downstream devices have enumerated to lspci
check_cx_config : Checks that the ConnectX devices have the correct PCIe link speed and width using lspci and ACS config using setpci
check_nvme_health : Checks that the PCIe link speed and width of each NMVe device matches the expected value
check_storage_dir : Checks that the host has functional access to the home storage
check_storage_util : Checks that the used local storage on the host is below a given threshold
periodic_error_checks#
Checks journald for machine check events, Xid, AER, CPER, I/O, GPU fell off the bus, and other generic errors.
Hourly Checks#
nfs_mounts#
Verifies required mount points.
daily_informational#
This setting checks for issues where the severity and remediation may not be critical. This alarm will only be triggered once per day, and results may be viewed in the resulting runbook run.
check_sel_event : Read the SEL events from the BMC and ensure none are asserted
check_dgx_os_version : Verifies the DGX OS version matches the expected value
check_gpu_vbios_ver : Checks the VBIOS version of the GPUs and compares against an expected value
check_nvme_fw_ver : Checks that the FW version for each NVMe matches an expected value
check_kernel_commandline_opt : Verifies the specified kernel option(s) is present in the current kernel’s boot parameters
check_host_bios_ver : Verifies the system’s BIOS version
check_kernel_ver : Verifies the current version of the Linux kernel
check_host_package_versions : Queries the installed packages on the host
nv_container_cli_info : Retrieves information about the NVIDIA container CLI (driver and devices)
Daily Checks#
cpu_stepping#
Checks that the CPU stepping parameter is correct for each CPU.
numa_node_count#
Checks that the correct count of Non-uniform memory access (NUMA) nodes are configured with the CPU cores.
NVIDIA Mission Control autonomous hardware recovery Alarm Configuration#
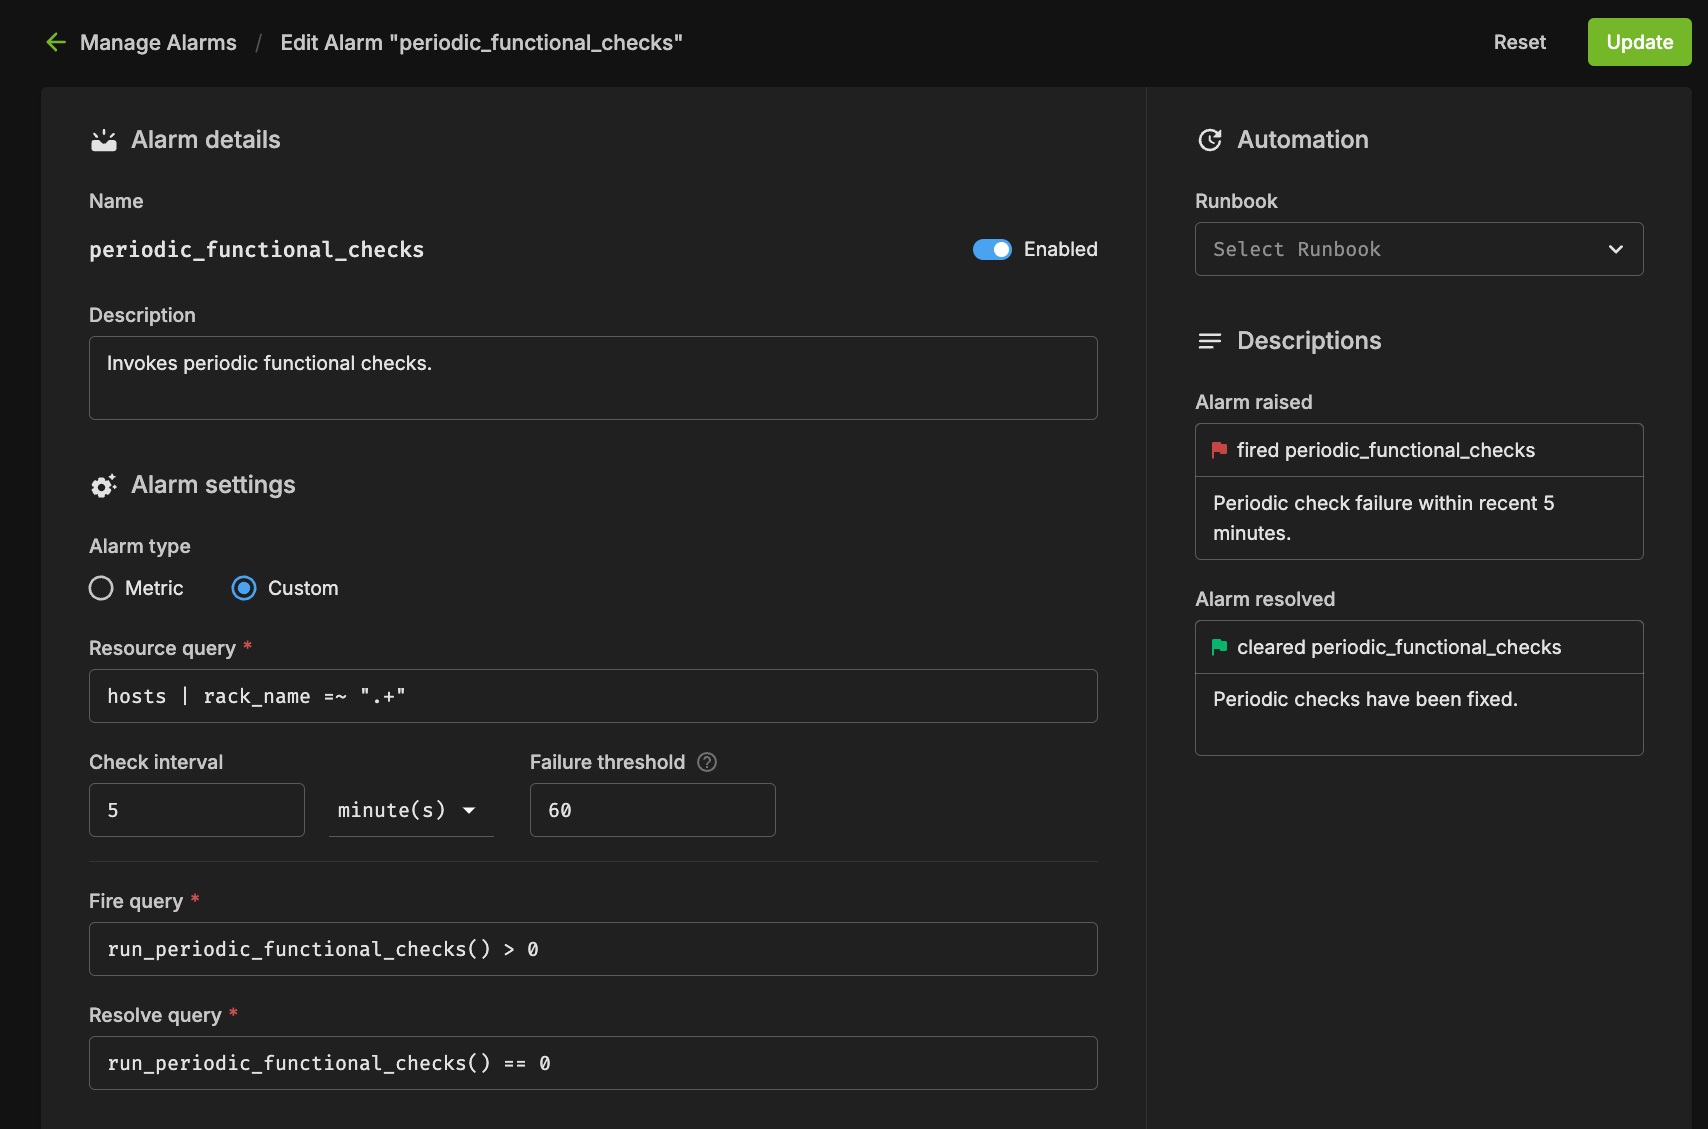
There are several components to an alarm, with the key pieces being the Resource Query, Fire Query, Resolve Query, Check Interval, and Automation. An example configuration is shown in the following figure.
Resource Query#
The resource query allows you to customize the resources (hosts, pods, gpus) on which the checks will be performed. In the preceding example, the `hosts | rack_name =~ “.*”` will only check alarms on hosts which have a value set for the “rack_name” tag.
Fire Query#
The fire query is a condition that, when true, will cause the alarm to begin firing. It will be run at each interval.
Resolve Query#
Similar to the fire query, the Resolve query is a condition that will resolve the alarm when true. Resolving an alarm will cause firing to cease and the state to change to Resolved.
Check Interval#
The interval at which the fire and resolve queries are checked.
Alarm States#
If an Alarm has triggered, it will be in one of the following three states:
Triggered#
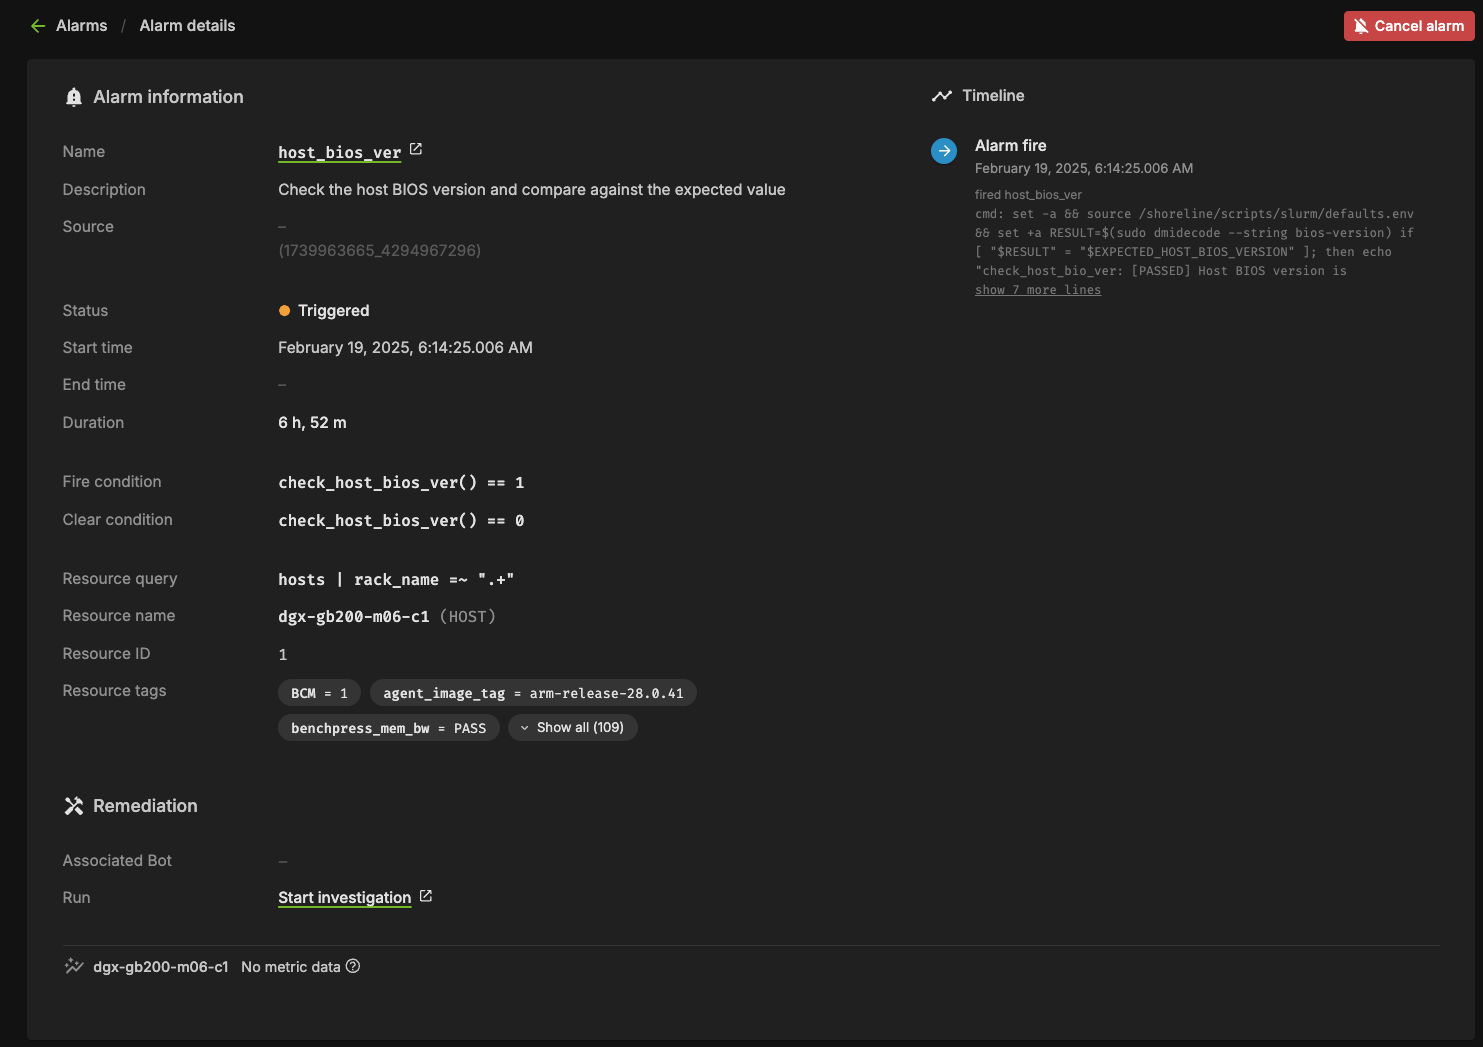
This state means the alarm is currently firing. Any automation (break/fix) will subsequently be invoked to remediate any issues, potentially resolving the alarm. Alternatively, the user could cancel the alarm by clicking the “Cancel alarm.”
Clicking into the triggering alarm will give you more details on what caused the alarm, metadata and resources relating to the alarm, and will also allow you to view log output from the check itself.
Resolved#
When the clear query of an alarm evaluates to true for a firing alarm, the status will be changed to Resolved. Automation triggered runbooks will invoke break/fix operations that should be configured to result in a resolved alarm.
Canceled#
When a user cancels an alarm from the dashboard, or from the triggered alarm itself, its state will become Canceled. Also, if an alarm configuration is changed for an alarm in the Triggered state, it will be canceled since it was triggered against a defunct configuration.
Firmware Upgrades with NVIDIA Mission Control autonomous hardware recovery#
NVIDIA Mission Control autonomous hardware recovery provides functionality for upgrading, cycling, and verifying firmware and the corresponding OS within your GB200 racks. The four distinct components for which firmware can be upgraded using this process are:
Compute trays
Switches
Mellanox
NVOS
The workflow invocation is performed using autonomous hardware recovery’s Runbooks. To view all Firmware upgrade related runbooks, you may search using the FIRMWARE_UPGRADE label.
Note
To do firmware updates within Base Command Manager or the nvfwupd tool itself, refer to the NVIDIA DGX GB200/GB300 Firmware Update Guide.
NVIDIA Mission Control autonomous hardware recovery Break/Fix Workflow#
NVIDIA Mission Control autonomous hardware recovery provides automated break/fix workflows to handle tray failures for GB200. These workflows execute a series of diagnostic steps to determine the cause of the failure and take necessary repair steps and create Support tickets, when opted in to the support ticket service, for the issues that cannot be auto resolved.
The automated break/fix workflow is designed to efficiently diagnose and remediate issues, with clear paths for different failure scenarios and comprehensive validation to ensure systems are properly restored to service.
Key Features#
Automatic Detection: Identifies drained nodes without manual intervention
Intelligent Triage: Routes to appropriate diagnostic workflows based on failure symptoms
Comprehensive Diagnostics: Performs thorough hardware and software checks
Automated Remediation: Attempts to resolve issues without human intervention when possible
Detailed Reporting: Provides comprehensive logs for RMA or further troubleshooting
Entrypoint of Break/Fix Workflow#
A centralized automated break/fix interface has been established to facilitate streamlined diagnostics and remediation. This unified entry point provides comprehensive access to the break/fix framework, enabling efficient navigation and implementation of all remediation procedures.
Break/Fix Workflow Components#
The break/fix system consists of several key components that work together to diagnose and remediate issues with compute trays. The following is a detailed explanation of each component:
BREAKFIX_TRIGGER#
The entry point runbook that:
Runs automatically every five minutes using the time trigger
Checks for any drained nodes in BCM
Initiates the triage process for affected nodes
Routes to the appropriate diagnostic workflow
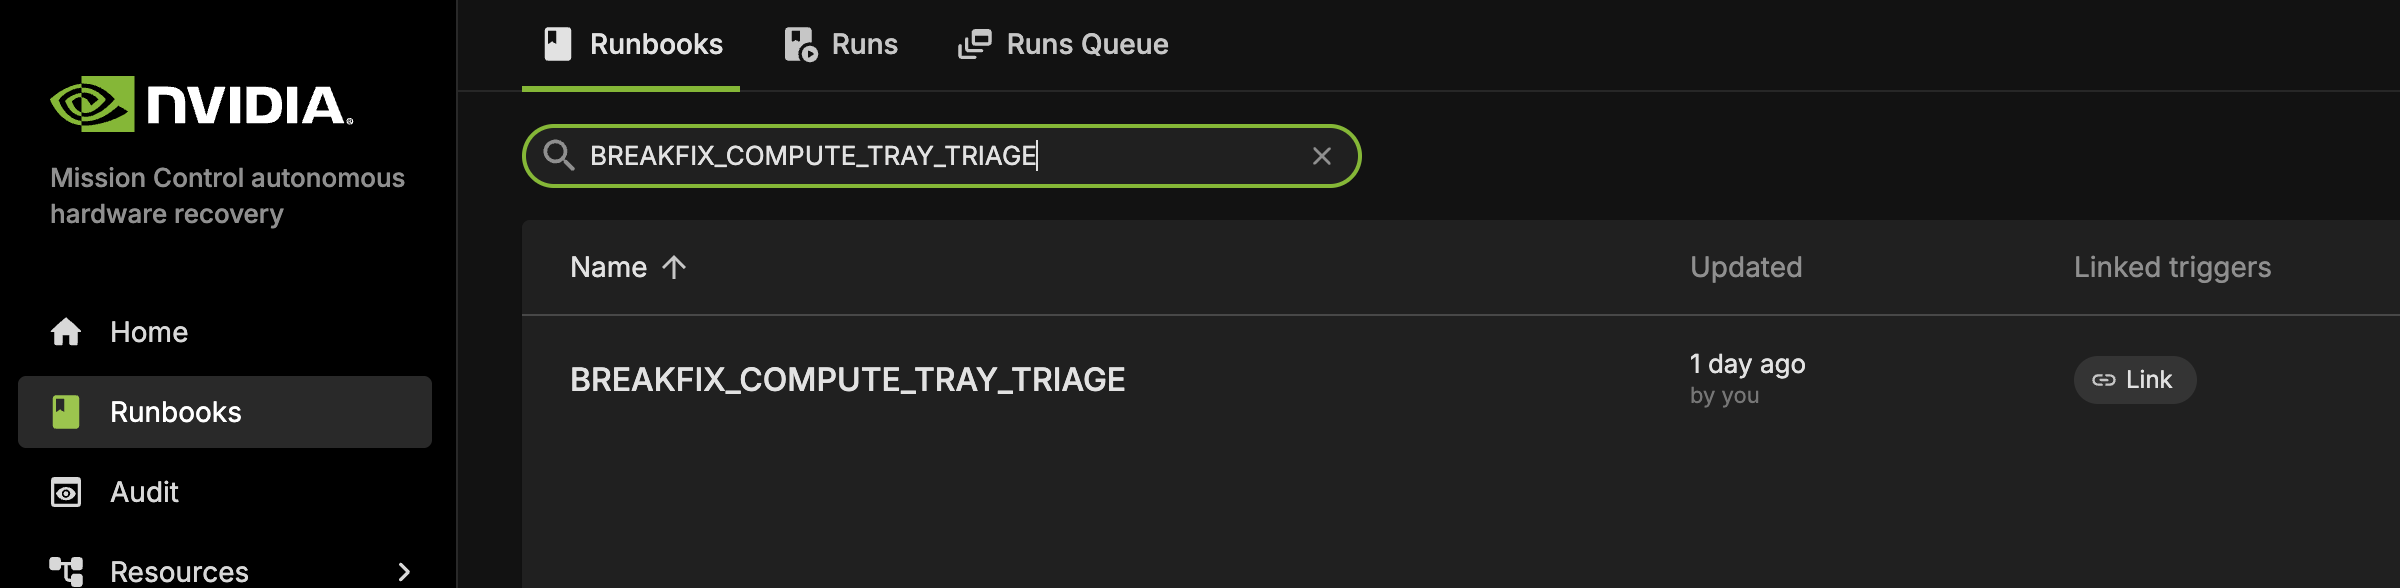
BREAKFIX_COMPUTE_TRAY_TRIAGE#
This runbook is automatically triggered by BREAKFIX_TRIGGER and performs comprehensive triage on drained compute trays.
GPU_RECOVERY#
This specialized diagnostic runbook is automatically invoked by BREAKFIX_COMPUTE_TRAY_TRIAGE when GPU-related issues are detected.

BREAKFIX_COMPUTE_TRAY_VALIDATION#
This runbook is automatically executed after remediation actions to validate system health as part of the automated workflow following triage and recovery operations.

BREAKFIX_DIAG_DUMP#
This runbook is automatically triggered when validation tests fail, collecting comprehensive diagnostic information for support ticket creation.

NVIDIA Mission Control autonomous hardware recovery Break/Fix Post RMA#
The NVIDIA Mission Control autonomous hardware recovery Break/Fix Post RMA workflow automates the process of bringing hardware components back into service after a Return Merchandise Authorization (RMA) replacement. This workflow ensures that replaced hardware is properly configured, firmware is updated to the correct versions, and the component is thoroughly validated before returning to production.
Key Features#
Automated Configuration: Configures replaced hardware components with proper settings
Firmware Updates: Updates firmware to match the required versions for the environment
Boot Order Correction: Ensures proper boot sequence for reliable operation
Comprehensive Validation: Performs thorough testing to verify hardware functionality
Seamless Integration: Automatically returns validated hardware to service
Post RMA Workflow Components#
The Post RMA workflow consists of several key steps that ensure replaced hardware is properly configured and validated:
Physical Replacement Procedures#
Compute Tray Removal: Detailed step-by-step instructions for safely removing failed compute trays, including power down procedures, cable disconnection, and proper handling
Compute Tray Installation: Comprehensive installation guide covering component migration (M.2 boot drive, E1.S cache drives, HMC, BMC, TPM), rail installation, and cable reconnection
Component Migration: Transfer of critical components from old tray to new tray while maintaining proper slot assignments and ESD protection
BCM Inventory Update#
ONLY REQUIRED FOR NEW HARDWARE: Updates BCM inventory information using the
BREAKFIX_POST_RMA_UPDATE_BCM_INVENTORYrunbook when a new compute tray is installedSkip this step for repaired trays as MAC addresses remain unchanged
Ensures MAC addresses and other hardware identifiers are correctly registered in BCM (new MAC addresses are provided by the Enterprise Support team who manage serial numbers and asset inventory for customer deployments)
Enables proper management and monitoring of the replaced hardware
BMC Credential Management#
Creates necessary BMC credential files for secure access to hardware components
Establishes secure communication channels for configuration operations
BlueField Configuration#
Checks if BlueField devices are in NIC mode
Enables OPROM on BlueField devices to ensure proper initialization
Configures hardware components for optimal operation
Boot Order Correction#
Ensures the boot sequence is properly configured
Prevents boot failures and improves system reliability
Performs power reset through BMC after configuration changes
Connectivity Verification#
Verifies SSH connectivity to compute nodes
Checks BCM device status to ensure proper registration
Confirms network accessibility before proceeding with firmware updates
Firmware Updates#
Compute Firmware: Updates compute firmware using the
BREAKFIX_FIRMWARE_UPGRADE_COMPUTE_POST_RMArunbookMellanox Firmware: Updates BlueField and ConnectX firmware using the
BREAKFIX_FIRMWARE_UPGRADE_MELLANOX_POST_RMArunbookEnsures all hardware components are running the correct firmware versions
System Validation#
Waits for hosts to come back online after each firmware update cycle
Verifies agent connectivity to ensure management capabilities
Runs comprehensive validation tests using
BREAKFIX_COMPUTE_TRAY_VALIDATIONOpens nodes in BCM and validates Slurm readiness for successful nodes
Post RMA Workflow Results#
After successful completion of the Post RMA workflow:
Hardware Configuration:
Physical components (M.2, E1.S drives, HMC, BMC, TPM) properly migrated to new tray
BlueField devices configured in NIC mode with OPROM enabled
Boot order corrected for reliable system startup
Power management and connectivity verified
Firmware Updates:
Compute firmware updated to specified versions using
BREAKFIX_FIRMWARE_UPGRADE_COMPUTE_POST_RMAMellanox BlueField and ConnectX firmware updated to specified versions using
BREAKFIX_FIRMWARE_UPGRADE_MELLANOX_POST_RMAAll firmware components validated against expected versions
System Integration:
SSH connectivity to compute nodes verified
BCM device status confirmed and registered
Agent connectivity established for management capabilities
Comprehensive validation tests passed using
BREAKFIX_COMPUTE_TRAY_VALIDATION
Service Restoration:
Nodes automatically opened in BCM for job scheduling
Slurm readiness validated for successful nodes
Hardware returned to production service automatically
Failure Handling: For any components that fail validation:
System maintains them in non-production state with maintenance tags
Detailed error logs available in runbook execution cells
Manual intervention required to address specific failure causes
Nodes remain drained until issues are resolved
NVIDIA Mission Control autonomous hardware recovery Domain Triage#
The BREAKFIX_DOMAIN_TRIAGE runbook provides manual diagnostics and troubleshooting for NVSwitch and NVLink domain-level issues. This workflow is only manually triggered on demand when domain-level problems are identified; it is not automatically triggered by BREAKFIX_TRIGGER (unlike the Break/Fix Workflow, which is triggered automatically). This workflow is designed to collect comprehensive diagnostic information when problems are detected at the domain level, facilitating efficient resolution and minimizing system downtime.
Domain Triage Workflow Components#
The Domain Triage workflow consists of several key steps that ensure thorough diagnosis of NVSwitch and NVLink domain issues:
Compute Node Management#
Adds AHR maintenance tags to all compute nodes in the affected rack
Drains compute nodes from Slurm to prevent workloads from running during diagnostics (no jobs will be scheduled on the entire rack)
NVSwitch Credential Management#
Retrieves BMC credentials for NVSwitches from BCM
Establishes secure access to NVSwitch components for diagnostics
Collects system rack serial numbers for identification
Diagnostic Data Collection#
Dumps BMC logs from NVSwitches to capture hardware-level events
Runs NVDebug tool to collect detailed information about NVSwitch status
Executes Nvlmapper tool to check NVLink status and connectivity
Runs PartnerDiag for comprehensive hardware diagnostics
Case Management#
Collects and organizes all diagnostic logs into a single package
Creates a Support ticket with all relevant diagnostic information
Attaches detailed logs to facilitate efficient troubleshooting
NVIDIA Mission Control autonomous hardware recovery Break/Fix Switch Post RMA#
Switch Post RMA Introduction#
The NVIDIA Mission Control autonomous hardware recovery Break/Fix Switch Post RMA workflow automates the process of bringing NVSwitch components back into service after a Return Merchandise Authorization (RMA) replacement. This comprehensive workflow includes both physical switch tray replacement procedures and automated software configuration to ensure that replaced switch hardware is properly configured, firmware is updated to the correct versions, and the component is thoroughly validated before returning to production.
Key Features#
Physical Replacement Procedures: Detailed instructions for safe switch tray removal and installation with proper cooling and power management
Compute Node Management: Adds maintenance tags and drains compute nodes during switch replacement to prevent workload interference
Switch Connectivity Verification: Establishes and verifies SSH connectivity to replaced switch components
Factory Reset and ZTP: Performs factory reset and monitors Zero Touch Provisioning for clean initialization
Firmware Updates: Updates switch firmware to match required versions using
BREAKFIX_FIRMWARE_UPGRADE_SWITCH_POST_RMASystem Validation: Comprehensive testing including NMX controller verification, compute node reboots, and compute tray validation
Switch Post RMA Workflow Components#
The Switch Post RMA workflow consists of several key steps that ensure replaced switch hardware is properly configured and validated:
Physical Replacement Procedures#
Switch Tray Removal: Detailed instructions for powering down the entire rack, cooling procedures, cable disconnection, and safe tray removal
Switch Tray Installation: Comprehensive installation guide covering rail migration, tray insertion, cable reconnection, and power-on sequence
Compute Node Management#
Adds maintenance tags to all compute nodes in the affected rack
Drains compute nodes from Slurm to prevent workload interference during switch replacement
BCM Inventory Update#
ONLY REQUIRED FOR NEW HARDWARE: Updates BCM inventory information using
BREAKFIX_POST_RMA_UPDATE_SWITCH_BCM_INVENTORYwhen a new switch is installedSkip this step for repaired switches as MAC addresses remain unchanged
Ensures BMC MAC and COMe MAC addresses are correctly registered in BCM (new MAC addresses are provided by the Enterprise Support team who manage asset inventory for customer deployments)
Enables proper management and monitoring of the replaced switch hardware
Switch Connectivity and Configuration#
Retrieves switch IP and credentials from BCM
Verifies SSH connectivity to the switch node
Updates ZTP settings in BCM with NVOS image file configuration
Ensures the switch is reachable for configuration operations
Factory Reset and ZTP#
Performs factory default reset on the switch
Monitors Zero Touch Provisioning (ZTP) status until successful completion
Creates support tickets if ZTP fails
Switch BMC Credential Management#
Retrieves BMC credentials for NVSwitches from BCM
Establishes secure access to switch components for diagnostics
Collects system rack serial numbers for identification
Firmware Updates#
Upgrades switch firmware to the specified version using
BREAKFIX_FIRMWARE_UPGRADE_SWITCH_POST_RMAVerifies switch connectivity after firmware updates
System Health and Validation#
Performs switch tray health checks
Verifies NMX-C and NMX-T controller status on the active switch node
Reboots all compute nodes in the rack to ensure proper connectivity
Waits for agent connectivity to confirm successful recovery
Validates there are no inactive NVLinks
Runs comprehensive compute tray validation using
BREAKFIX_COMPUTE_TRAY_VALIDATION
B200#
Dashboard#
NVIDIA Mission Control autonomous hardware recovery dashboard provides a comprehensive view of the status of all resources in the cluster, displaying the progress of testing at various stages for each node (control, compute and switch nodes). It shows which tests are completed, which ones have passed, and which have failed. This allows users to easily track the overall health and status of the cluster, identify any issues, and assess the readiness of each resource.
Navigating to Dashboards#
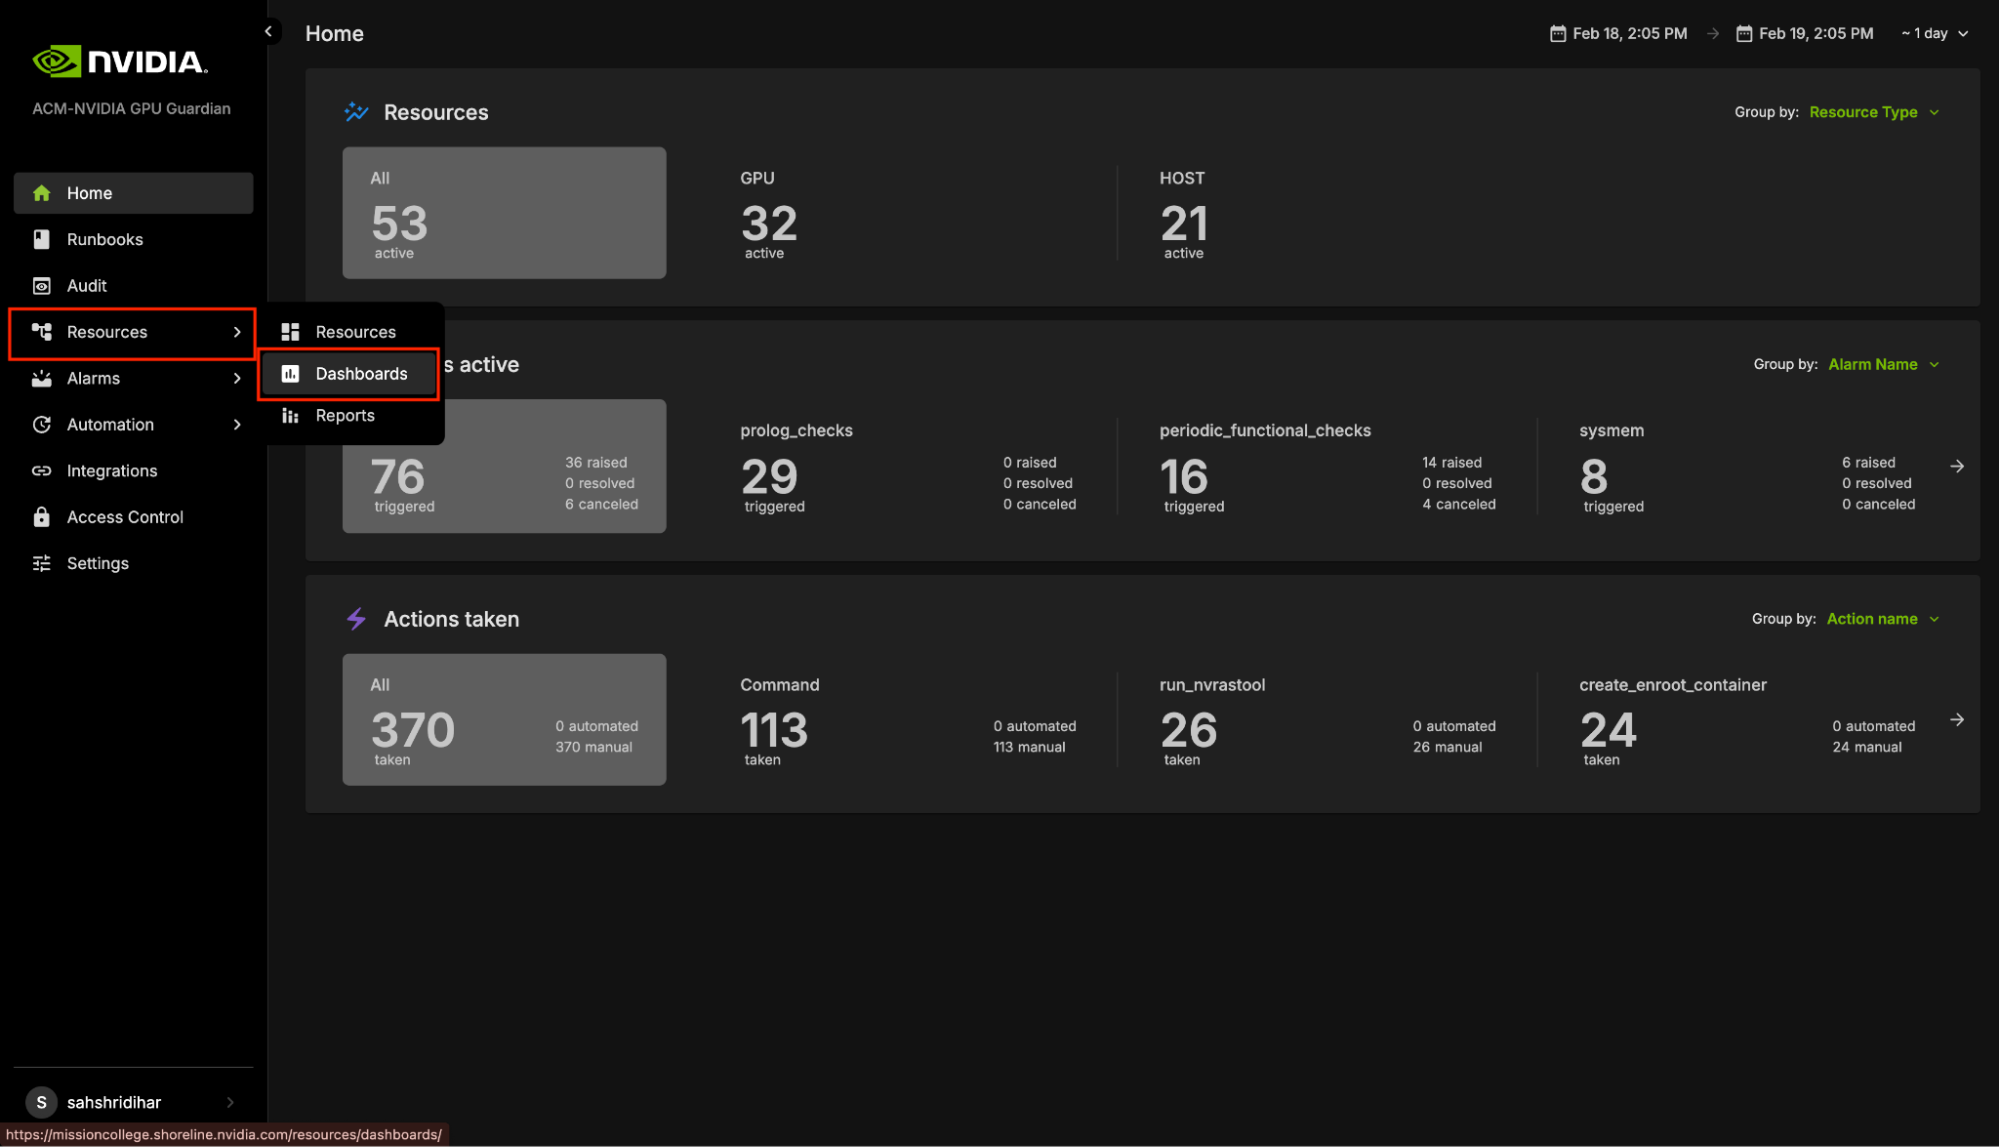
Visit the NVIDIA Mission Control autonomous hardware recovery homepage, navigate to the ‘Resources’ menu, and click on ‘Dashboards’ to access the dashboard page.
The Landing page contains two tabs: Dashboards and Dashboard Views.
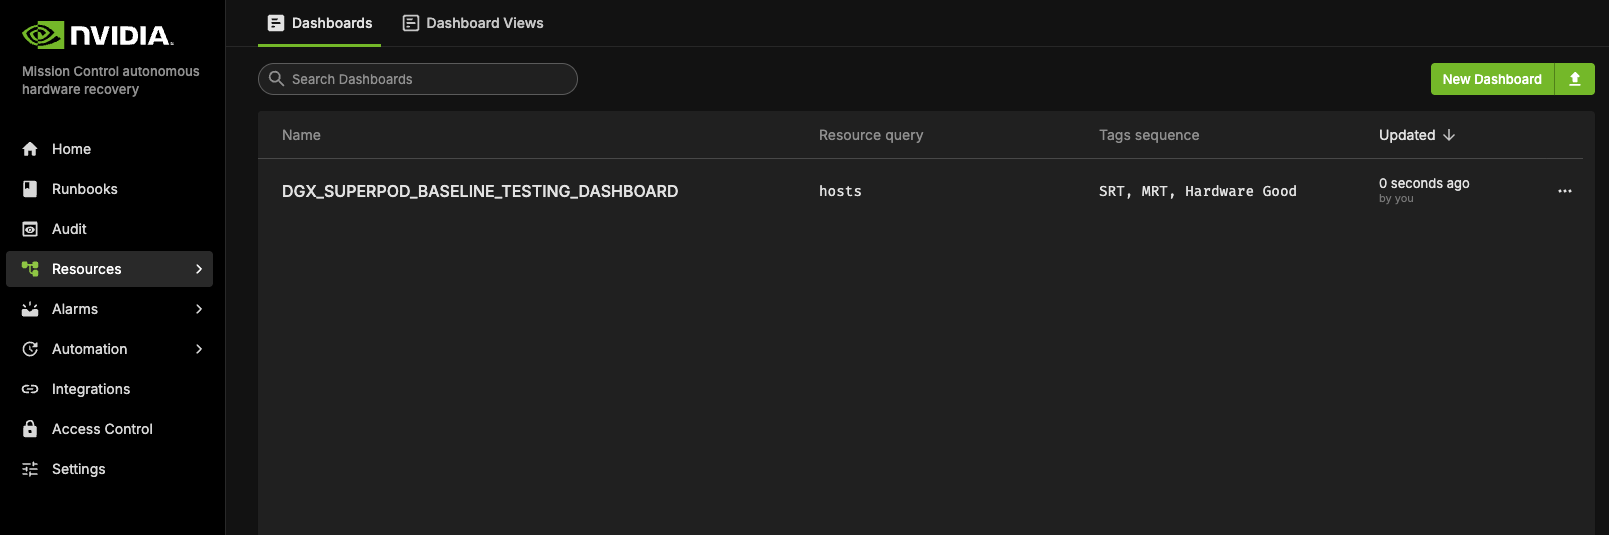
The Dashboards lists all the Dashboards available. All these dashboards reflect the current status of the cluster and the test status.
A Dashboard View is a snapshot of the Dashboard that captures the data at a specific point in time. This snapshot remains static, preserving the exact state and data of the Dashboard as it appeared at that moment, regardless of any future changes or updates to the live data.
Cluster Validation#
The NVIDIA Mission Control autonomous hardware recovery portal enables efficient automation of baseline testing procedures for DGX B200 systems. This comprehensive testing framework can be flexibly executed across various scales of infrastructure, from individual compute nodes to multiple node configurations. The system performs extensive validation of critical compute node components, including CPU/GPU/Memory/storage functionality, network connectivity, and firmware versioning. Additionally, it incorporates industry-standard performance benchmarking tools such as HPL, NCCL, and Nemotron (Large Language Model) to assess system capabilities. This streamlined approach significantly enhances both testing efficiency and thoroughness while reducing execution time.
Note: In B200 systems, “Unit” refers to an individual compute node.
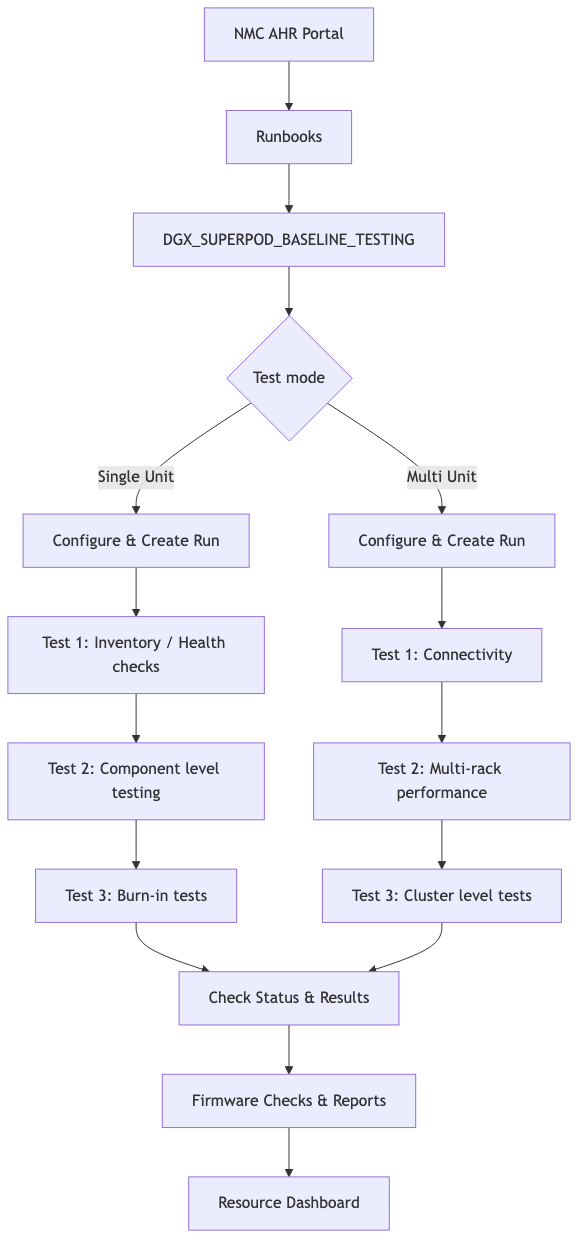
Entrypoint of Automated Testing#
A centralized automated baseline testing interface has been established to facilitate streamlined test execution and management. This unified entry point provides comprehensive access to the testing framework, enabling efficient navigation and one-click implementation of all testing procedures.
To access the baseline testing interface:
Access the NVIDIA Mission Control autonomous hardware recovery portal using your credentials and navigate to the Runbooks section.
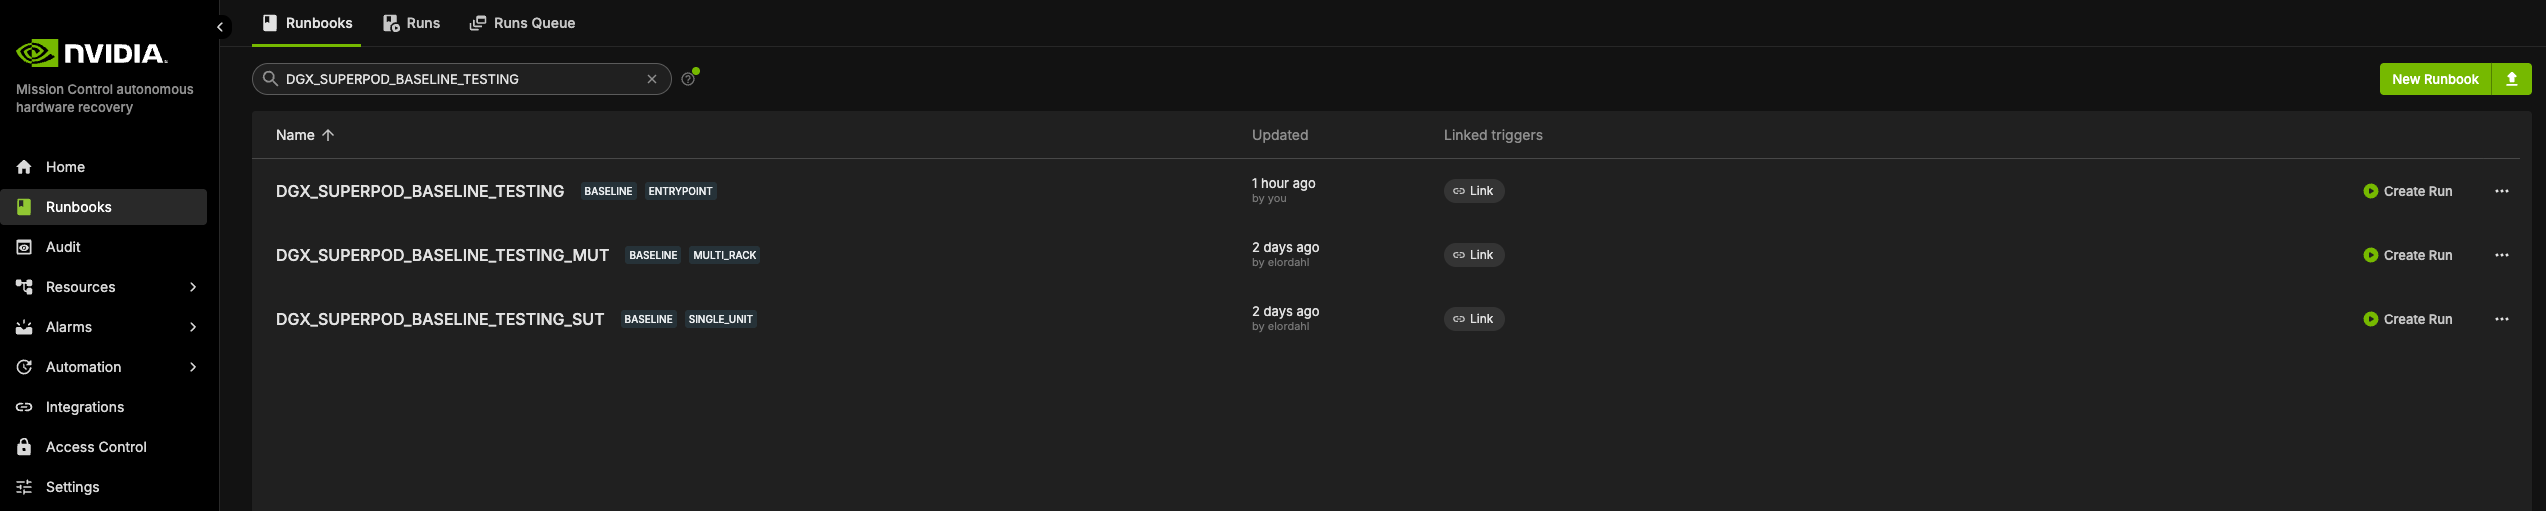
Locate the “DGX_SUPERPOD_BASELINE_TESTING” runbook through the search functionality (reference the interface depicted following)
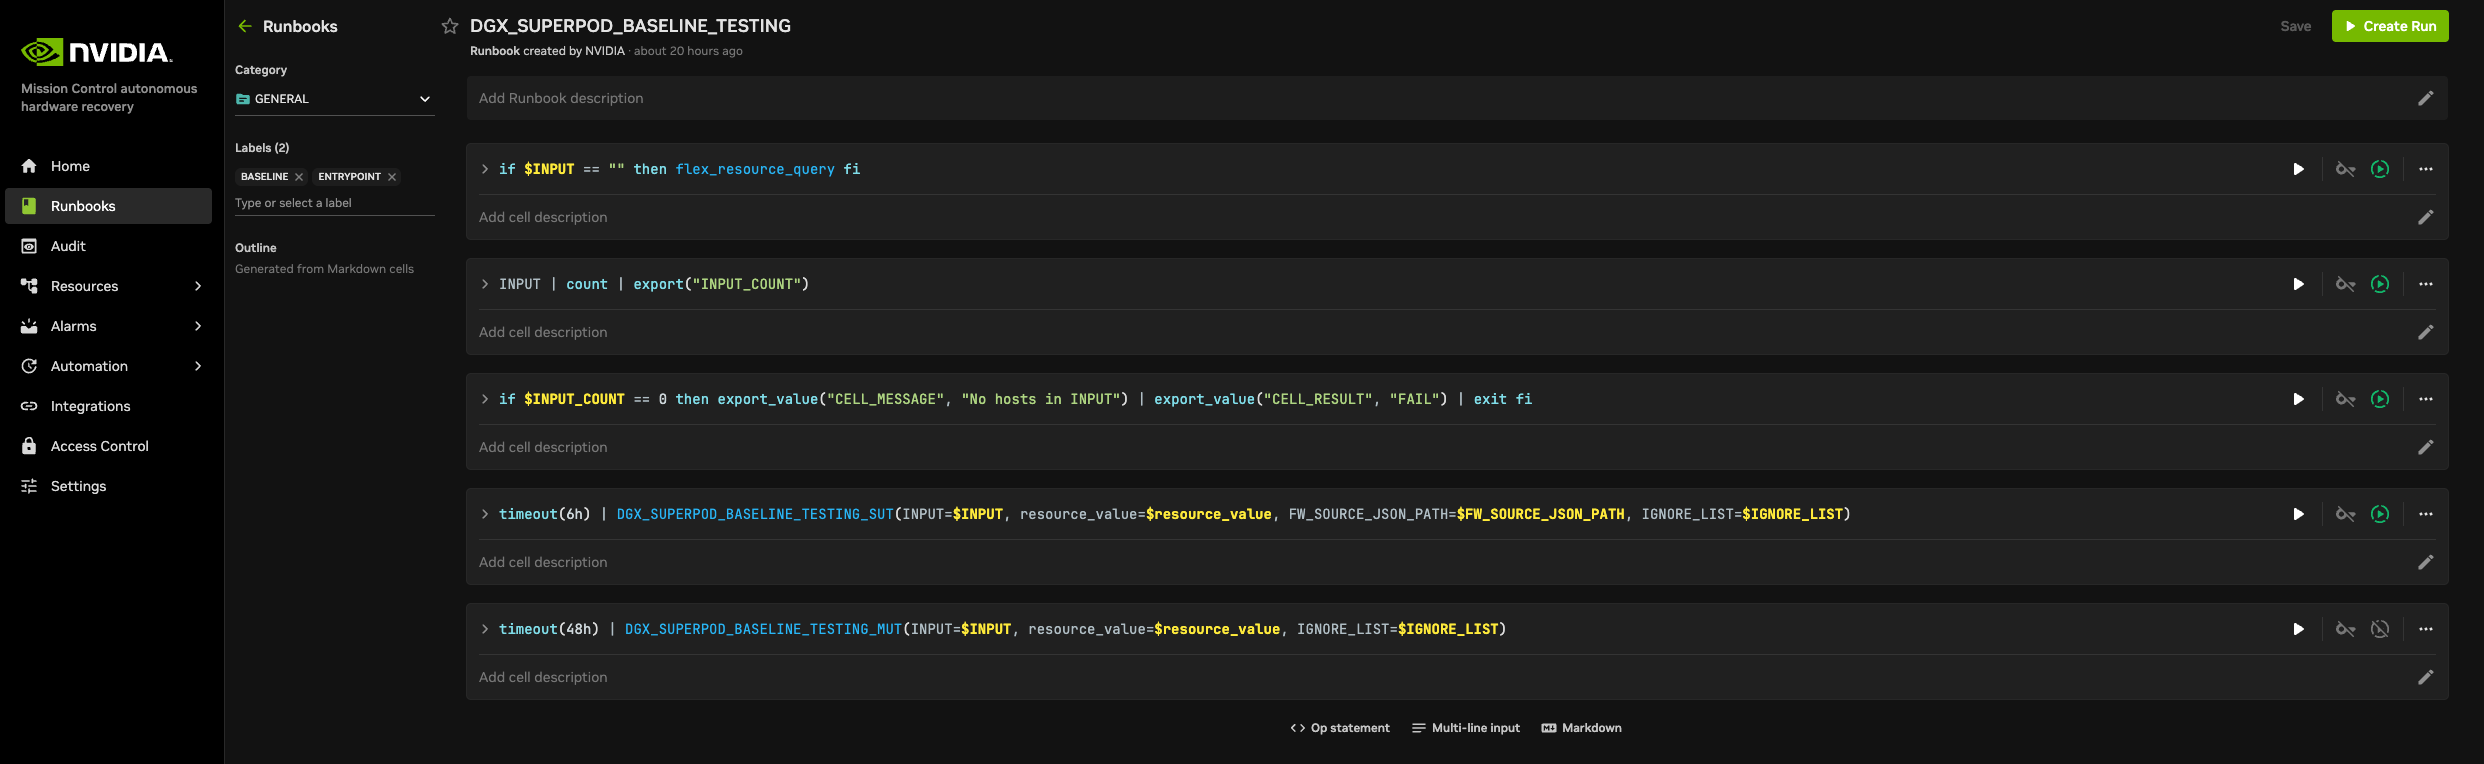
Upon selecting the “DGX_SUPERPOD_BASELINE_TESTING” runbook, you will be presented with the following interface. The subsequent sections of this documentation will provide detailed guidance on executing various testing procedures.
Firmware checks#
NVIDIA Mission Control autonomous hardware recovery includes firmware checks that extract the current firmware versions of the trays and switches, and compare them with the expected versions specified in the Source of Truth (SOT) file. The SOT file includes the expected versions for all components such as OS, HMC, ConnectX, etc., and is prepopulated. Obtain the SOT file from the NVIS team.
The runbook extracts the expected versions of all firmware components and compares the current versions against them. If any execution of the firmware validation runbook results in versions not found, please re-run the runbook.
Updating the SOT file#
Place the SOT JSON file on the headnode and provide the complete file path as the input FW_SOURCE_JSON_PATH to the DGX_SUPERPOD_BASELINE_TESTING runbook. To update the file, simply replace it with the new file and update the path in the input parameter of the runbook accordingly.
Thresholds and Defaults#
The thresholds and default values for various tests are defined in the Golden Config File. The runbook picks the appropriate values, and compares it against the values on the nodes. This includes defaults such as number of GPUs and expected benchmarks for benchmarking tests (such as SUT2).
Golden Config File#
The Golden Config File (referred to as the defaults.env file on the trays and control nodes) contains the expected values for all benchmark thresholds, and other relevant settings. This file is distributed across all trays and loaded as environment variables, making its contents available during testing.
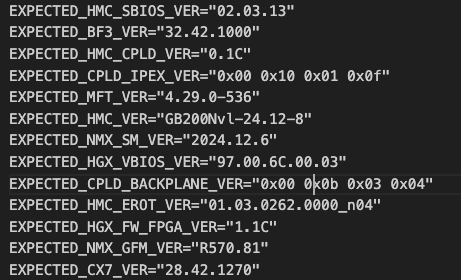
Updating the Golden Config File#
To update the golden config values, edit config/<CHIP>/defaults.yaml (for example, config/B200/defaults.yaml or config/GB200/defaults.yaml). The chip-specific env files are generated automatically from these YAML files during deployment — do not edit the generated files under Shoreline_files/generated/ directly.
Once the changes are made and saved, use the NVIDIA Mission Control autonomous hardware recovery Runbook Deployment section (from the NVIDIA Mission Control AHR installation documentation) to apply them via OpenTofu. This process will create a File object on NVIDIA Mission Control autonomous hardware recovery, which pushes the updated file automatically to all control and compute trays. Various tests, including firmware checks, prolog, and epilog checks, source the defaults.env file and utilize the expected values, now available as environment variables.
Reports of Testings#
NVIDIA Mission Control autonomous hardware recovery provides reports for baseline testing, reflecting the status of nodes (compute and switches) at each test stage. These reports help identify and troubleshoot root causes.
To access the NVIDIA Mission Control autonomous hardware recovery reports, click on Resources in the side menu, then select Reports.
The Landing page contains two tabs: Report Templates and Published Reports.
Report Templates provide templates for each stage of Baseline testing. These templates include bar graphs that display the PASS or FAIL status for different nodes during the tests. However, these templates are static and do not store any test data. This means that while you can view the templates, you cannot save or modify the test results within them.
To generate a report that records the test results along with timestamps, click Publish. This action will create a new report based on the template, which will capture the current status of the tests. The report will display PASS for tests that were successful and FAIL for those that did not pass, with each status reflecting the most up-to-date information. The report also includes links to additional reports at the top of the page. These links allow you to access the detailed results of the individual SUT and MUT tests that make up each stage, giving you a deeper insight into the performance and status of each test within the overall baseline testing process.
Note: Reports reflect updated information only after the SUT and MUT tests have been executed.
Guide to initiate Reporting for Baseline Testing#
Navigate to the “DGX_SUPERPOD_BASELINE_TESTING_REPORT” under the Report Templates.
Optional: While templates do not reflect the current status of the test suite, you can use it to view the current state before publishing the reports. Clicking the refresh button at the top of the report will load the current data.
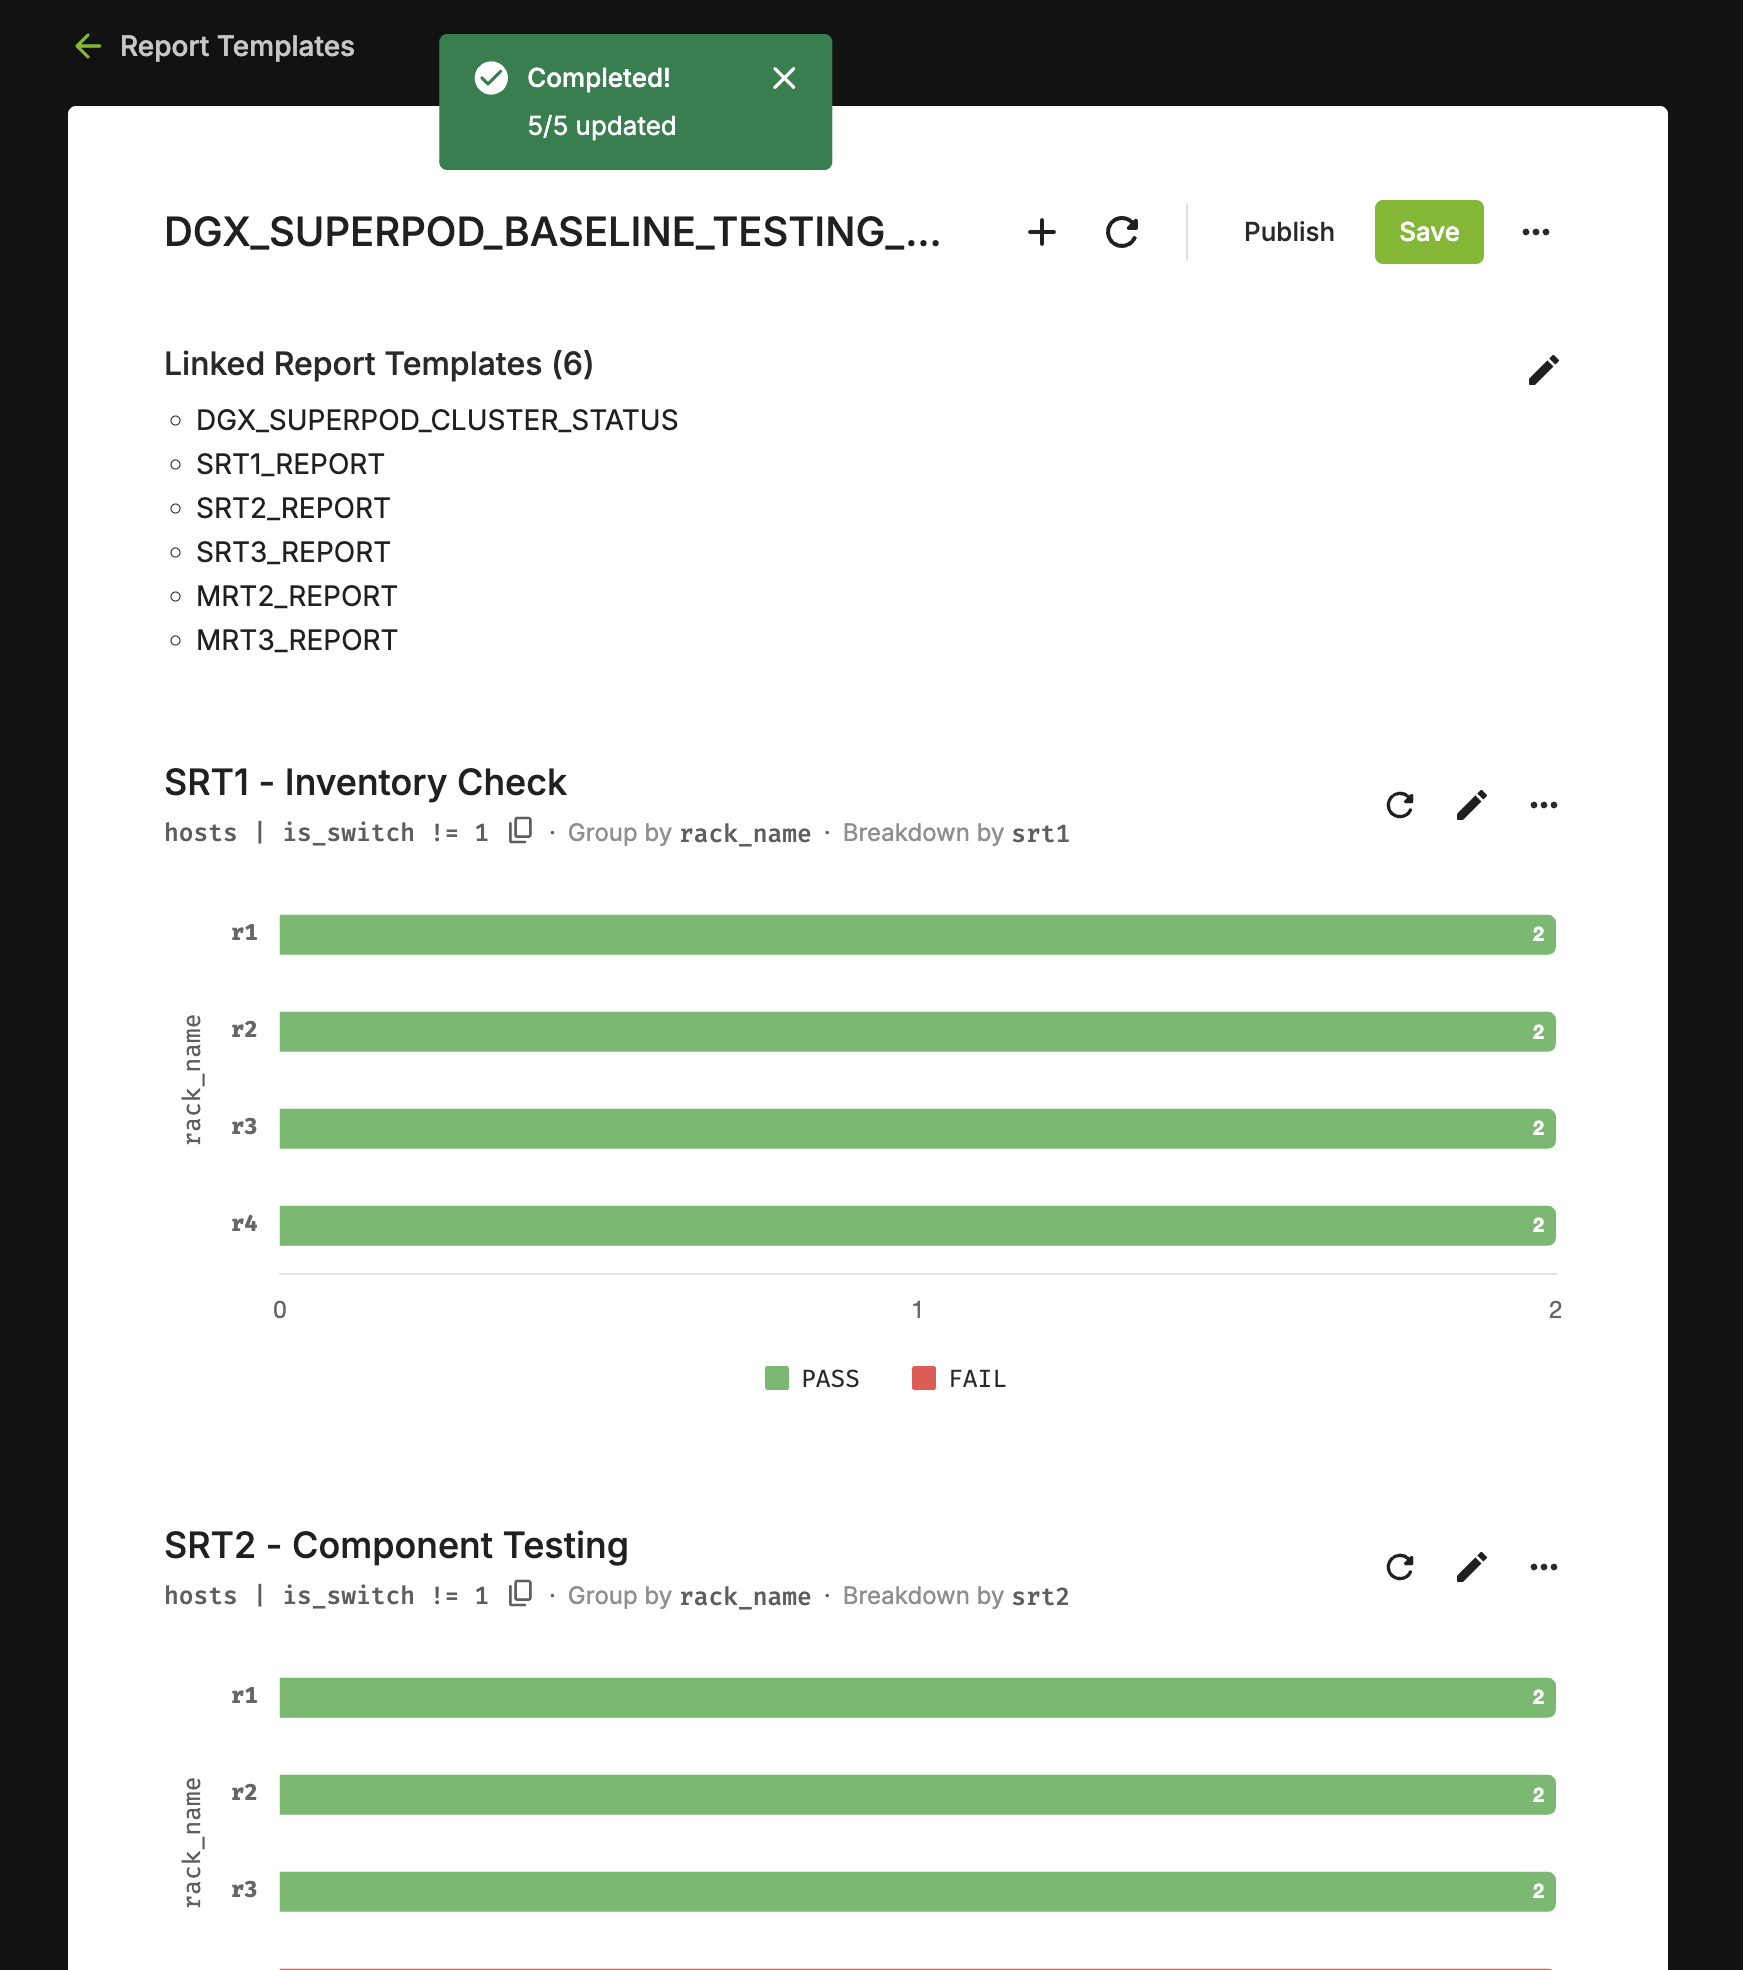
Click on “Publish” to generate a timestamped instance of the template that can be easily viewed and shared. Additionally, it automatically publishes all linked reports at the top of the page, ensuring that all related data is included and accessible.
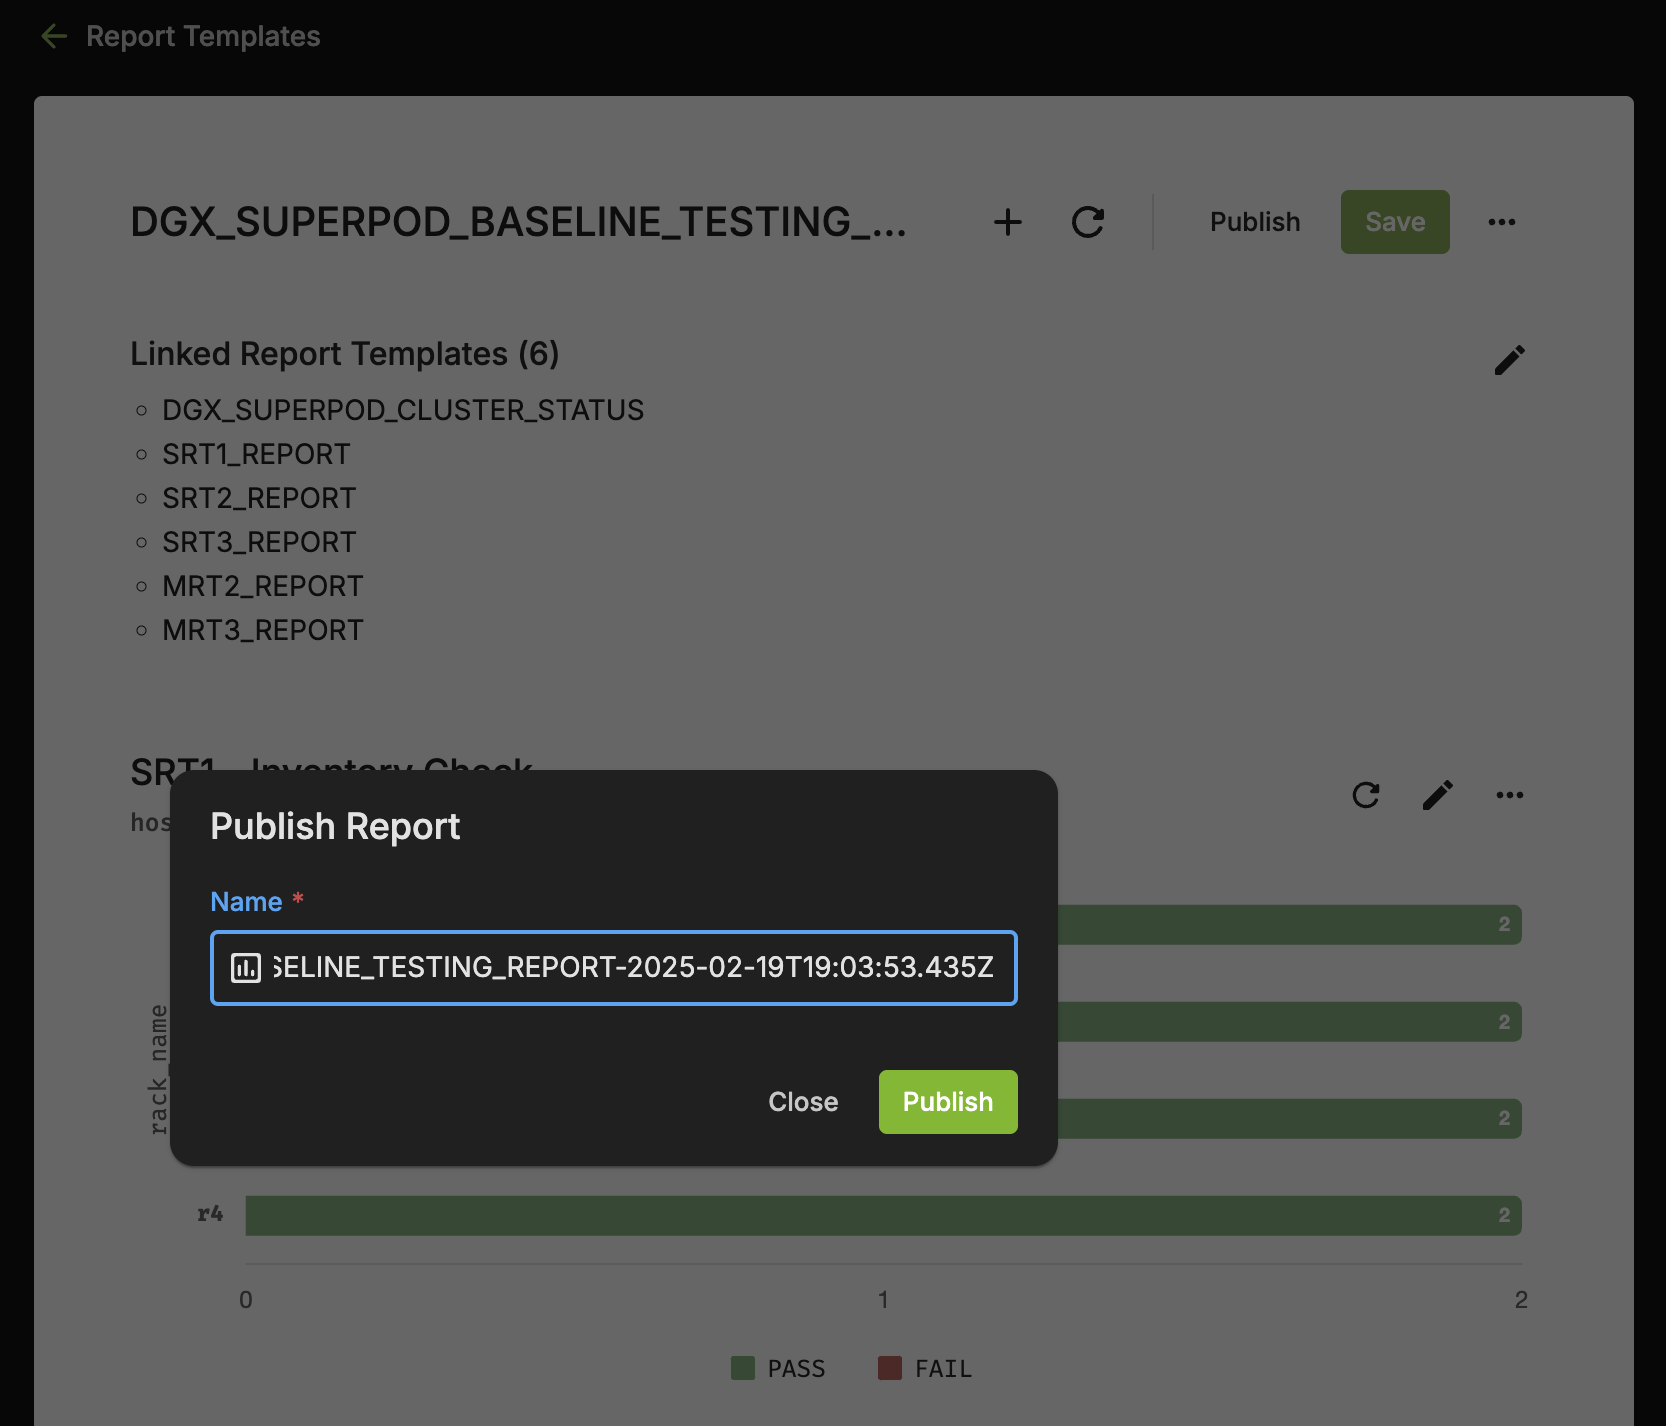
Retain the auto-generated name for the report which includes the timestamp or provide your own name.
Once the process starts, the published reports will begin generating in the background. This includes “DGX_SUPERPOD_BASELINE_TESTING_REPORTS” as well as all the SUT and MUT linked reports.
A pop-up notification will appear containing a hyperlink to access the published reports that are being currently generated.

When you publish the “DGX_SUPERPOD_BASELINE_TESTING_REPORTS”, it automatically triggers the publication of all “linked reports”, including the associated SUT and MUT reports, with the data captured at that given time.
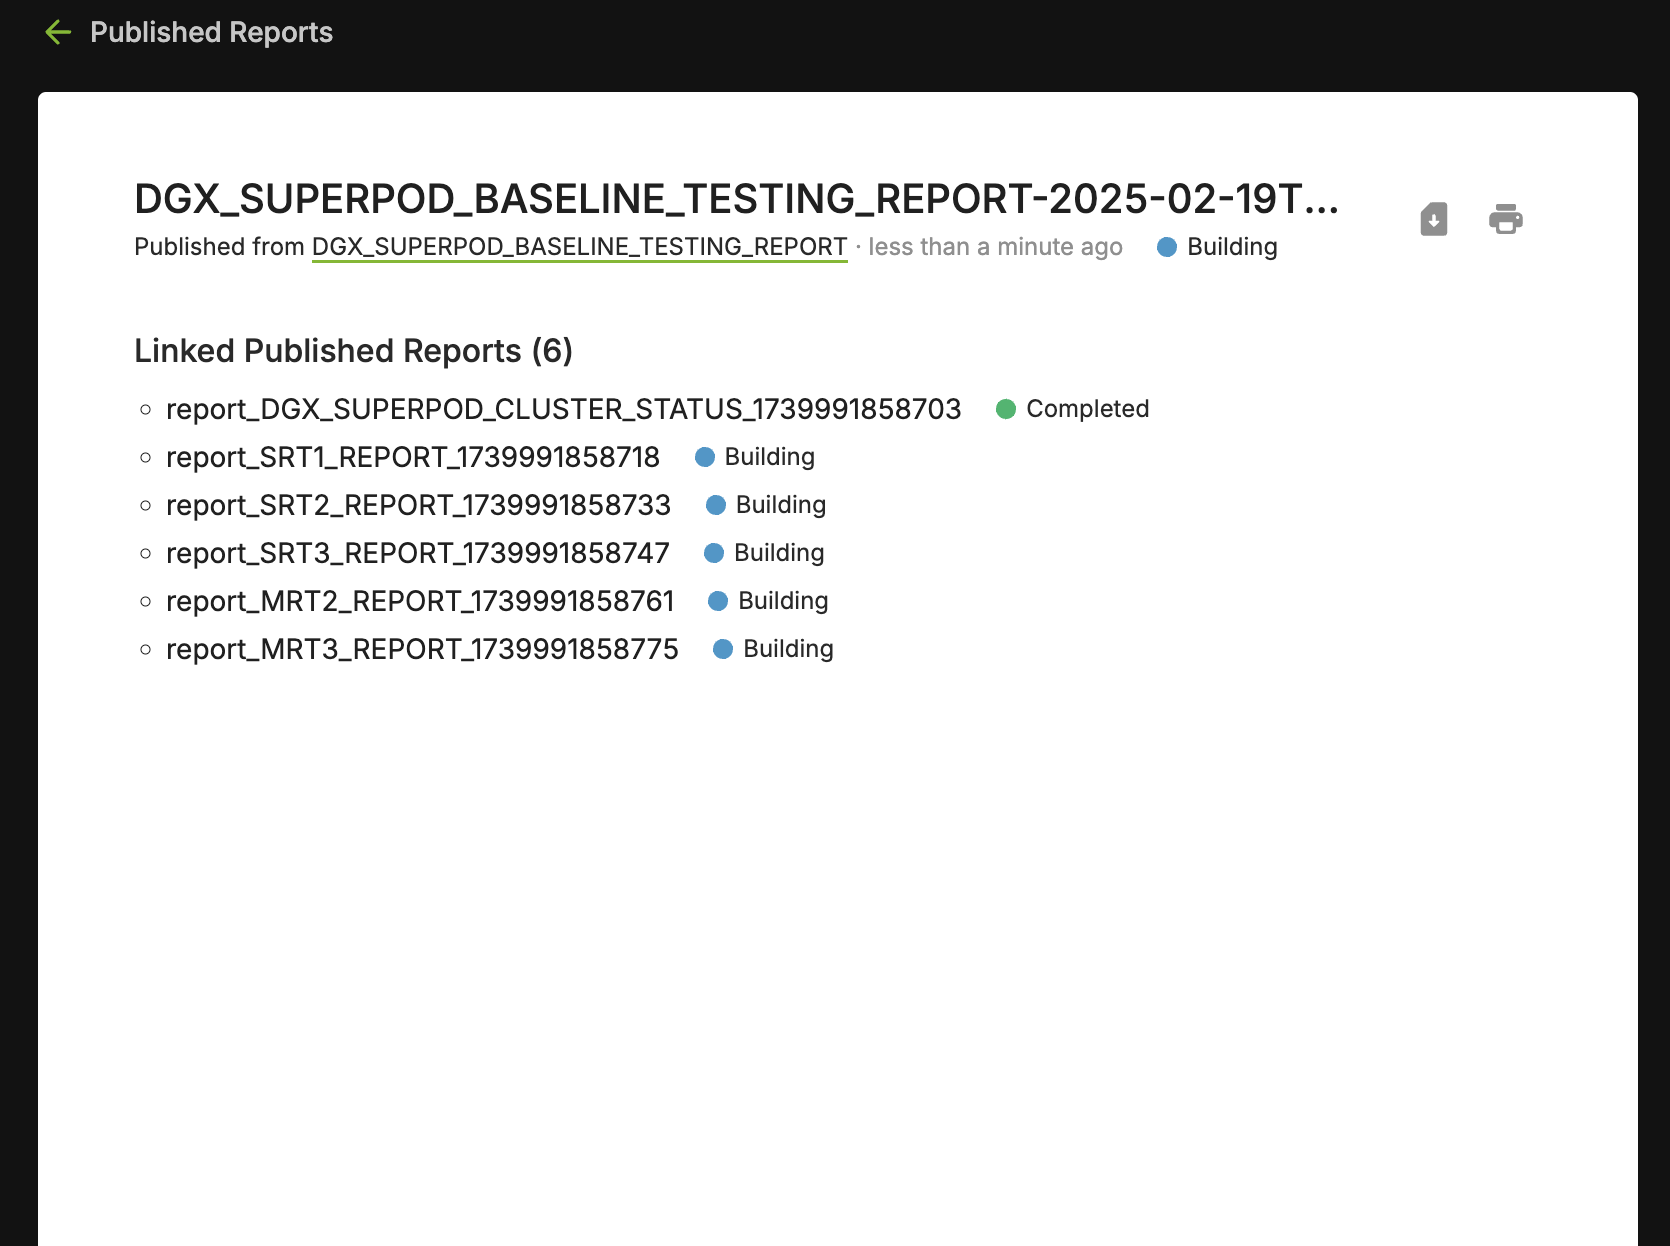
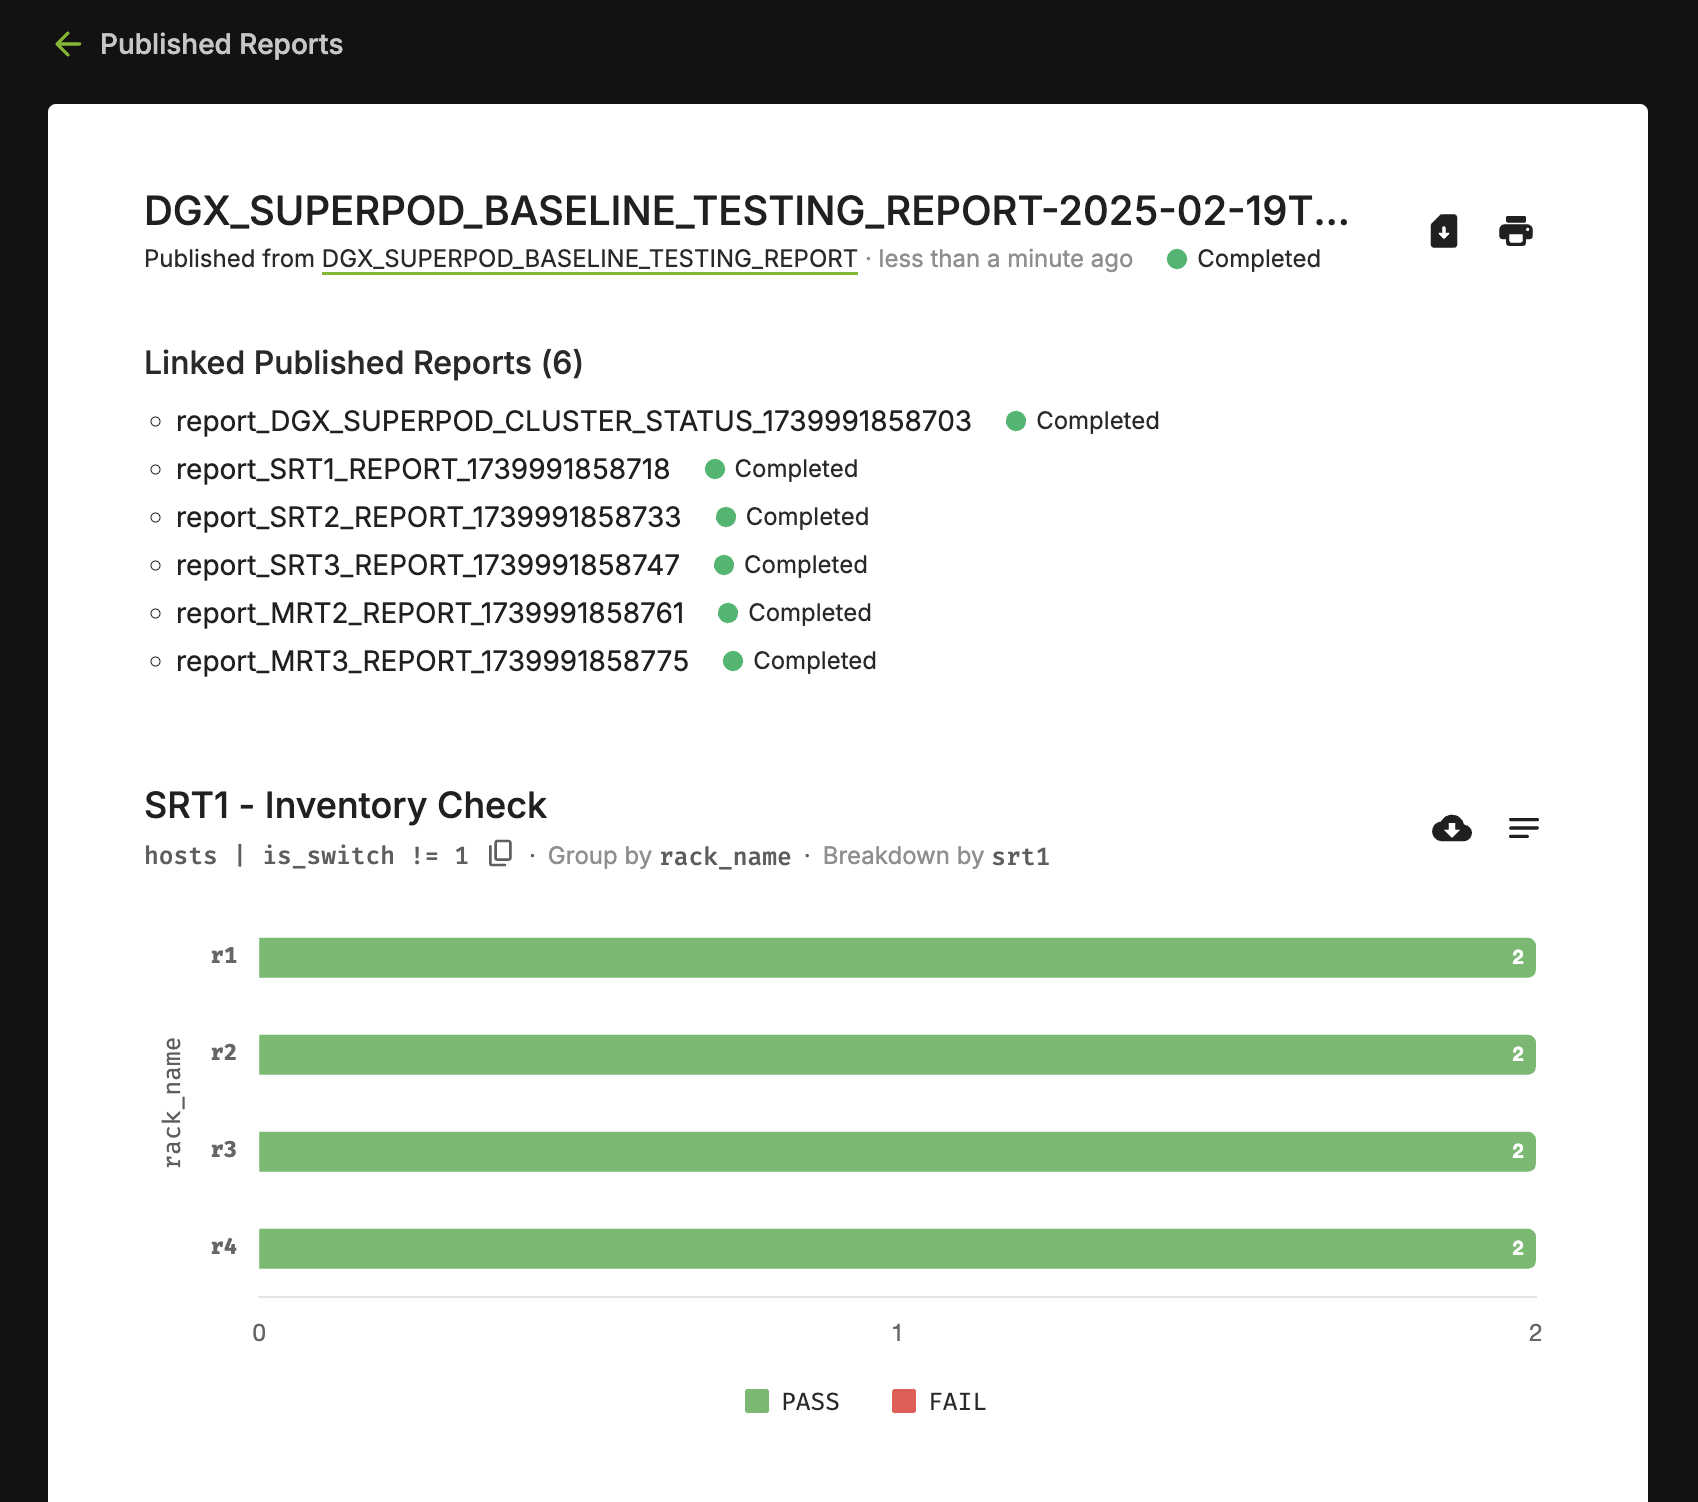
All the reports will complete building in under a minute, and the “Linked Published Reports” will include the published reports for all the Linked Reports.
Navigating to Previously Published Reports#
Navigate to the Reports from the NVIDIA Mission Control autonomous hardware recovery Home Page
Click on “Published Reports”, and select the “DGX_SUPERPOD_BASELINE_TESTING_REPORT_timestamp” or any other report of interest.
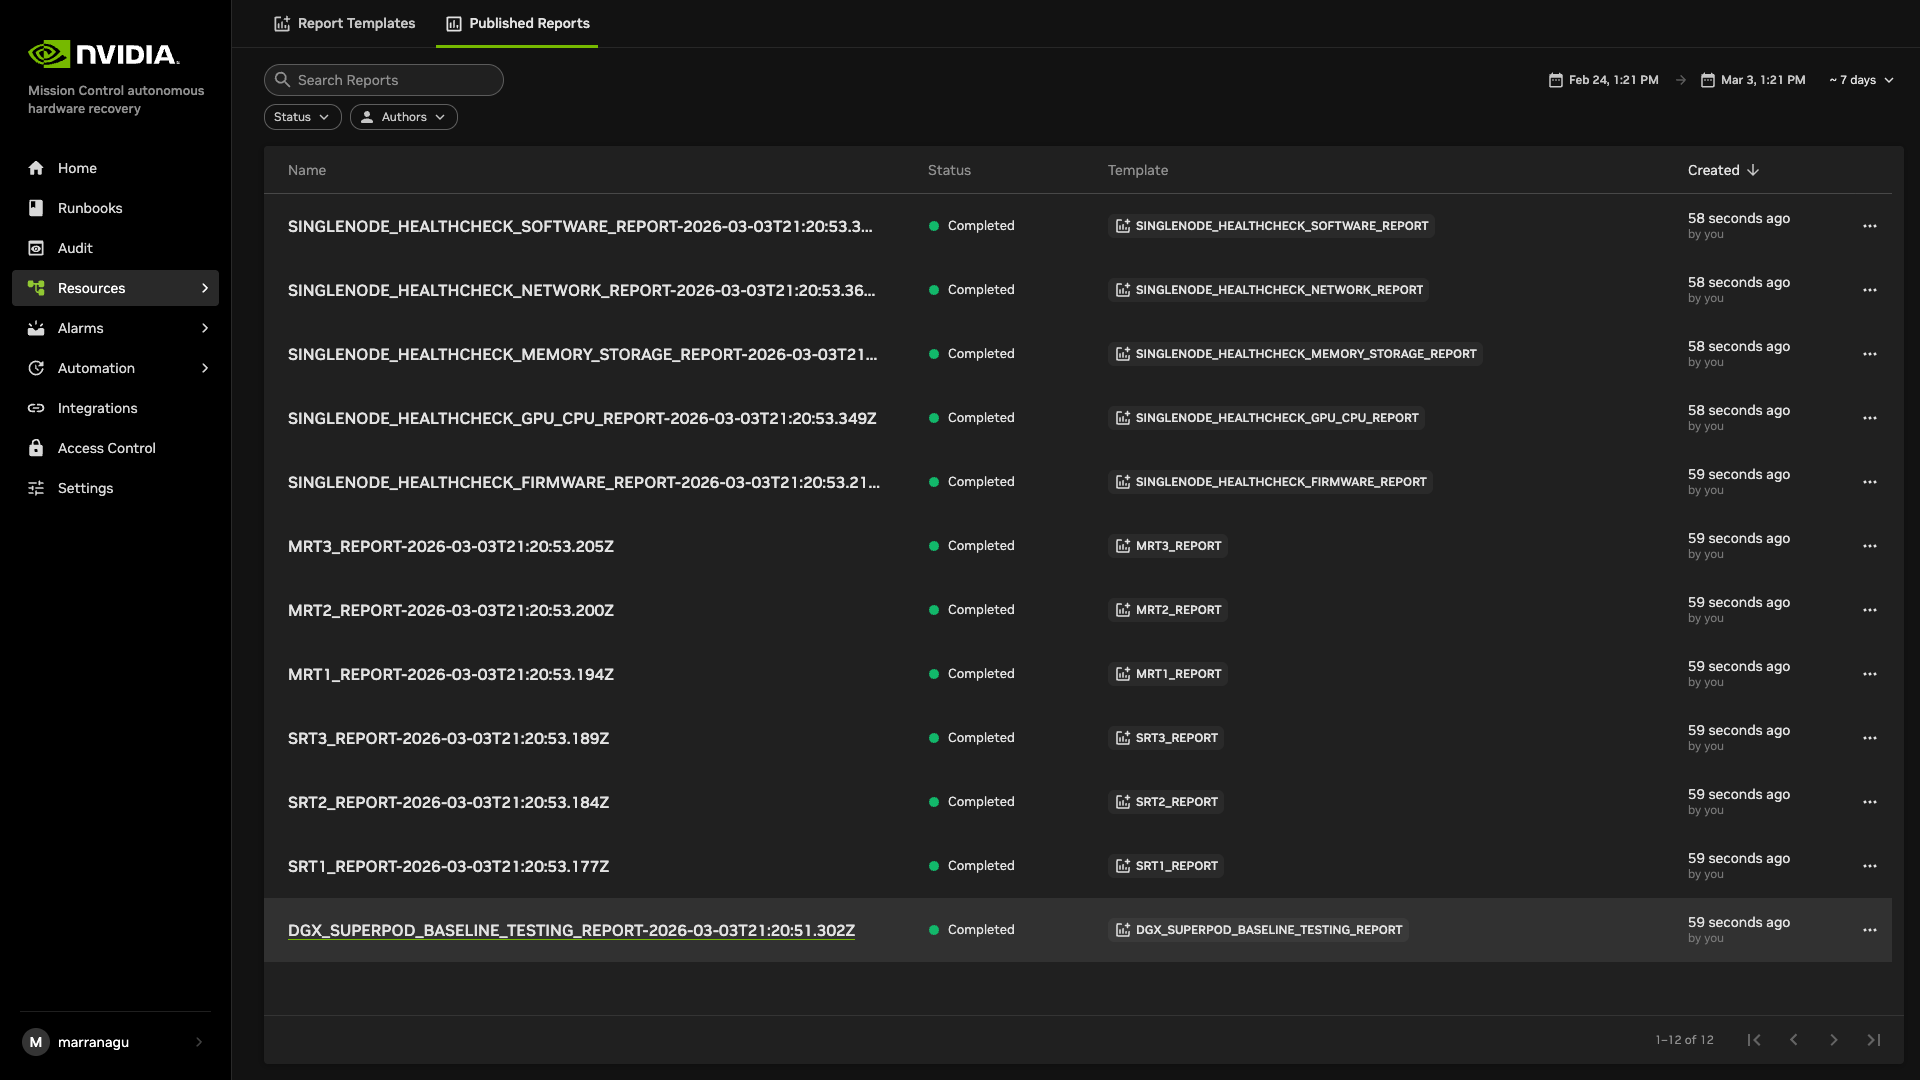
You can also adjust the time range at the top of the screen to view reports generated within specific time frames. Options include viewing reports from the last 10 minutes, last 1 hour, or selecting a custom time range to explore older data beyond these periods.
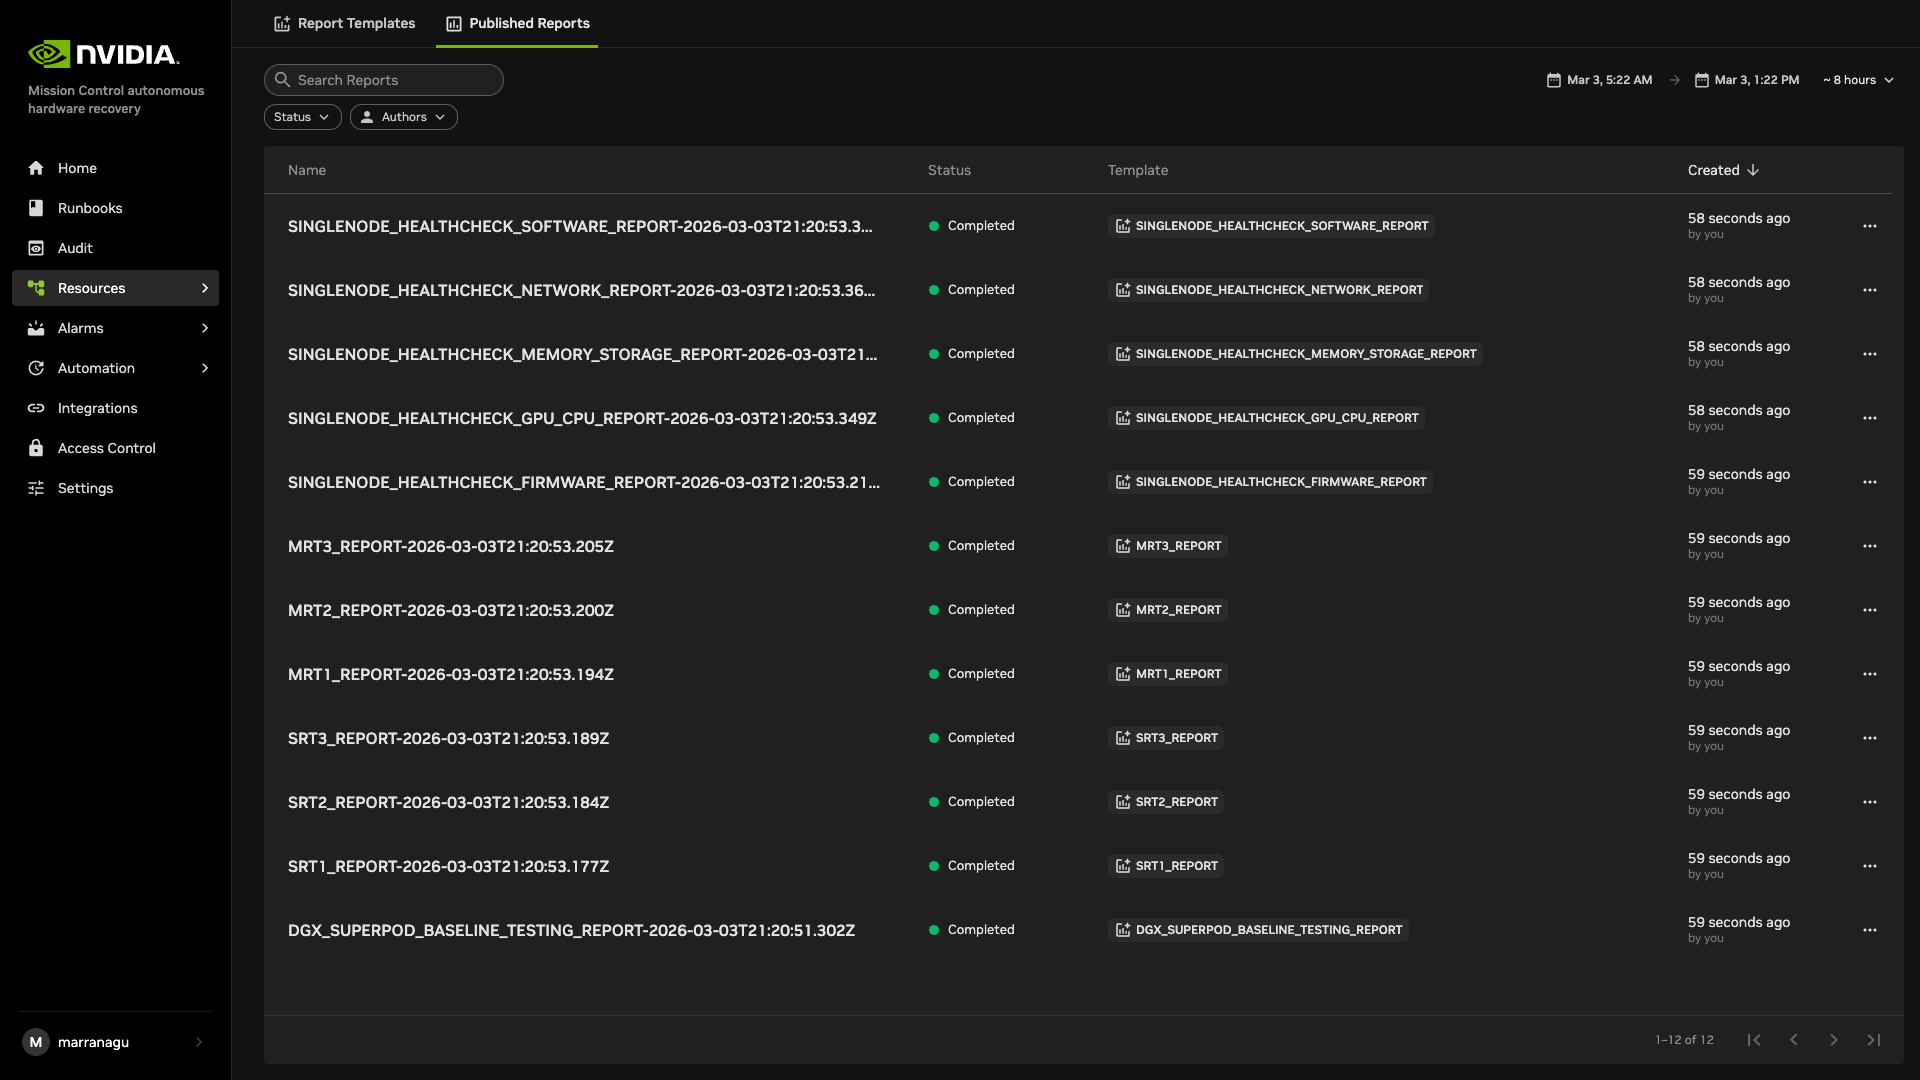
Breakdown of a Published Report#
DGX_SUPERPOD_BASELINE_TESTING_REPORT#
“DGX_SUPERPOD_BASELINE_TESTING_REPORT”, is the entry point for the Baseline Testing reports. It provides a comprehensive overview of all the SUT/MUT tests for the compute nodes.
Each stage is represented by a separate cell, displaying the results for that specific SUT or MUT test.
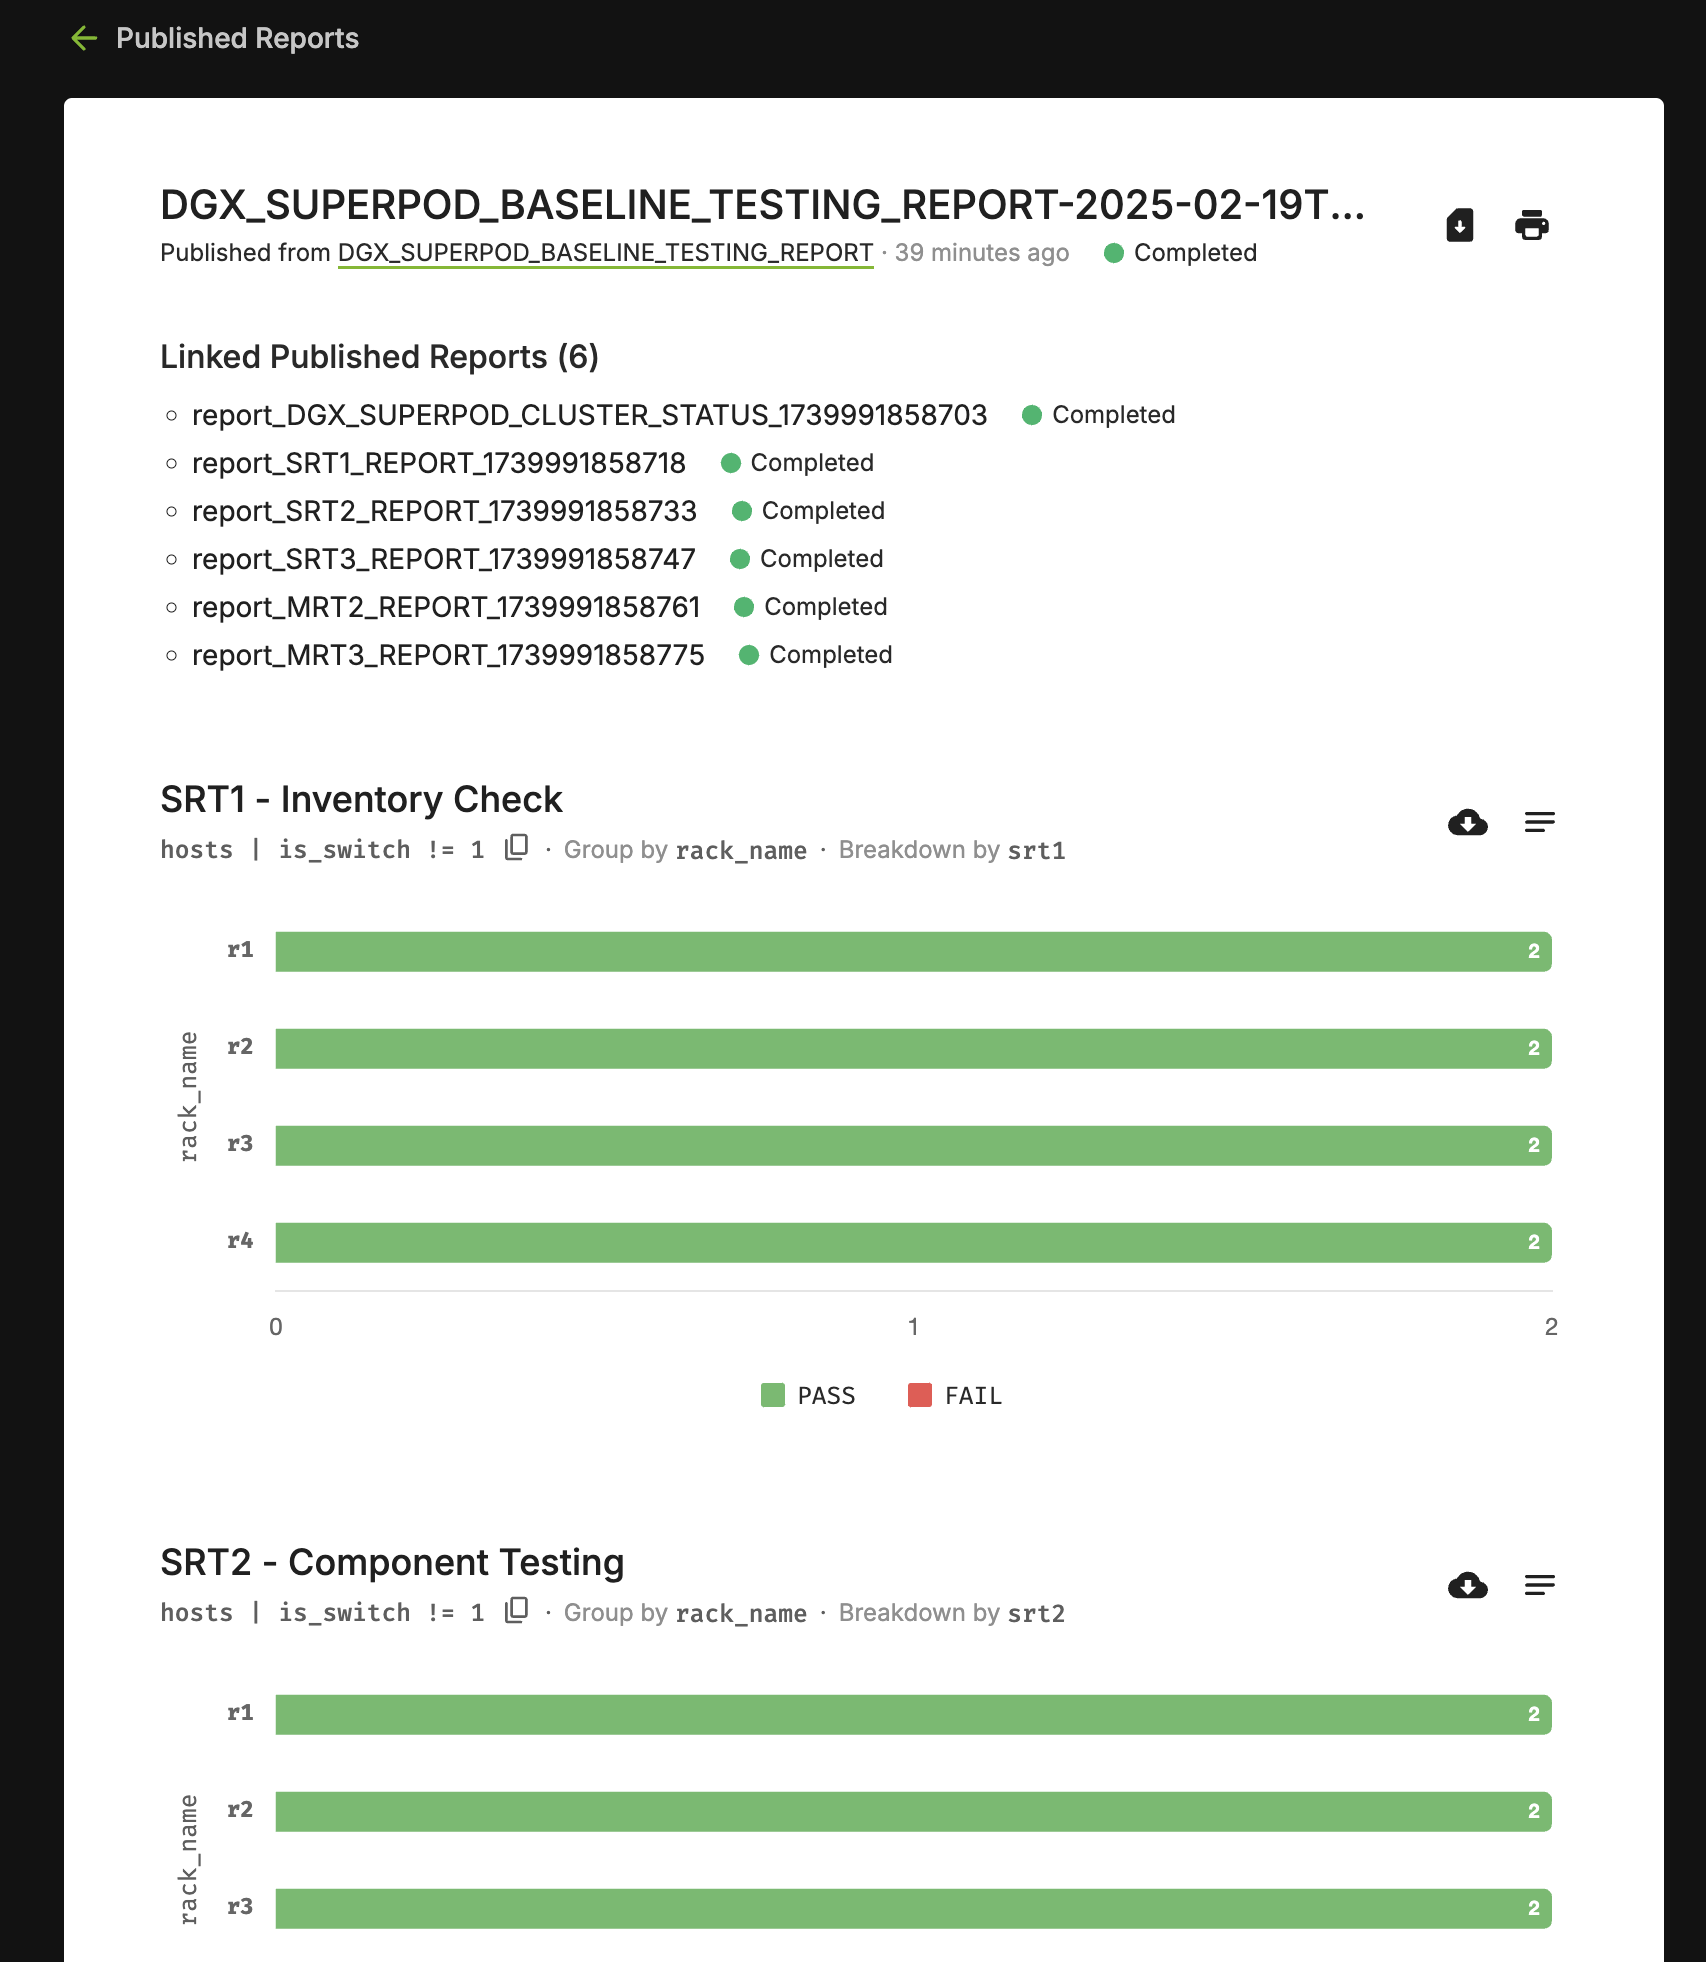
To perform a deeper analysis or understand the tests in each stage, click on the relevant report listed under “Linked Published Reports” at the top of the page.
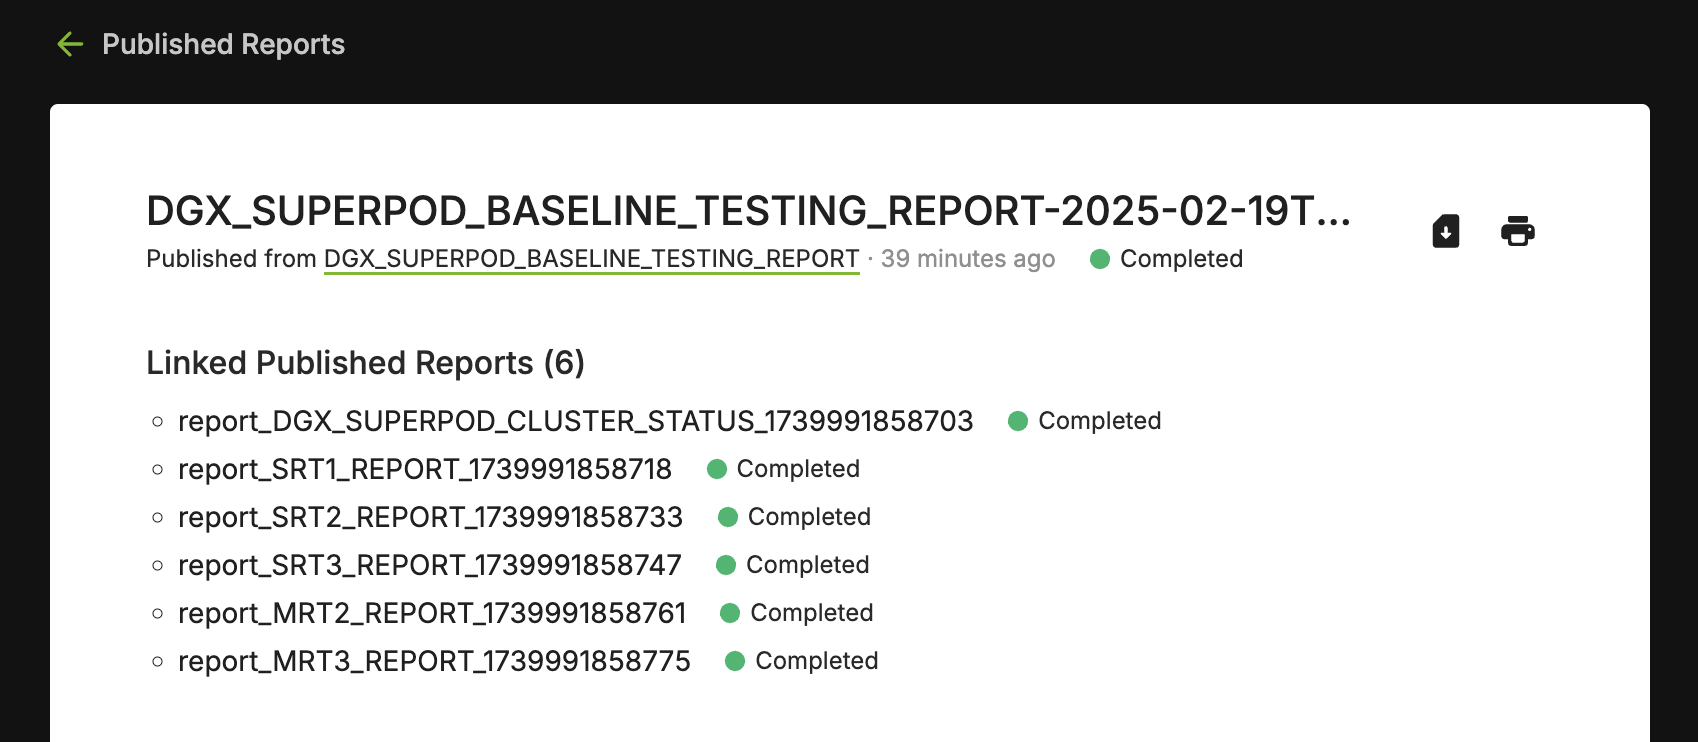
Similarly, all the reports for each stage are available. You can either find the report of interest from Published Reports, or traverse it from the parent report (DGX_SUPERPOD_BASELINE_TESTING_REPORT_<timestamp> )
Understanding the Published Reports#
The reports align up with the SUT and MUT tests. Each cell in “DGX_SUPERPOD_BASELINE_TESTING_REPORT” represents a specific testing stage such as SUT1, SUT2 etc. Within each of these “Linked Reports”, the cells represent individual tests such as Singlenode Healthchecks, HPL, NCCL etc. The layout of the graph for each of the cells is organized as follows:
The Y-axis displays the Rack name, allowing you to quickly identify the location of each resource within the cluster.
The X-axis represents the number of trays within each rack.
For example, in the following visualization, each bar graph indicates the number of trays within a rack. In this case, there are 2 trays per rack, as denoted by the number displayed on the bars. This provides a clear view of the test progress for each tray across different racks. ** note: for NVL72, you will have 18 trays per rack in the report.
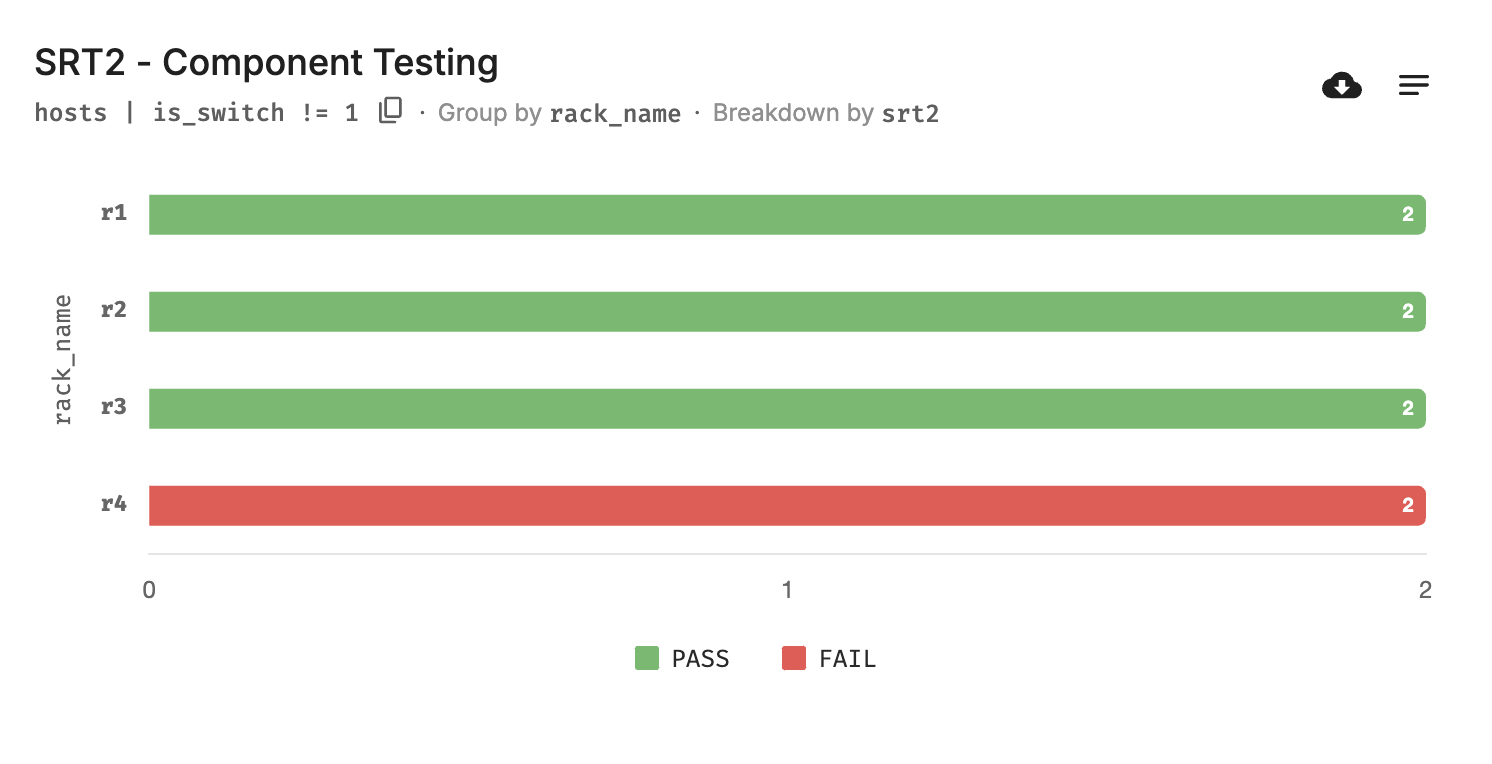
You can click on any bar in the graph to view a detailed list of the resources that passed or failed the tests within that specific bar. This allows you to drill down and see the test results for each tray in a particular rack or test stage.
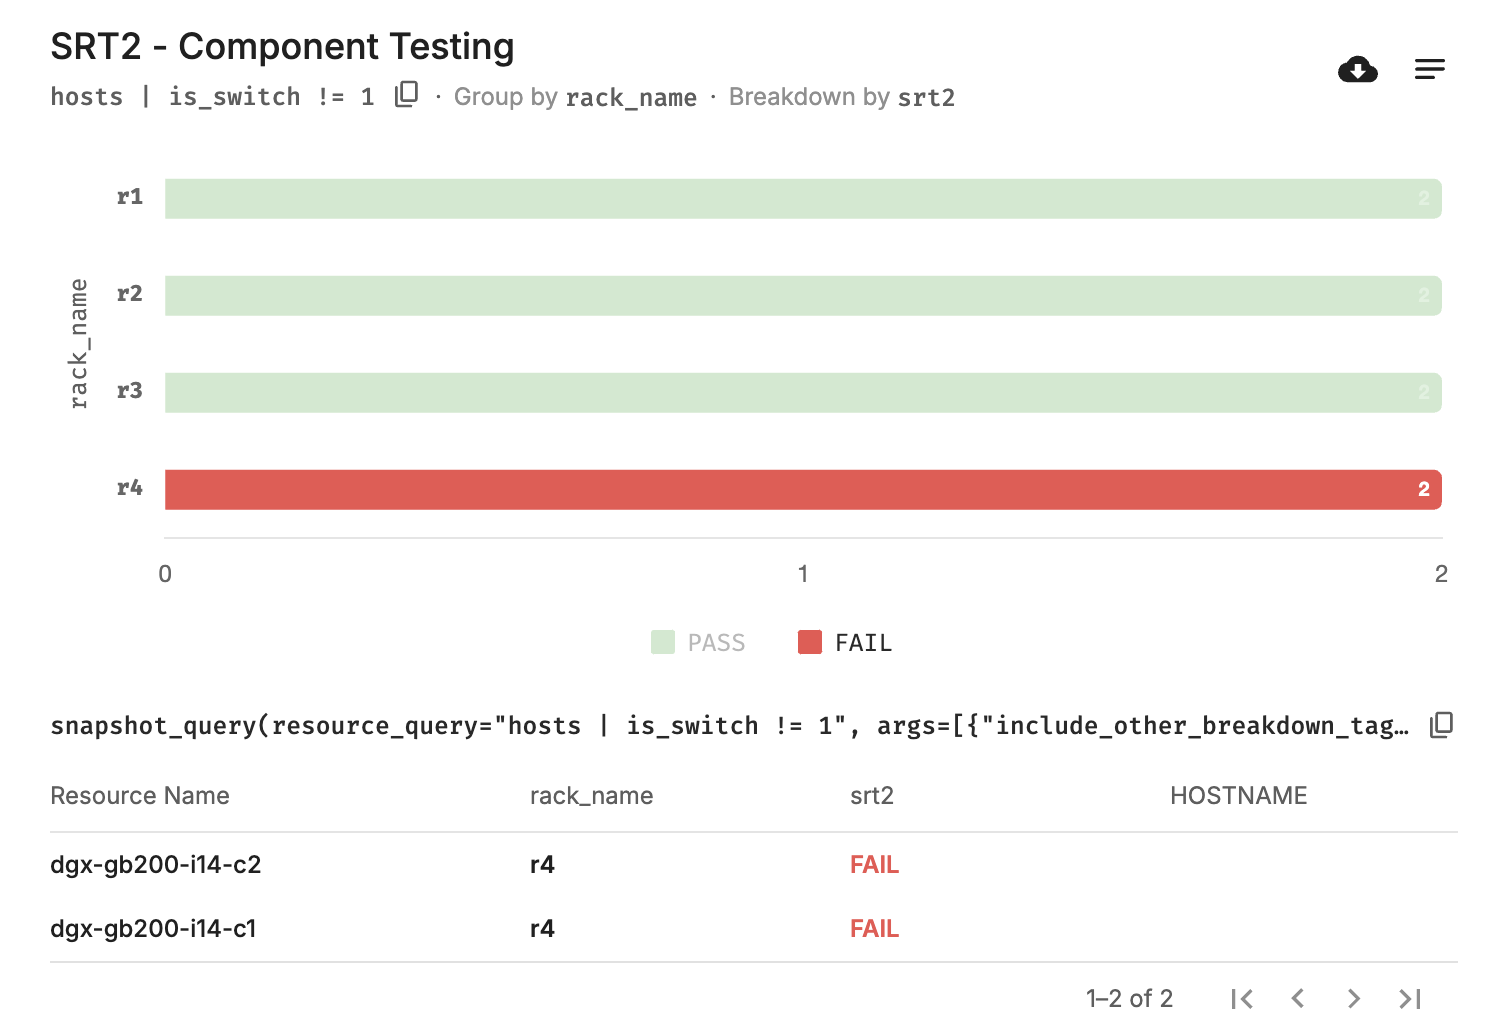
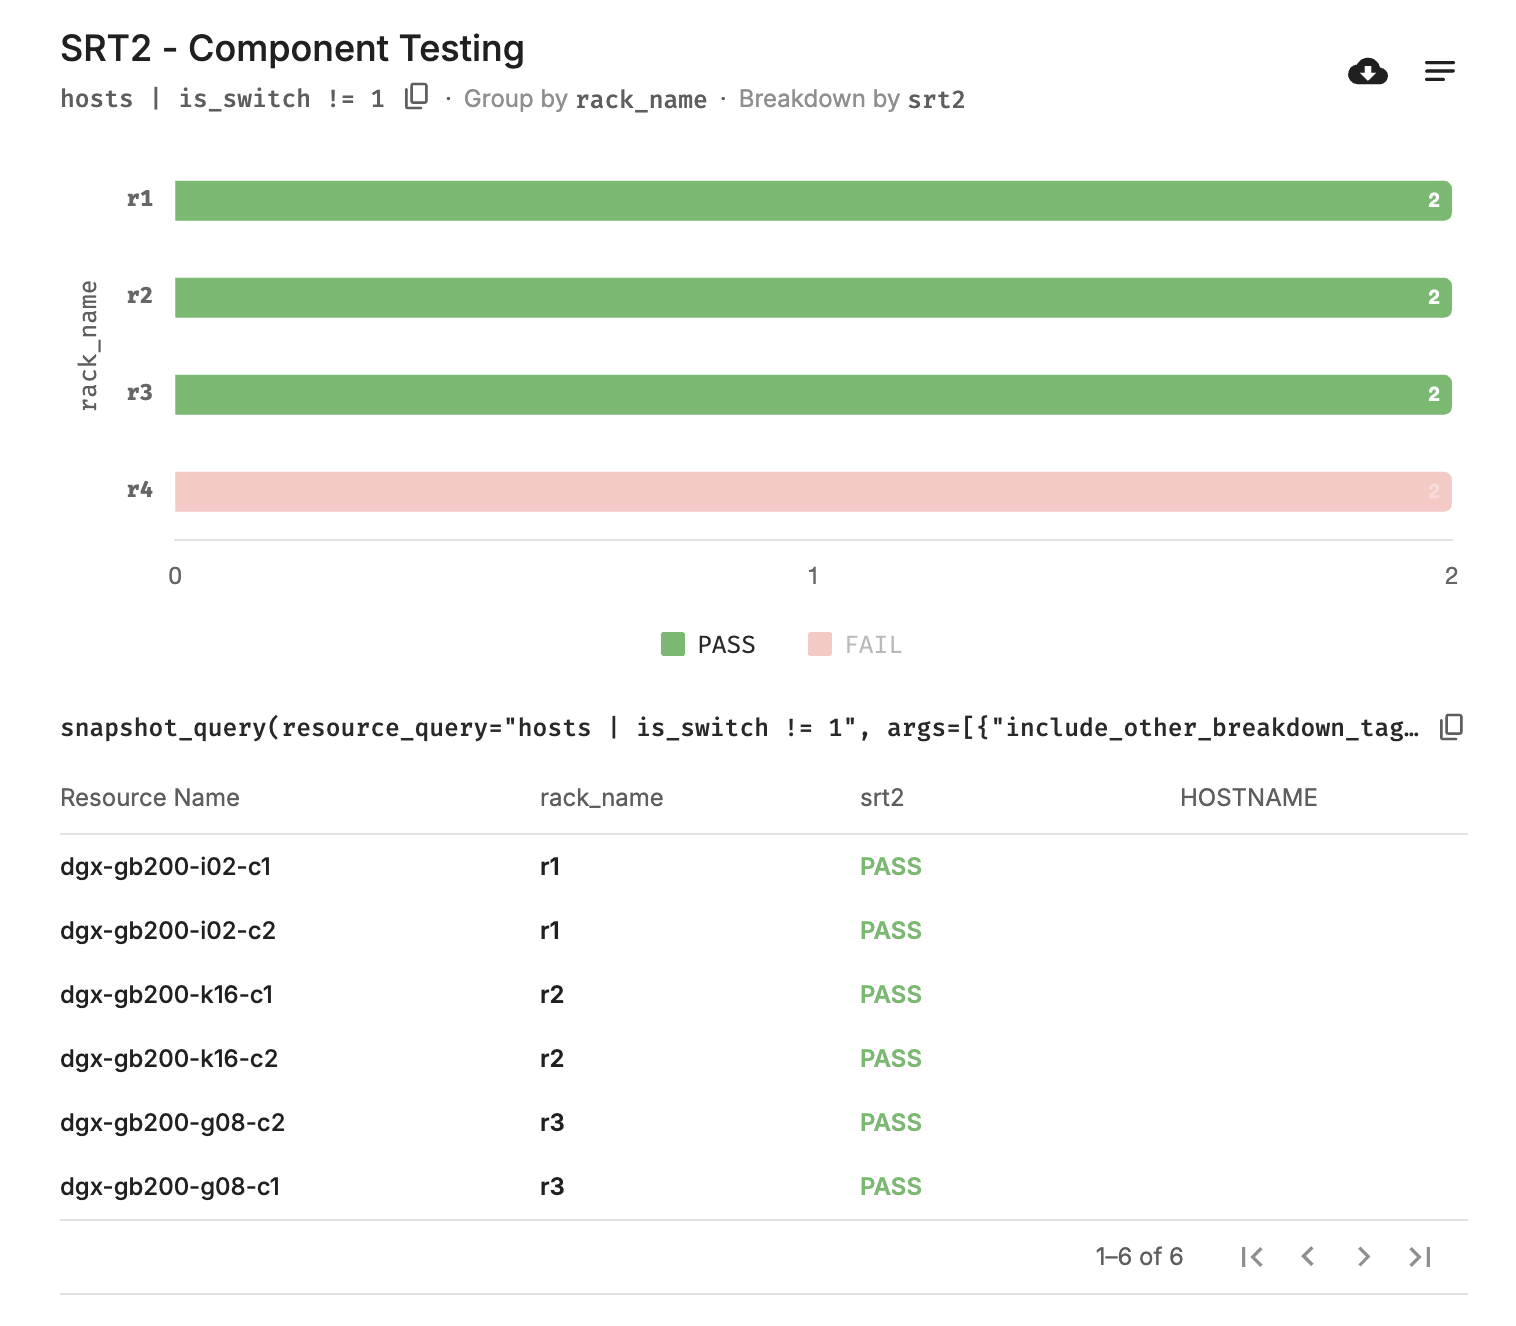
Alternatively, you can click on the legend to filter and display all the passed or failed resources across the entire cluster, providing a comprehensive view of the overall test status.
Root Cause Analysis#
The report for each stage shows the trays that have passed and failed the test. To understand the actual issue and access the logs, you can follow these steps:
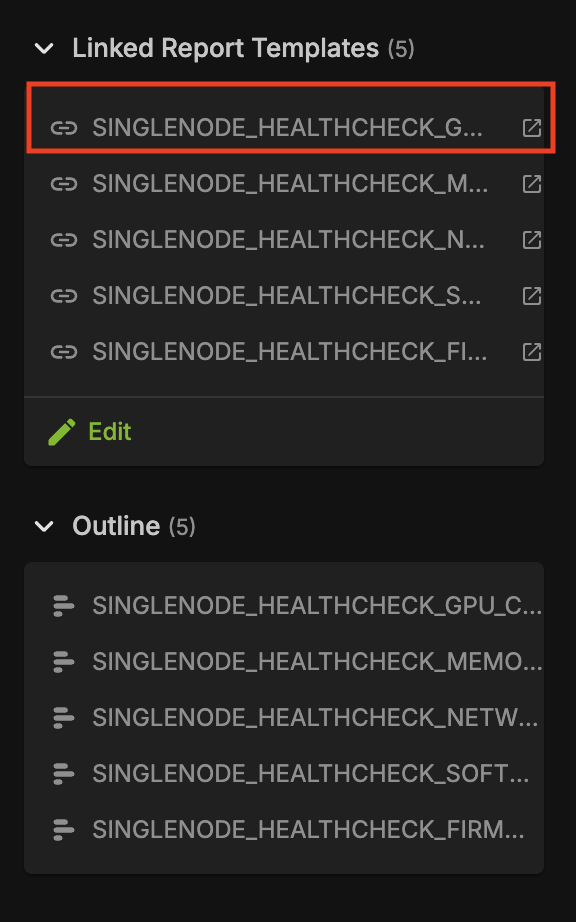
Navigate to the report with PASS/FAIL values that you are interested to conduct an RCA. In this example, lets consider SRT1 report where there are a few failed tests for SINGLENODE_HEALTHCHECK_GPU_CPU.
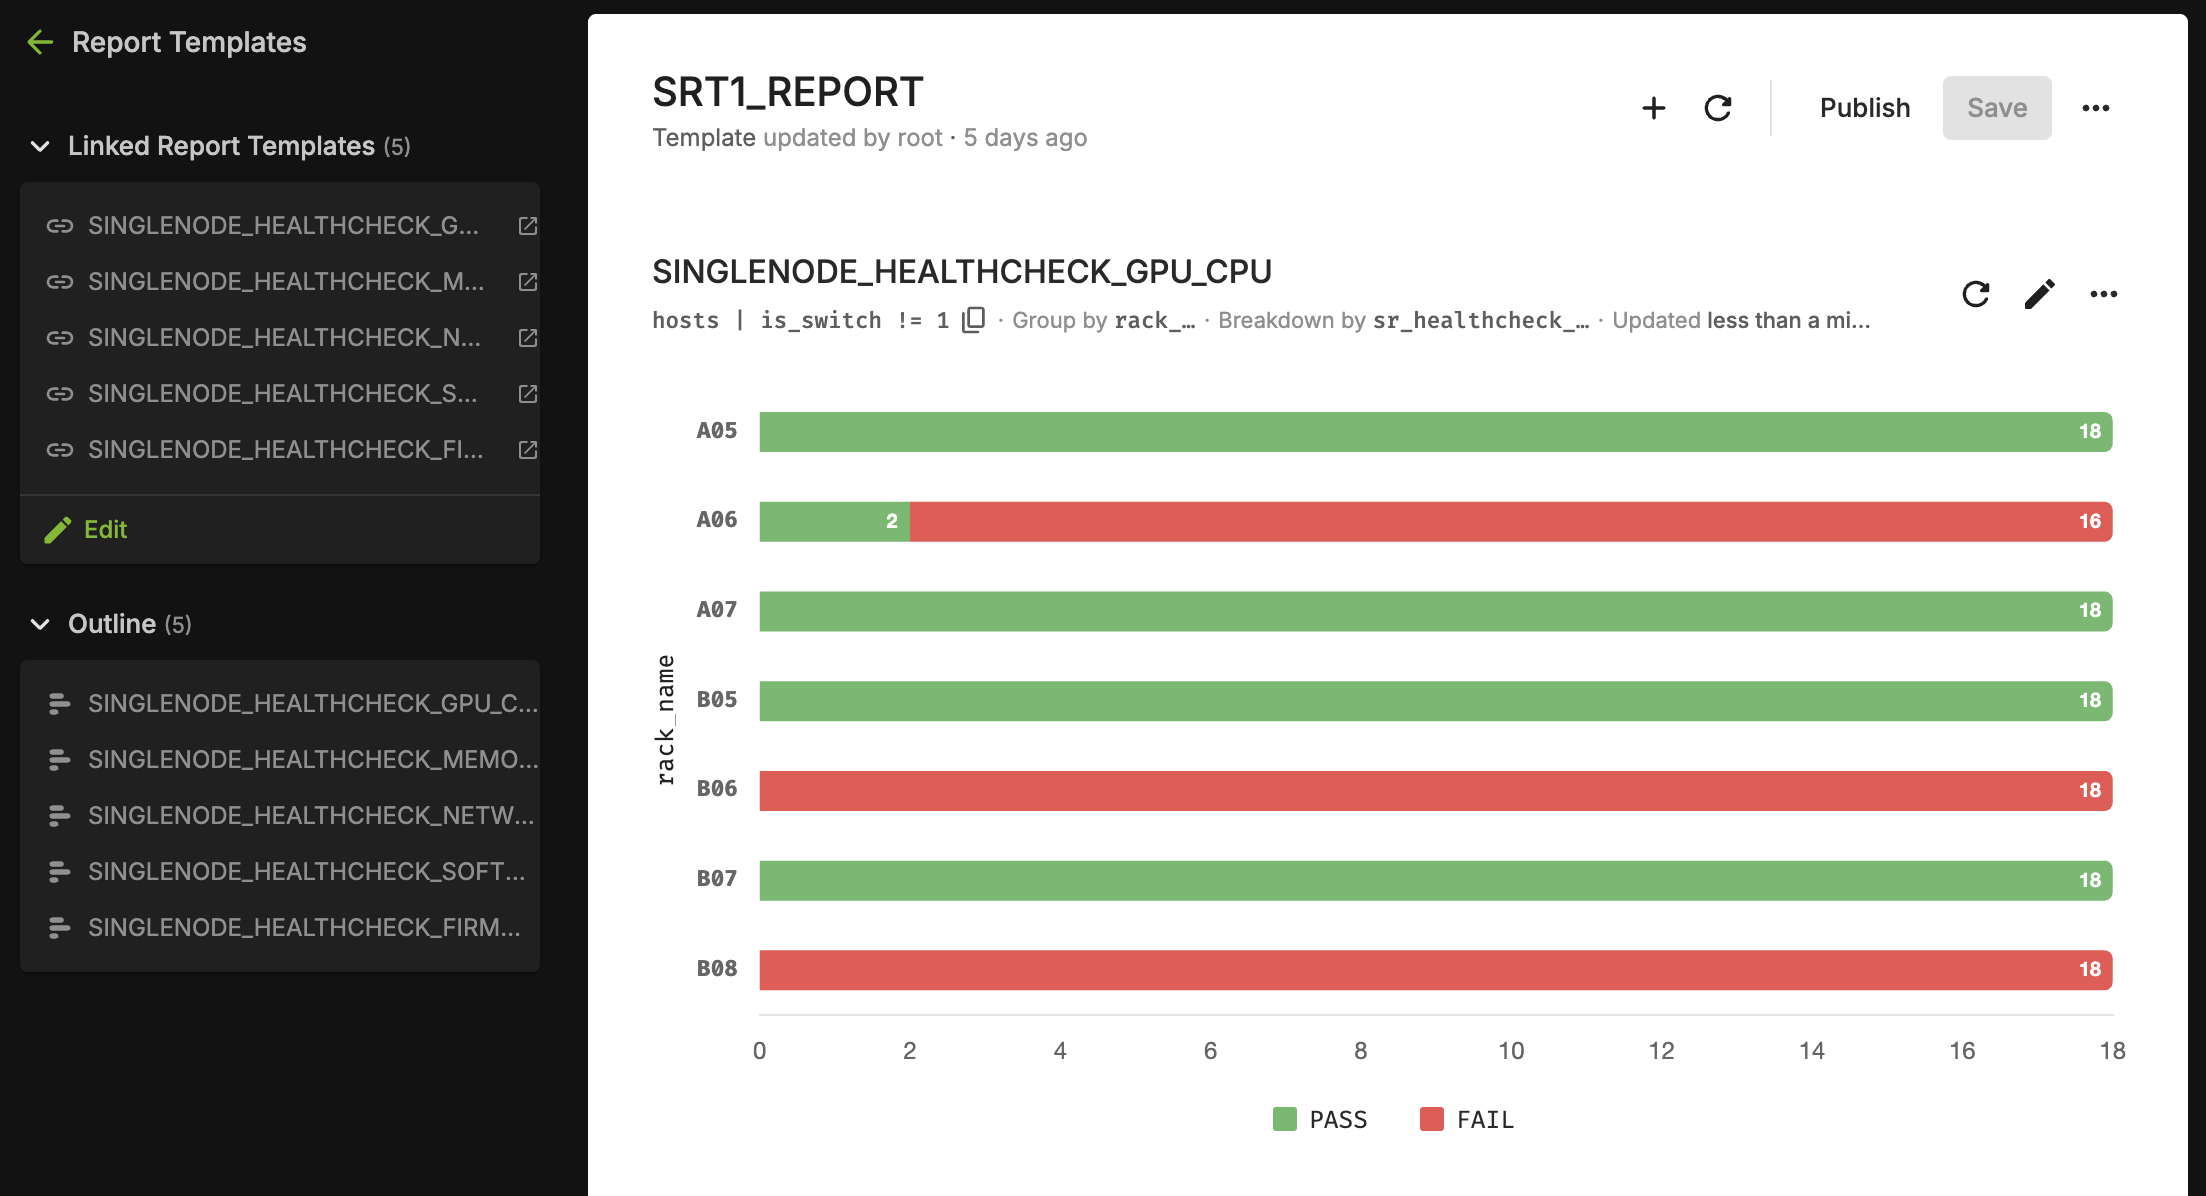
Navigate to the report corresponding to SINGLENODE_HEALTHCHECK_GPU_CPU and scroll to the tests that are failing.
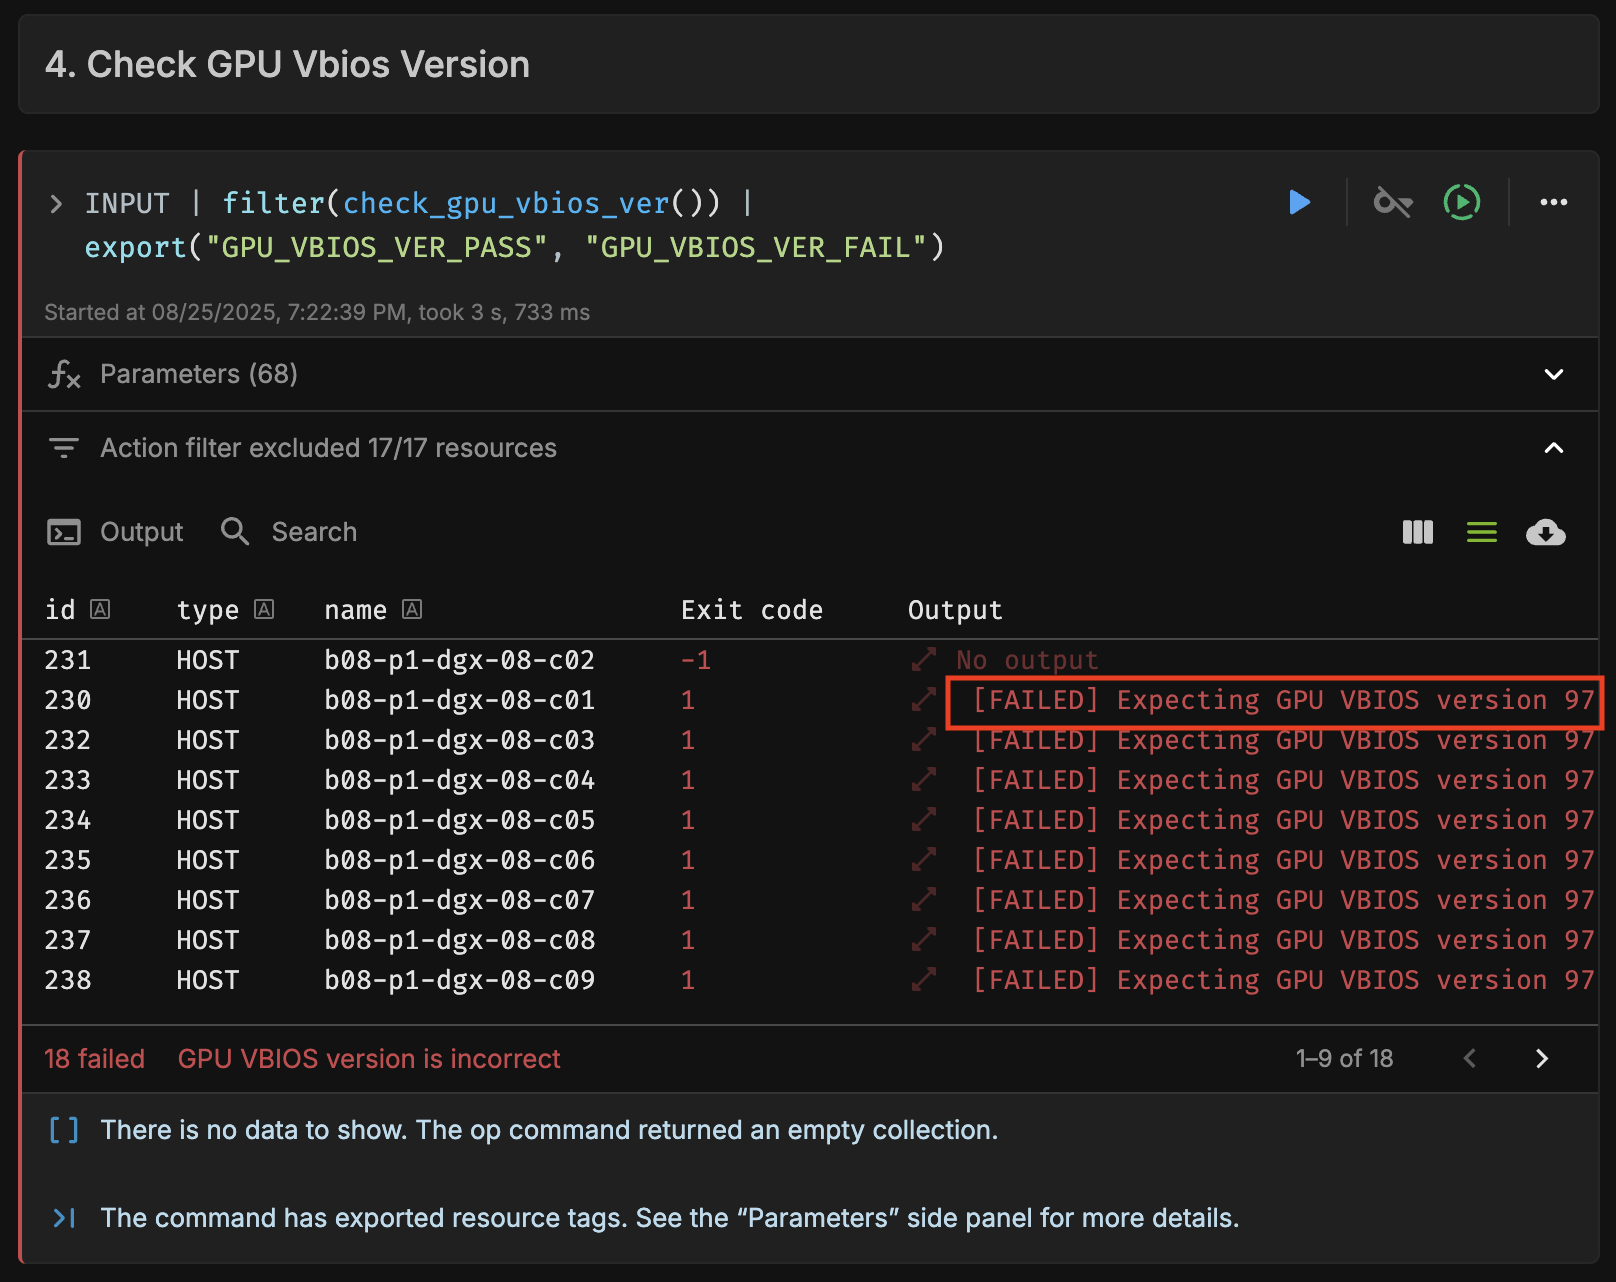
In this example, GPU VBIOS Version has failed for all the trays. Click on the bar for one of the racks to list the resources that the test failed on.
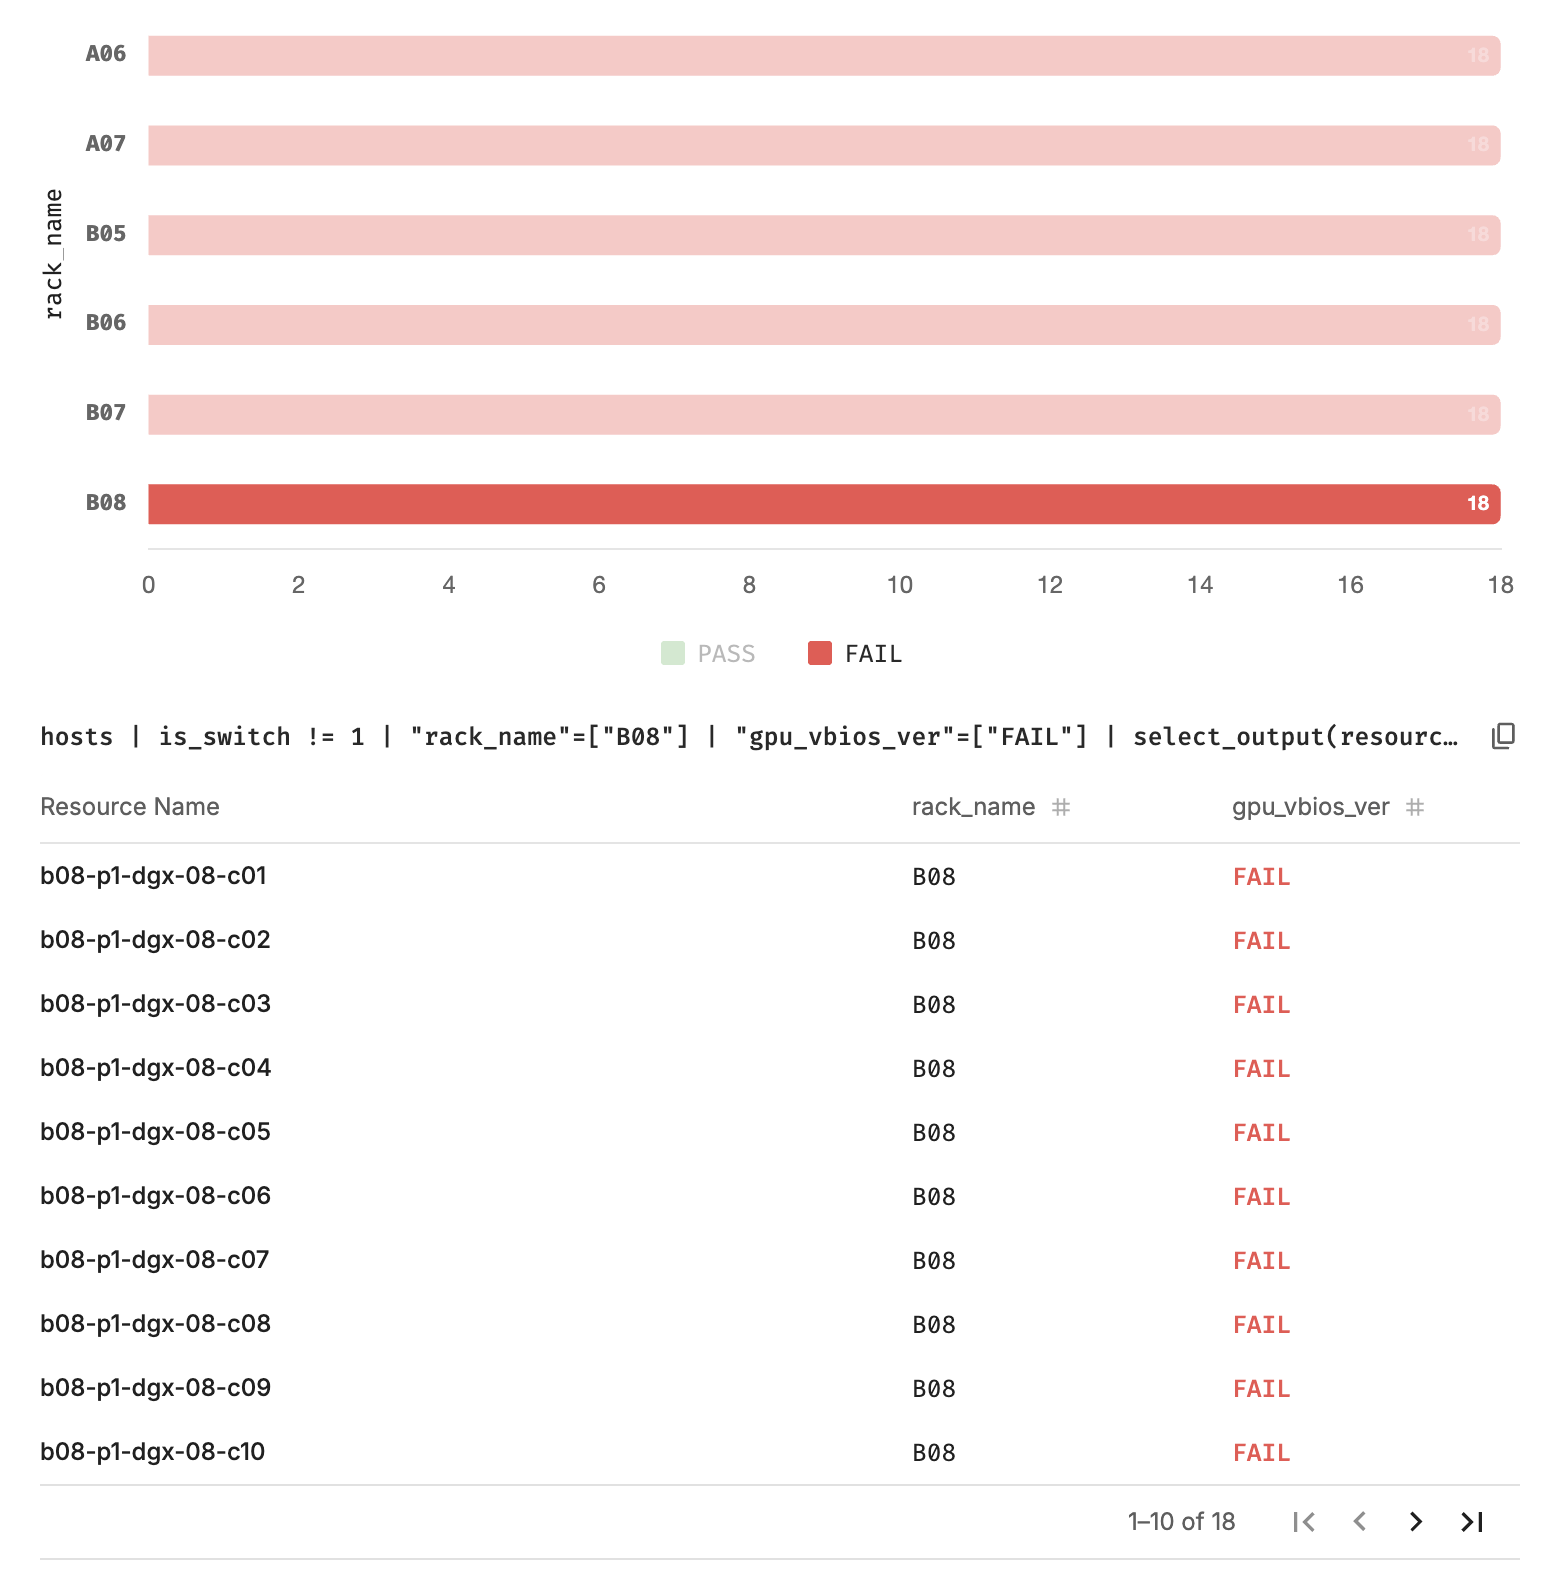
Click on the status (FAIL) which directly links you to the runbook where these tests failed. You can also do the same for tests that passed by clicking on the PASS status.

The errors in the runbook are outlined to the left of the screen. Navigate to the test that we are debugging (VBIOS). Alternatively, you can also scroll through the run to find the failed tests.
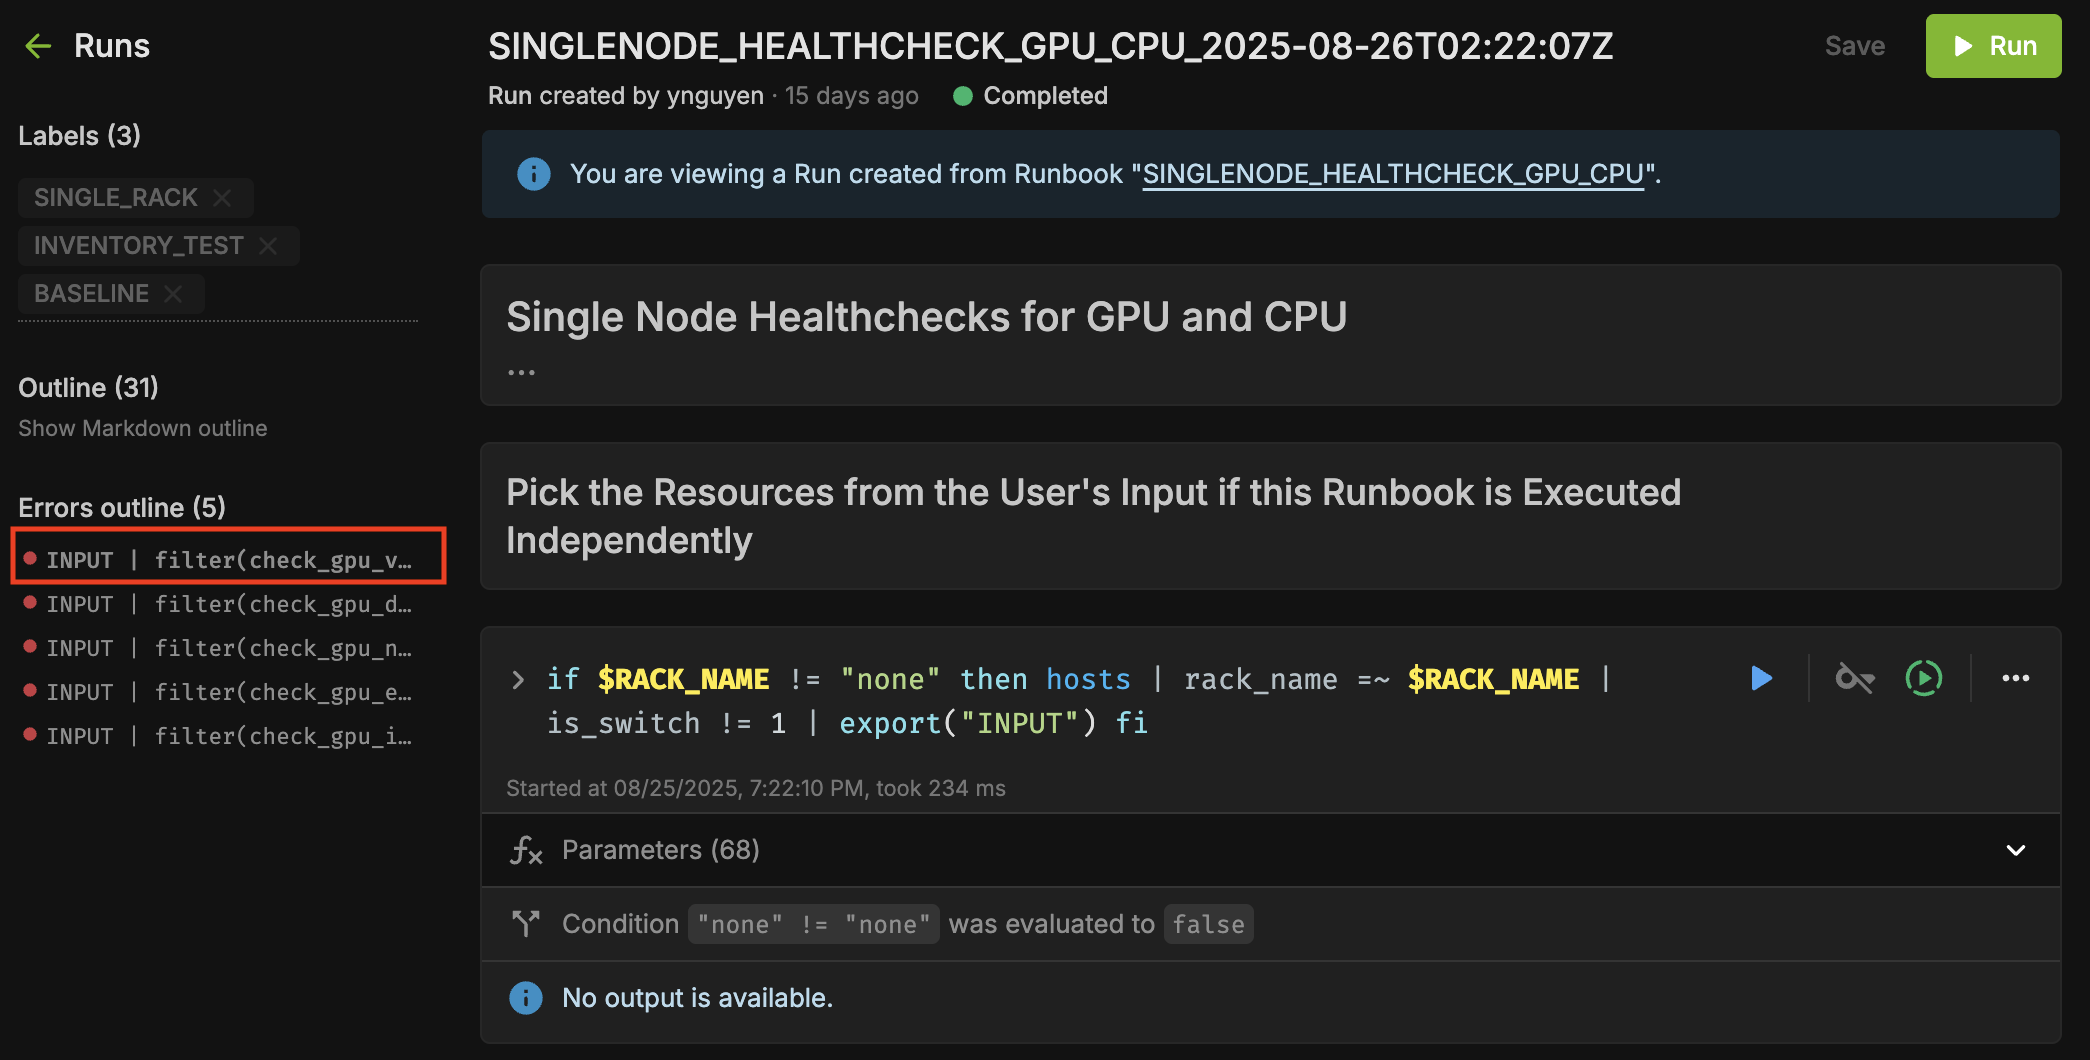
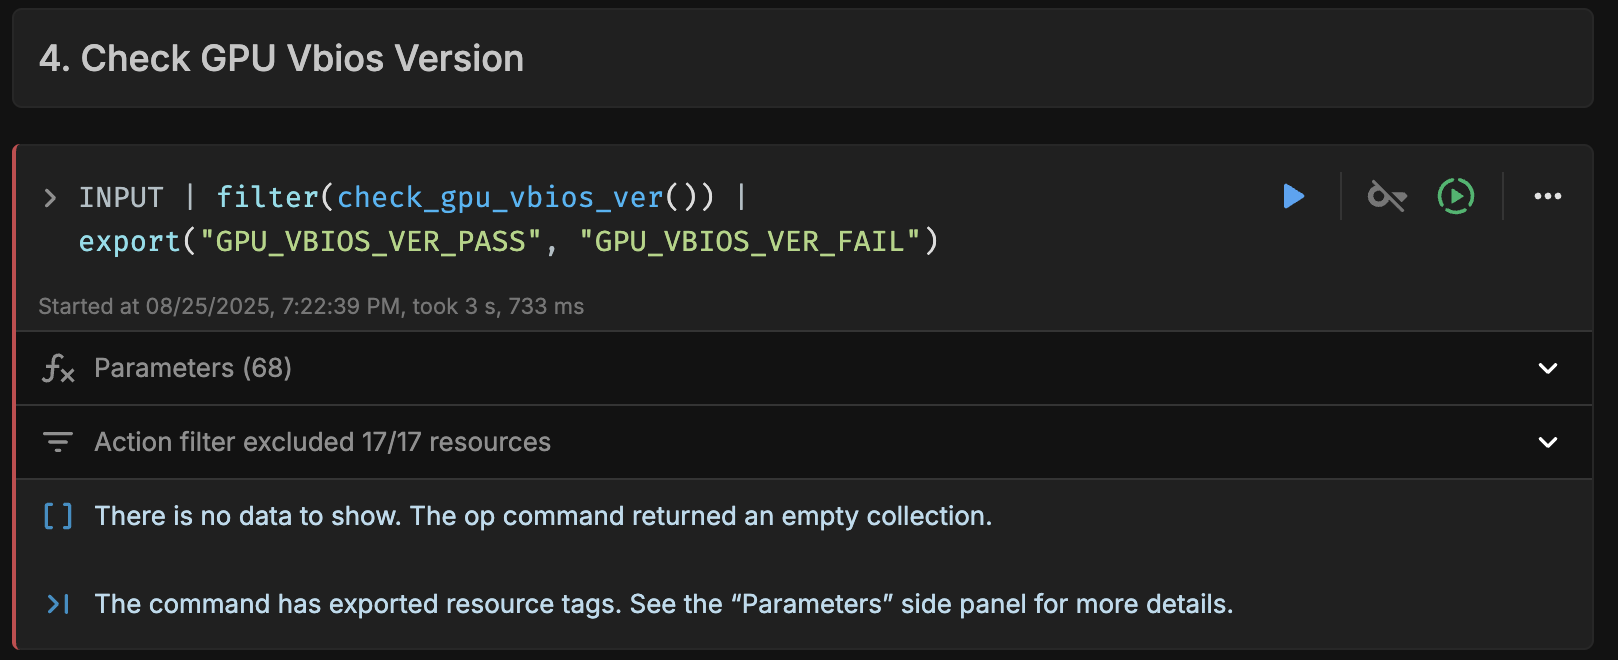
Click on the “Command filter excluded x/y resources” to get detailed output for each resource.
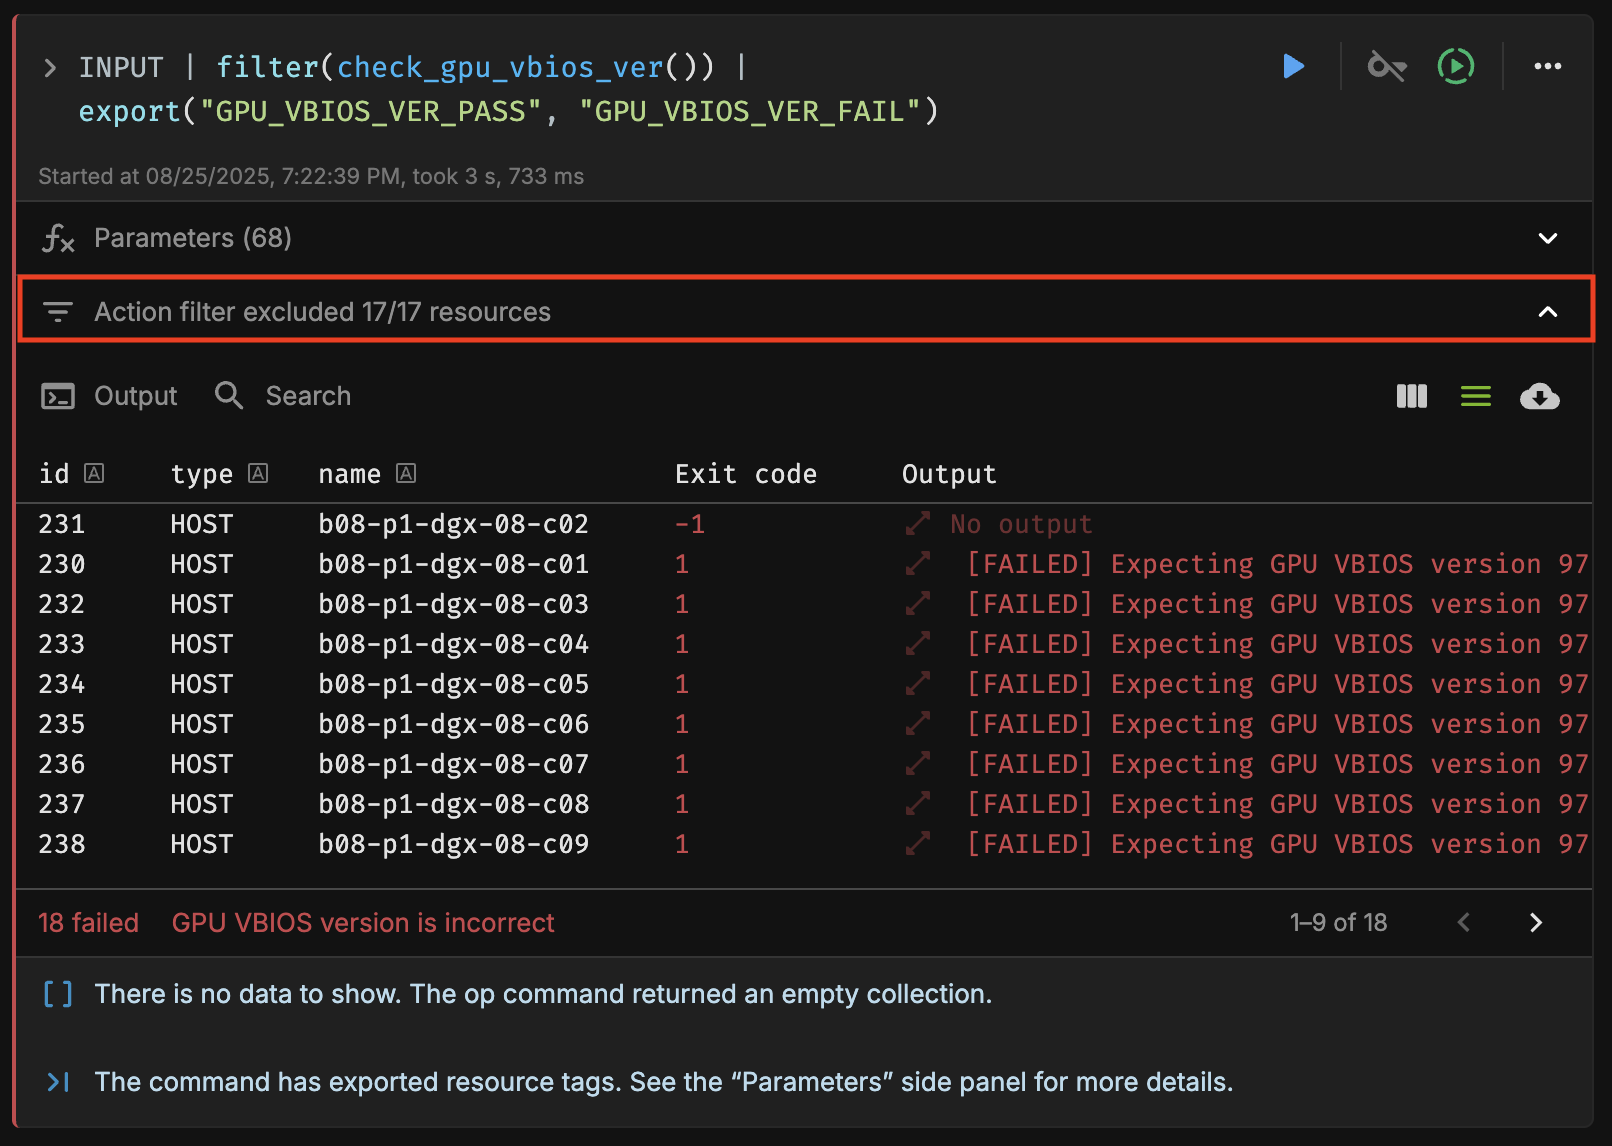
Click on the Output to view the detailed logs

Firmware Reports#
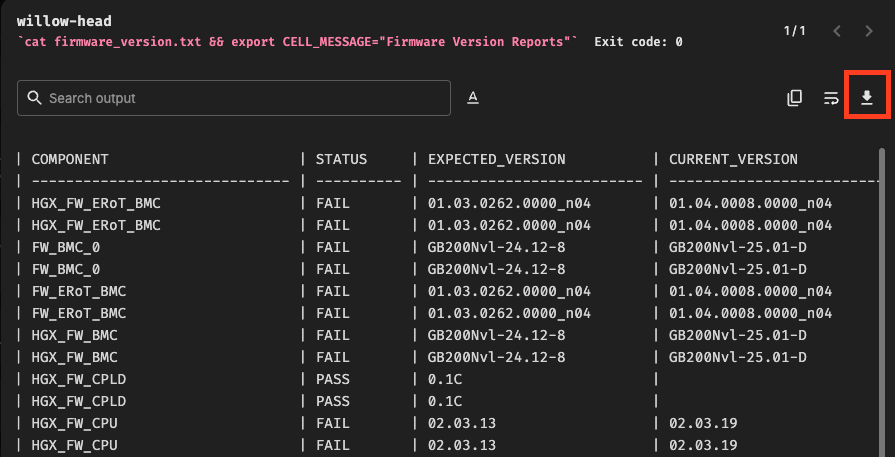
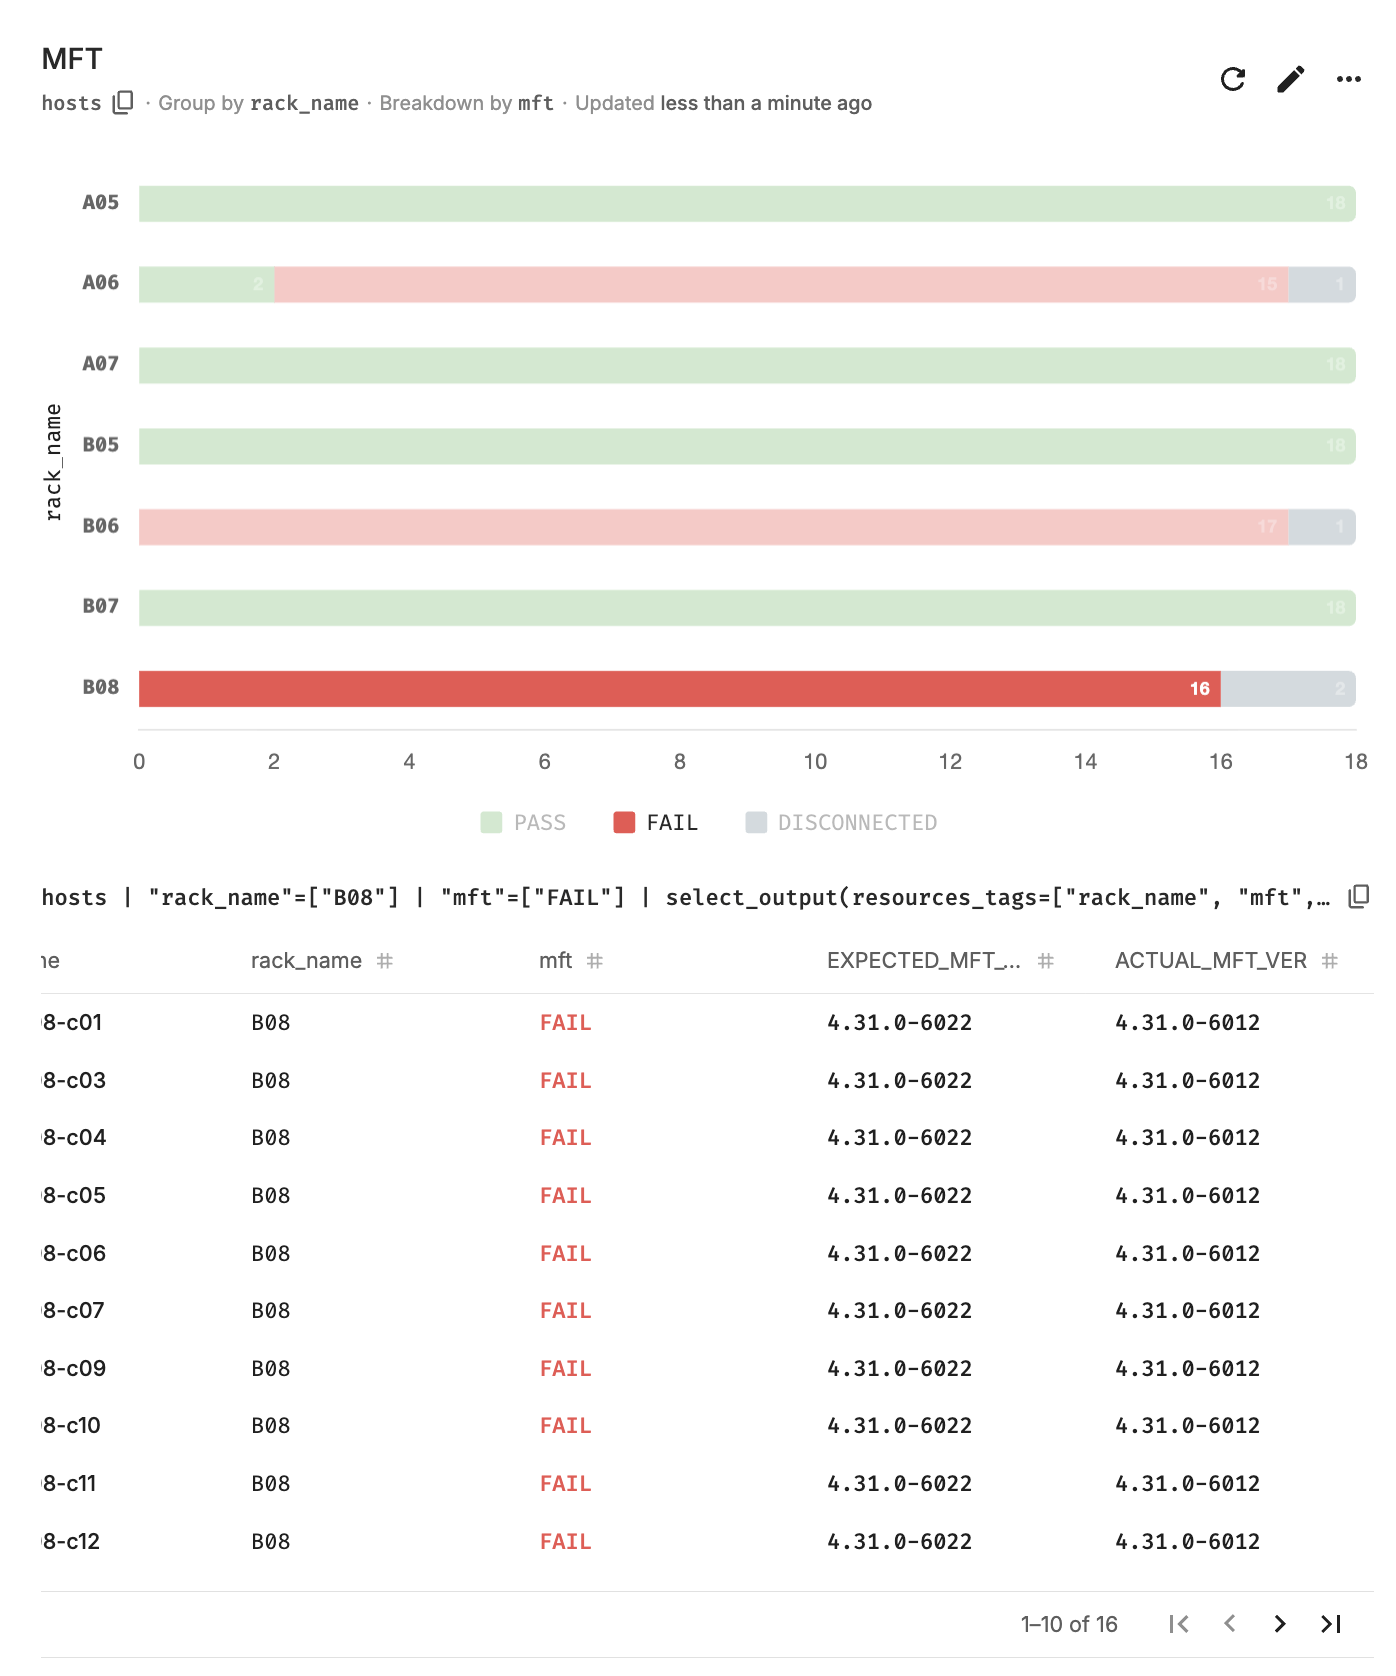
For Firmware Checks, NVIDIA Mission Control autonomous hardware recovery offers a tabular report detailing the status of each node. The report includes:
Pass/Fail Status: Indicates whether the firmware check for each node passed or failed.
Expected Version: Shows the firmware version that was expected for the node.
Current Version: Displays the actual firmware version currently installed on the node.
Navigating to Tabular Report for Firmware Checks#
You can access the SINGLENODE_HEALTHCHECK_FIRMWARE_<timestamp> report either through the Runs (Check Job Status and Result) section or by navigating to the Runs History (see Root Cause Analysis).
Scroll to the last cell of the execution and click on the output of the cell.
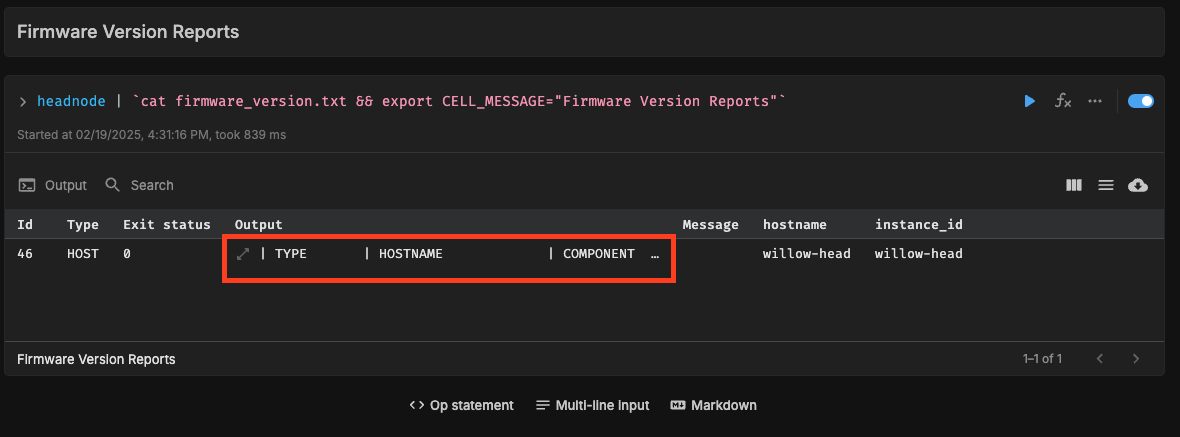
You can scroll horizontally and vertically to view the complete output. Additionally, you have the option to download the cell output for further analysis.
You can also navigate to the Reports section and view the tabular output by clicking on the status bar. This includes both the expected firmware version and the current firmware version.
Resource Dashboard#
NVIDIA Mission Control autonomous hardware recovery dashboard provides a comprehensive view of the status of all resources in the cluster, displaying the progress of testing at various stages for each node (control, compute and switch nodes). It shows which tests are completed, which ones have passed, and which have failed. This allows users to easily track the overall health and status of the cluster, identify any issues, and assess the readiness of each resource.
Navigating to the Resource Dashboard#
Visit the NVIDIA Mission Control autonomous hardware recovery homepage, navigate to the ‘Resources’ menu, and click on ‘Dashboards’ to access the dashboard page.
The Landing page contains two tabs: Dashboards and Dashboard Views.
The Dashboards lists all the Dashboards available. All these dashboards reflect the current status of the cluster and the test status.
A Dashboard View is a snapshot of the Dashboard that captures the data at a specific point in time. This snapshot remains static, preserving the exact state and data of the Dashboard as it appeared at that moment, regardless of any future changes or updates to the live data.
DGX_SUPERPOD_BASELINE_TESTING_DASHBOARD#
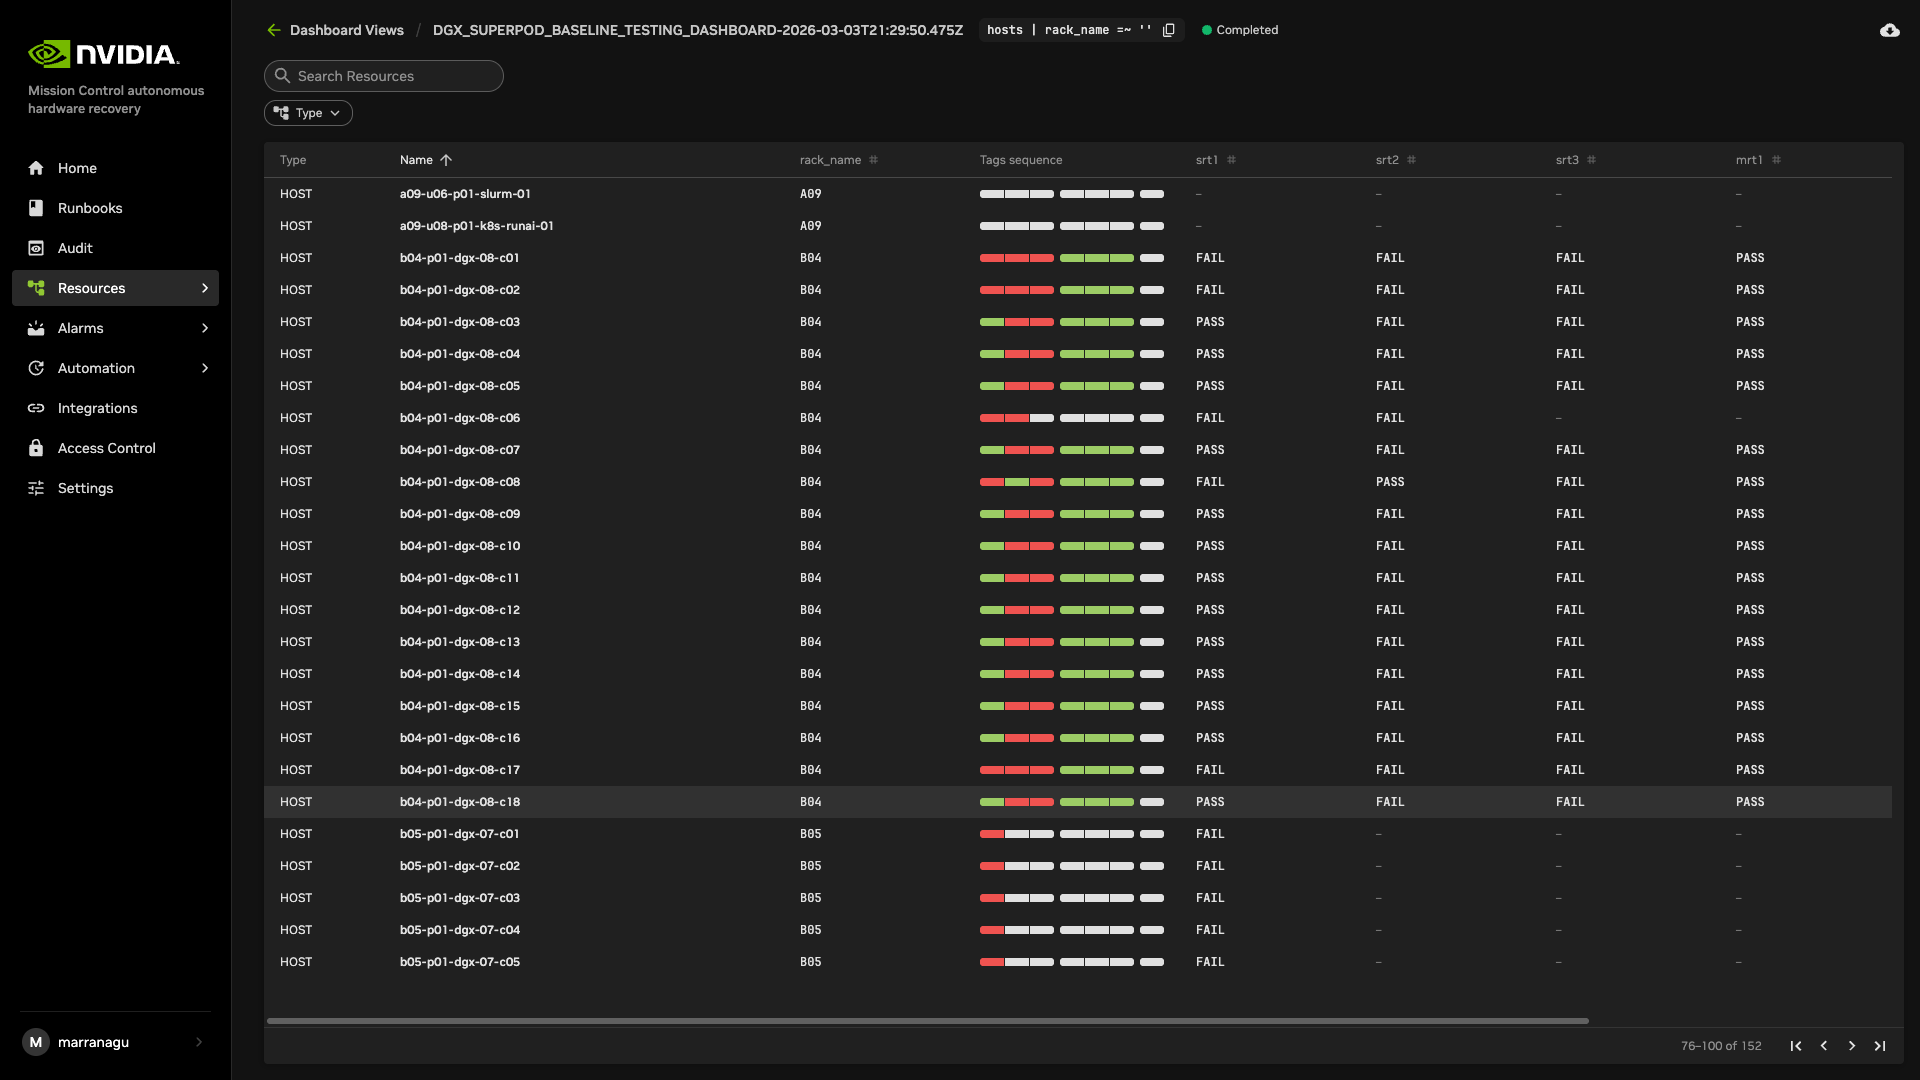
The DGX_SUPERPOD_BASELINE_TESTING_DASHBOARD provides a detailed view of the cluster’s resources and the status of the baseline tests. Specifically, it tracks the progress of two key testing phases for each resource: SUT and MUT.
Resource Status: The dashboard displays all resources within the cluster, such as compute nodes, control nodes, and switch nodes, along with their associated status.
Hostname & Rack Information: For each resource, you will see the hostname and rack name, along with a Tag sequence that indicates the stage of both the SUT and MUT tests.
Test Stage Progress: The rows in the dashboard reflect the current status of each test stage. Each stage (SUT and MUT) has a corresponding tag name that visually represents its test progress, showing whether the stage has been successfully completed, is in progress, or has failed.
Snapshot of Cluster Health: The dashboard offers a comprehensive snapshot of the cluster’s readiness. It allows users to identify potential issues early, track the completion status of tests, and quickly assess which resources are ready and which ones may require attention.
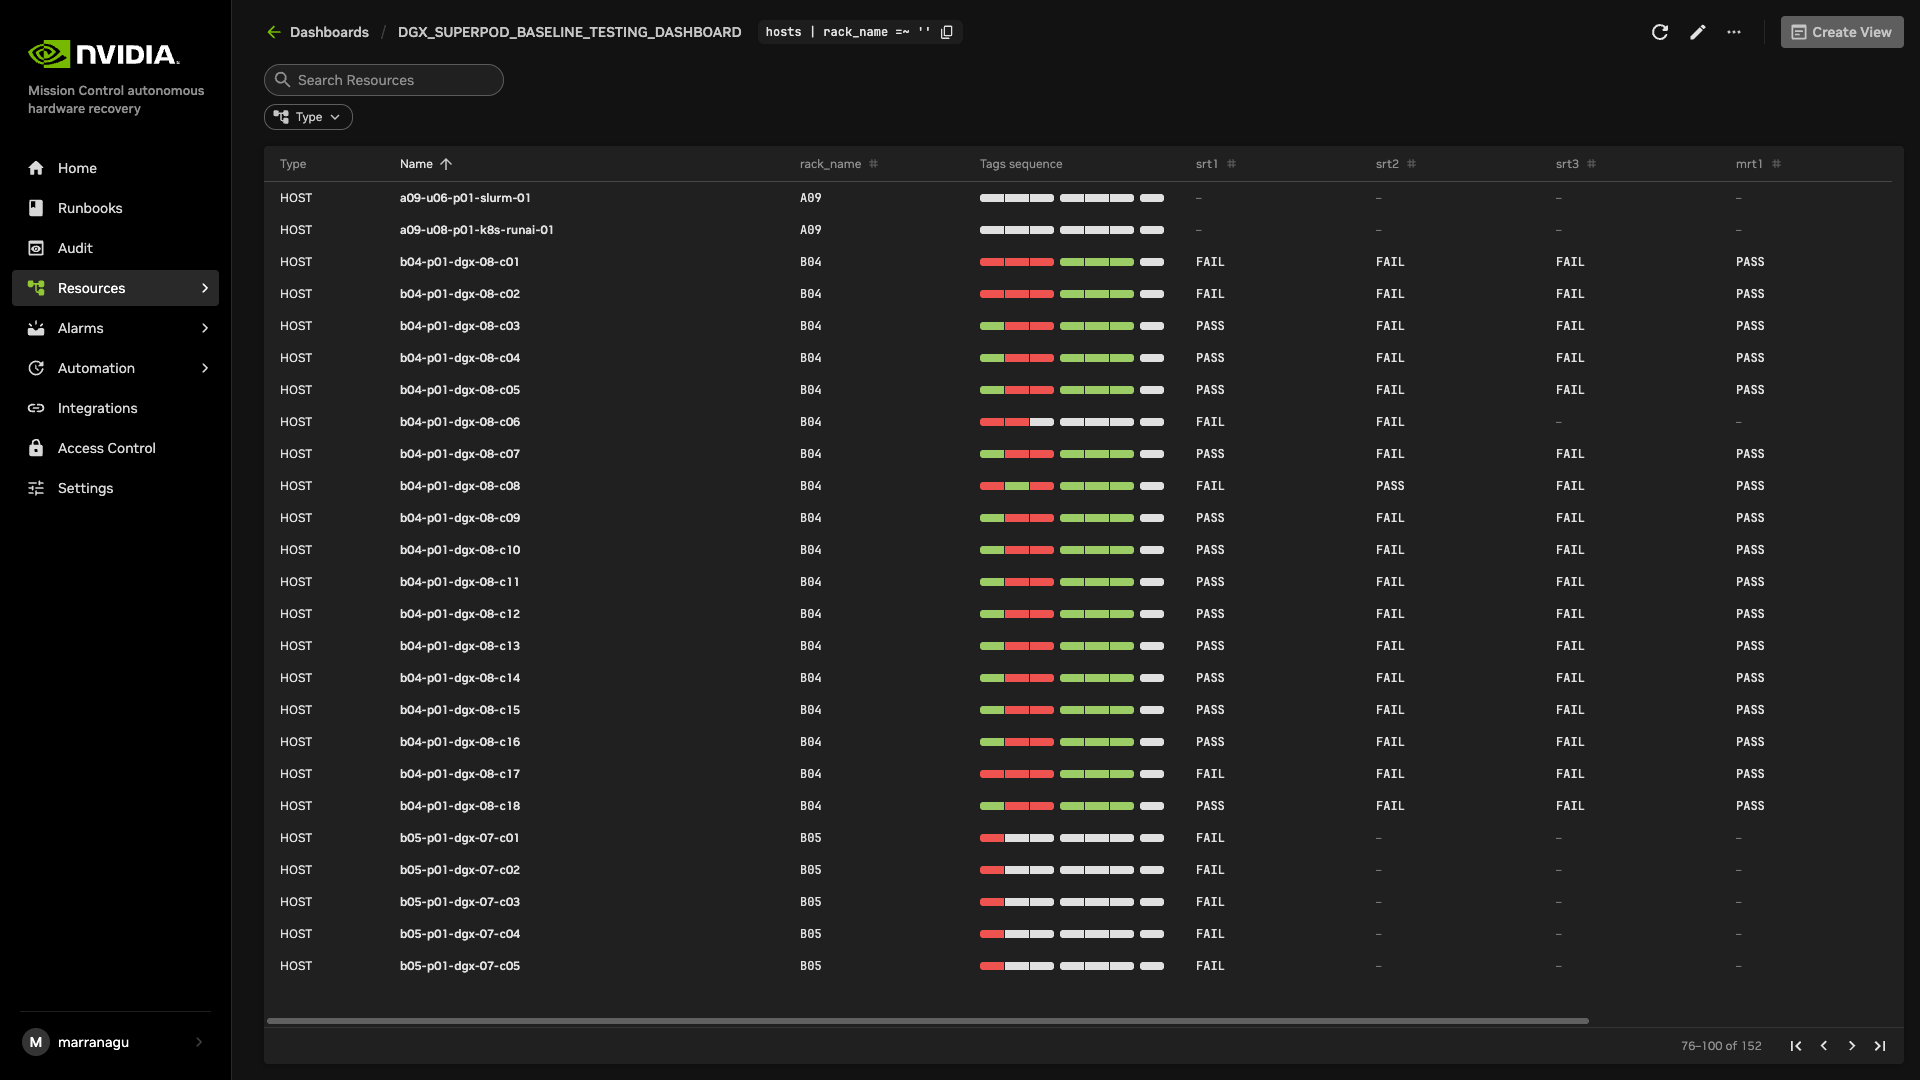
The dashboard allows you to sort the resources by Name, Rack, or Progress Bar, making it easier to organize and view the status of your cluster based on your preferred criteria.
Name: Sort resources alphabetically by their hostname for quick access.
Rack: Sort resources based on their rack assignment, ideal for organizing by physical location.
Progress Bar: Sort by test progress to focus on resources at different stages of testing or to identify incomplete tasks.
Creating a View / Snapshot#
To create a snapshot of the dashboard, follow these steps.
Click on the “Create View” button located at the top right corner of your screen.
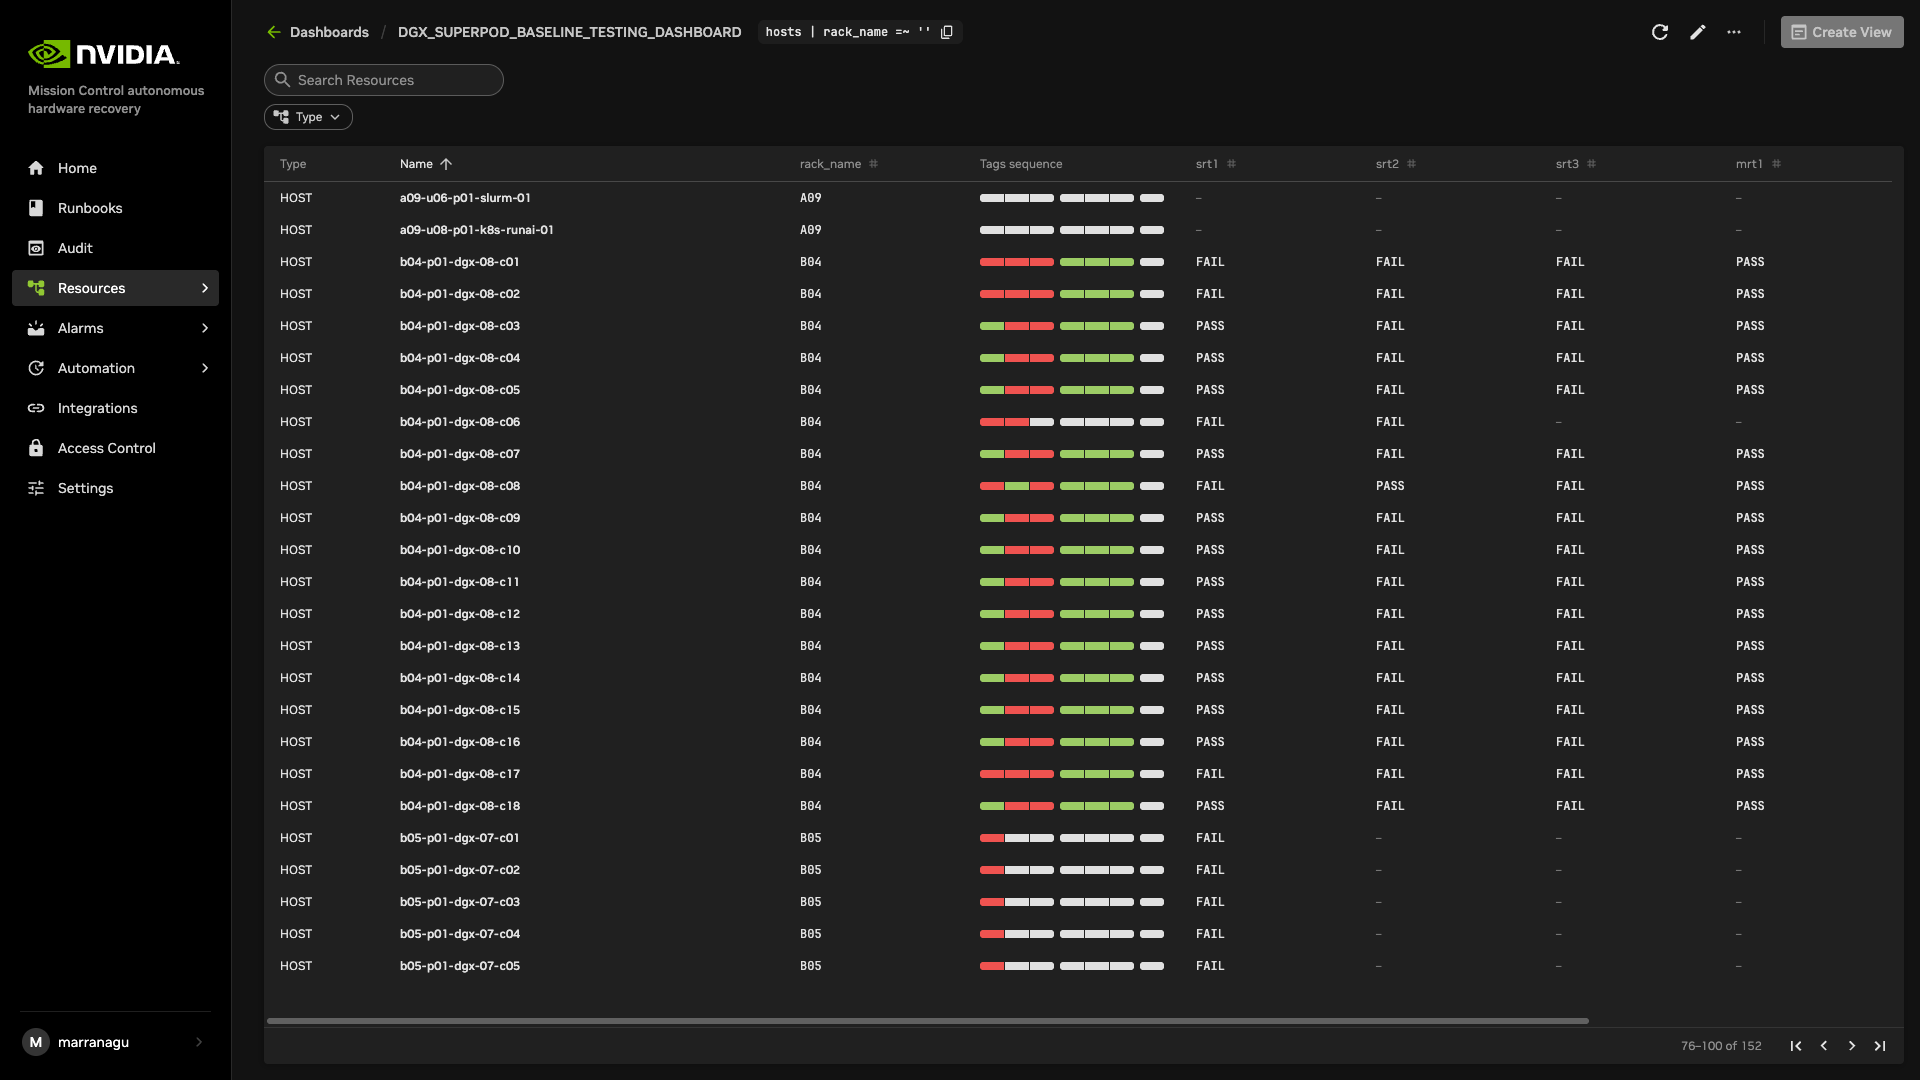
Retain the auto-generated name for the dashboard which includes the timestamp or provide your own name.
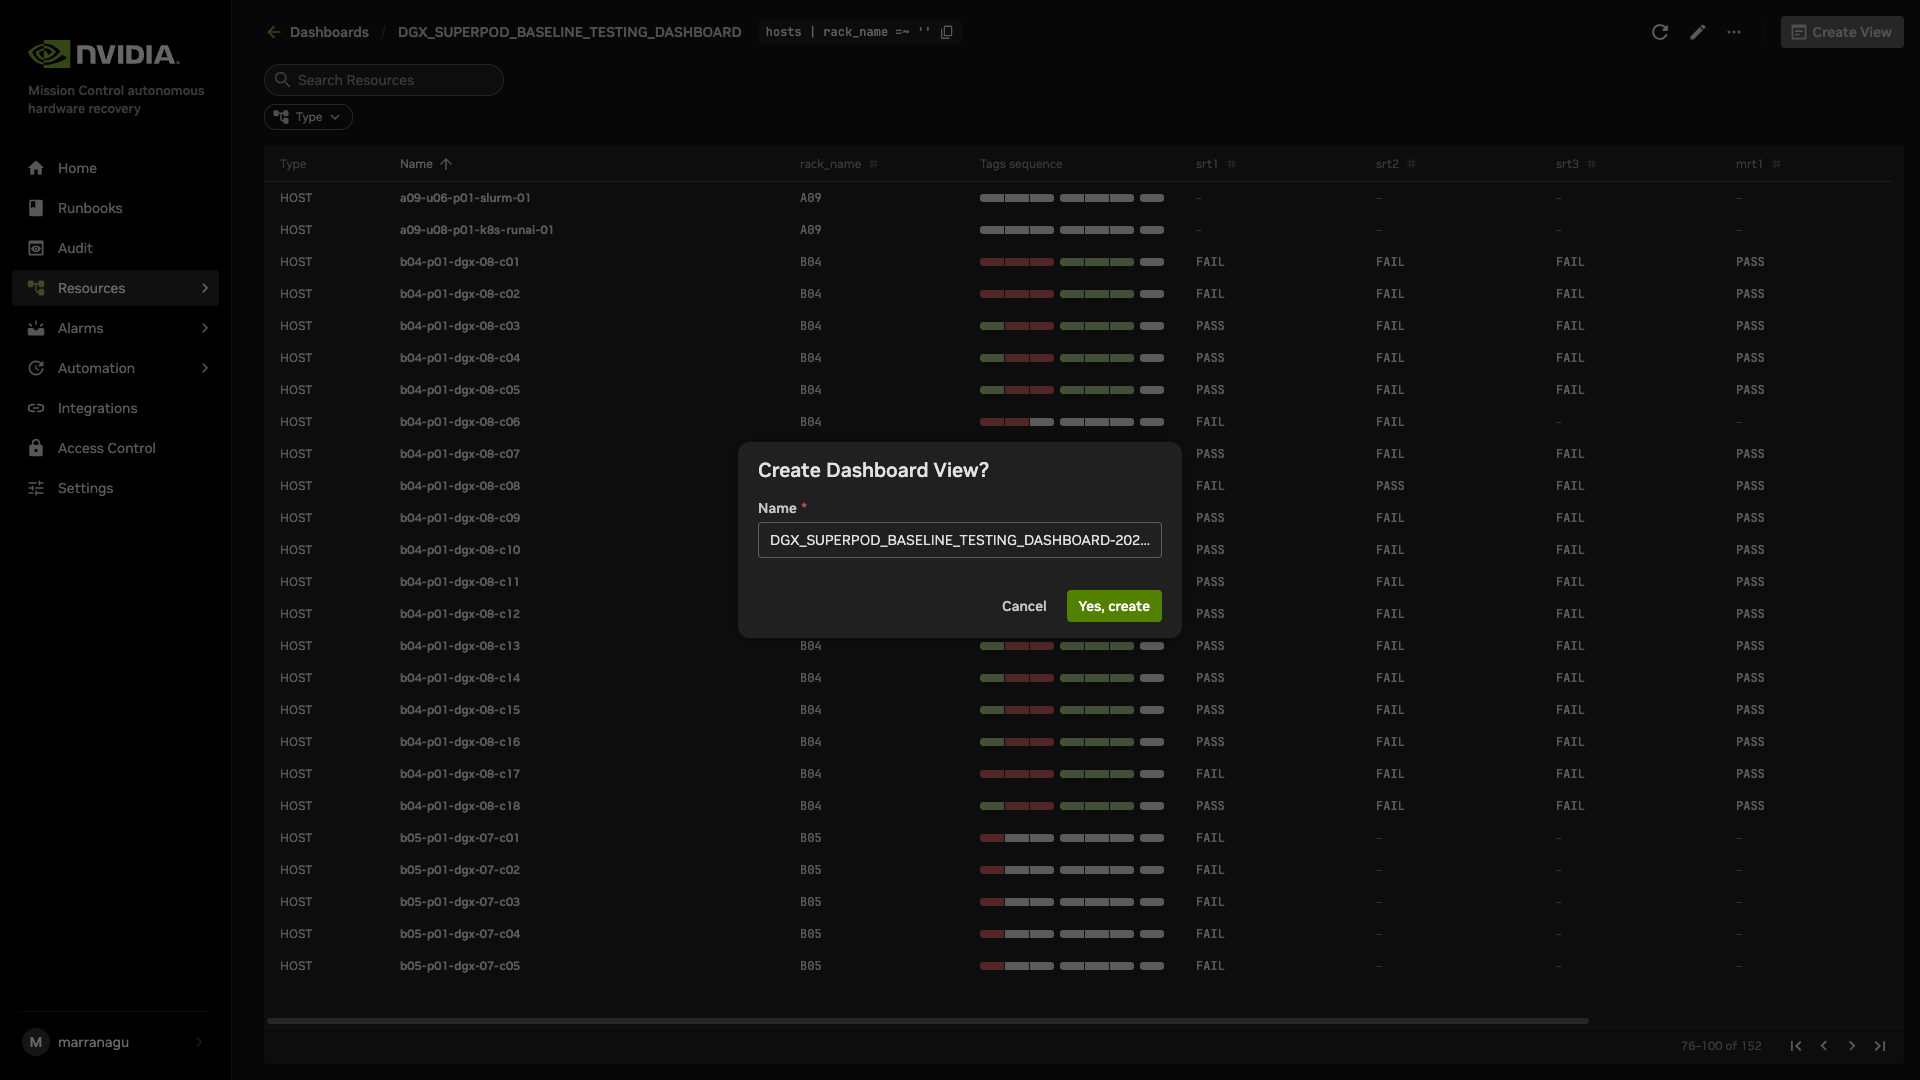
Once the Dashboard View is created, a pop-up notification will appear with a hyperlink to access the Dashboard View.
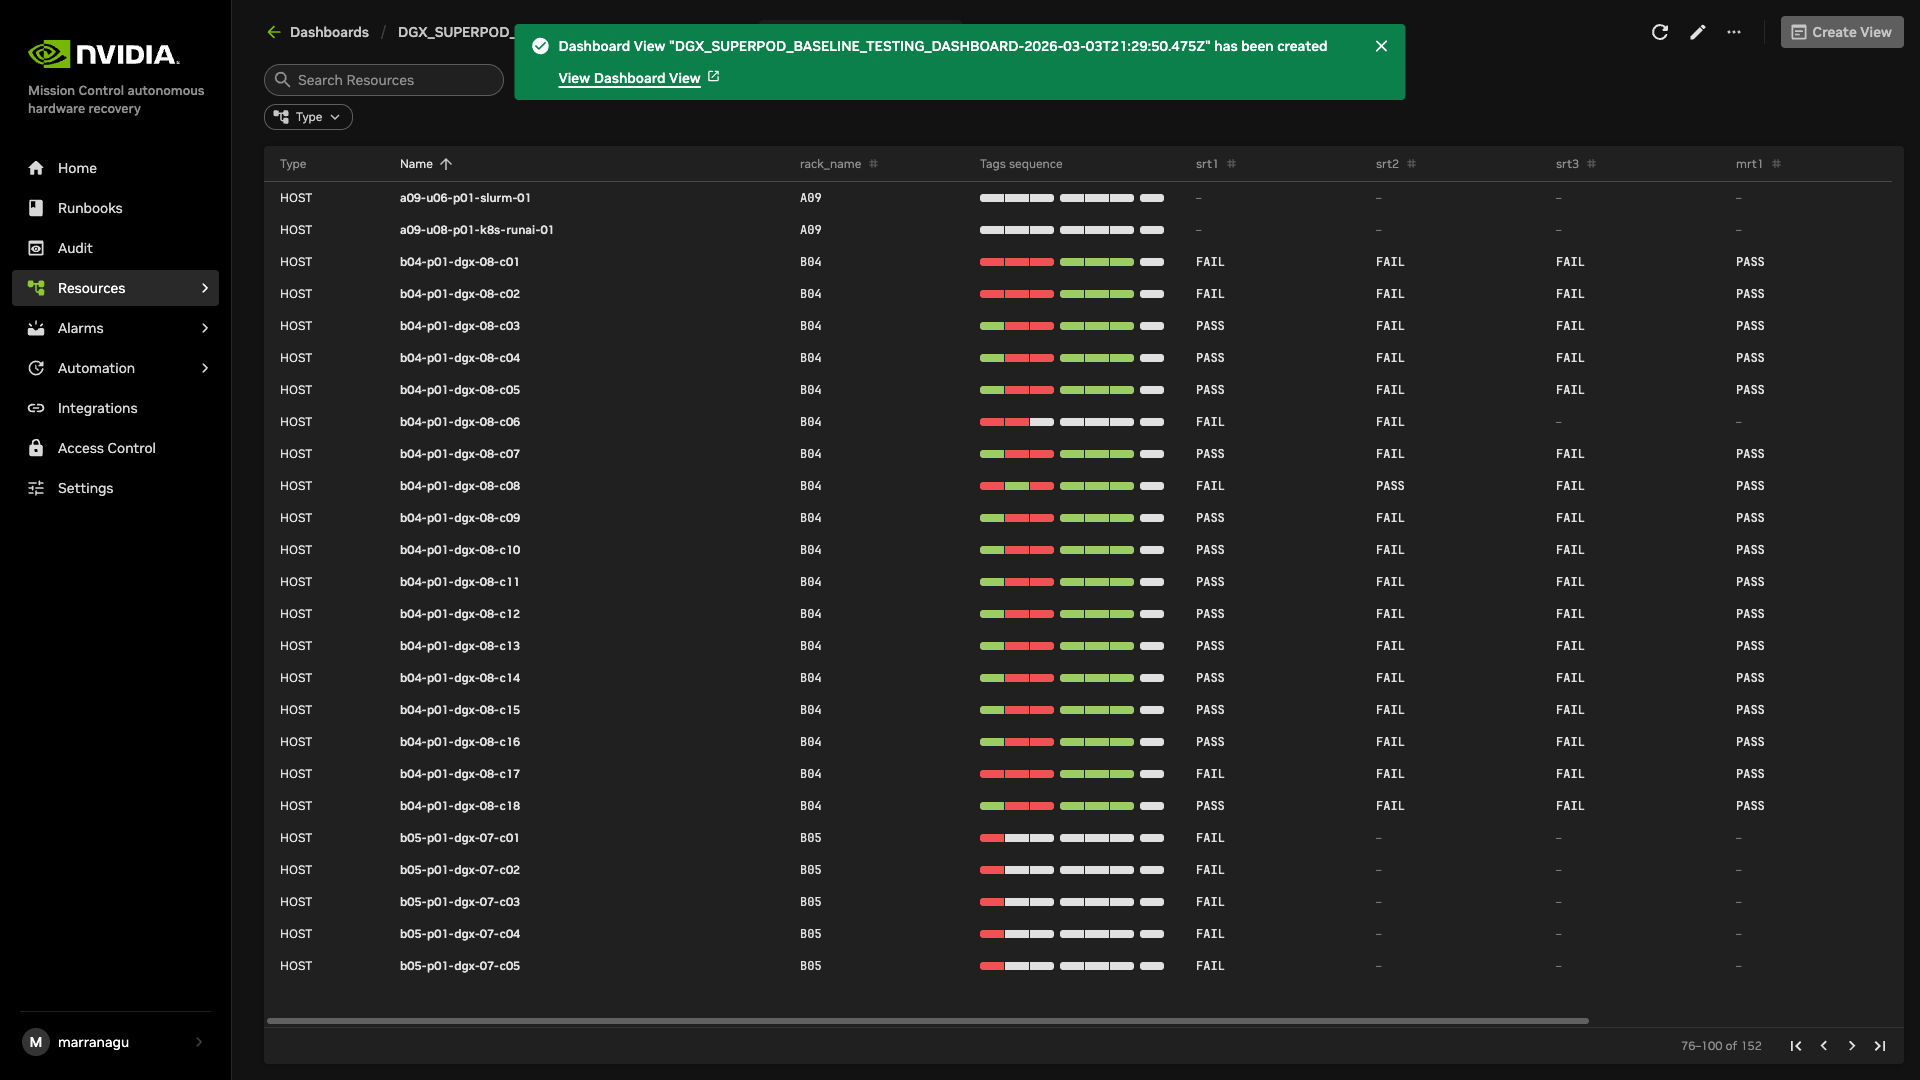
The Dashboard View created can be downloaded as a CSV to further manipulate the data to generate reports.
Automated Health Checks with NVIDIA Mission Control autonomous hardware recovery#
Introduction#
NVIDIA Mission Control autonomous hardware recovery provides a full suite of automated health checks to detect failures at the tray, rack, and system levels. In addition, system wide health checks are performed by integrating with the UFM and NMX-M network control planes. Health check data is reported back to BCM’s BaseView and/or the in-cluster LGTM stack. These health checks are performed at two layers: BCM job invocation, and as periodic health checks via NVIDIA Mission Control autonomous hardware recovery.
Alarms Dashboard#
The alarms dashboard is an overview of all alarms and the state of your system. In this view, alarms are summarized by counts of alarms firing, alarms firing most frequently, and a configurable list of most frequently firing, canceled, or resolved alarms. This is meant to be a starting point for any investigations of possible issues with your systems, and you may click any alarm for further details.
BCM Slurm Job Lifecycle Checks (Prolog and Epilog)#
When a Slurm job is submitted, the Autonomous Hardware Recovery Agent automatically runs a set of checks at the start and end of the job to validate node health and stability. These are known as Prolog and Epilog checks.
Prolog Checks (run before the job starts):
If a check fails, the node is marked as DRAIN, and the job is re-queued.
If it passes, the job proceeds normally.
Epilog Checks (run after the job finishes):
If a check fails, the node is also marked as DRAIN.
These scripts are automatically pushed to each node when the job runs, but they are not visible or configurable through the NVIDIA Autonomous Hardware Recovery UI. To review them, navigate to Shoreline_files/scripts/slurm in the NVIDIA Mission Control package.
Note: Prolog and Epilog checks are disabled by default and should only be enabled after the nodes are confirmed to be healthy. Use the following runbooks to manage them:
SLURM_CHECKS_ENABLE– enables the checksSLURM_CHECKS_DISABLE– disables the checks
Unlike the Prolog and Epilog checks, Periodic Checks are defined within the NVIDIA Mission Control autonomous hardware recovery interface as Alarms, and are detailed in the next section. They will be automatically enabled for racks that pass Single Rack Testing but may also be manually enabled or disabled for specific racks by running the “ALARMS_ENABLE” AND “ALARMS_DISABLE” runbooks.
Periodic Health Checks (Alarms)#
Periodic Checks are separate from Prolog and Epilog and run at regular intervals to monitor system health. These are managed as Alarms in the NVIDIA Autonomous Hardware Recovery UI and perform the following:
Automatically enabled for racks that pass Single Rack Testing
Automatically disabled during firmware upgrade and Break/fix
Can be manually enabled or disabled at any time
The alarm_base is the Resource Query they run against. To control them manually, use the following runbooks:
ALARMS_ENABLE– enables periodic alarms for selected racks. Note that a node having themaintenancetag will override these settings.ALARMS_DISABLE– disables them
Periodic Checks are fully visible and configurable in the UI through the alarm section. The following is a list of the configured Alarms, grouped by their check interval:
Frequent Checks (5m)#
bmc_sensors#
Checks the sensors from the Baseboard Management Controller (BMC) to ensure the proper data is returned.
sysmem#
Checks that all expected memory DIMMs are present.
dns_host#
Checks the DNS configuration and resolution for the host.
eth_state#
Checks that the ConnectX devices are present, active, and in the physical LinkUp state via ibstat, and also matching the expected transfer rate
raid_count#
Checks that the raid configuration matches the expected mdstat configuration.
gpu_temp_history#
Checks System Event Log (SEL) history looking for GPU temperature issues.
gpu_alloc_temp#
Checks if the GPU temperatures are above a threshold.
periodic_bmc_host_checks#
The following groups of periodic functional checks are a subset of the BCM Prolog checks that run at predefined intervals as NVIDIA Mission Control autonomous hardware recovery Alarms.
check_bmc_ipmi_version - Checks BMC IPMI version against an expected value
check_nvidia_module_loaded - Verifies the NVIDIA module is loaded in the host OS
check_host_os_version - Verifies the DGX OS version matches the expected value
check_nvsm_status - Verify the NVSM service is currently active
periodic_cpu_mem_checks#
check_cpu_health - Verifies CPU sockets and cores are present and online
check_dimm_count - Checks that all expected memory DIMMs are present
check_dimm_size - Checks that the size of each memory DIMM matches the expected values
check_memory_swap_size - Checks that the memory swap size matches the expected value
periodic_gpu_nvlink_checks#
check_gpu_pci - Checks that all GPUs are present on the lspci interface and with the correct link width and speed
check_gpu_error - Checks GPUs for ECC errors, retired pages, and throttles present
check_gpu_powerstate - Checks the powerstate for each GPU and compares against an expected value
check_gpu_param - Checks that specified GPU parameters are present and correct for the host
check_nvlink_health - Checks that links are active for each GPU, the speed is correct, fabric registration has been completed, are running at full bandwidth, and belong to the same NVLink domain and partition.
check_gpu_topology - Checks that there are no issues with the p2p topology within the node
check_gpu_telemetry - Checks that various sensors can be successfully read from the GPU via nvidia-smi
check_gpu_power_limit - Checks that the power limit is correct for each GPU
check_nvidia_inforom_ver - Checks that the inforom version is correct for each GPU
check_gpu_clock_info - Checks that the maximum clock speed is correct for each GPU
check_remapped_row - Checks if any remapped row events have occurred
periodic_network_checks#
check_ib_ber_and_ro - Checks if the PCI_WR_ORDERING field is set to relaxed and also the bit error rate of the ConnectX using mlxlink
check_ib_port_rcv_errors - Check Infiniband devices port RCV errors
check_ib_cables - Checks the cable info using mlxcables
check_bf3_speed - Validates that the BlueField devices are operating at the correct speed and that the proper number of devices are in the “Up” state. This check will run, but never fail
periodic_storage_checks#
check_pex_switch_health - Checks that the PEX switches are present, have the correct PCIe link speed and width, and the downstream devices have enumerated to lspci
check_cx_config - Checks that the ConnectX devices have the correct PCIe link speed and width via lspci and ACS config via setpci
check_nvme_health - Checks that the PCIe link speed and width of each NMVe device matches the expected value
check_storage_dir - Checks that the host has functional access to the home storage
check_storage_util - Checks that the used local storage on the host is below a given threshold
periodic_error_checks#
Checks journald for machine check events, Xid, AER, CPER, I/O, GPU fell off the bus, and other generic errors.
Hourly Checks#
nfs_mounts#
Verifies required mount points.
daily_informational#
Checks for which the severity and remediation may not be critical. This alarm will only be triggered once per day, and results may be viewed in the resulting runbook run.
check_sel_event - Read the SEL events from the BMC and ensure none are asserted
check_dgx_os_version - Verifies the DGX OS version matches the expected value
check_gpu_vbios_ver - Checks the VBIOS version of the GPUs and compares against an expected value
check_nvme_fw_ver - Checks that the FW version for each NVMe matches an expected value
check_kernel_commandline_opt - Verifies the specified kernel option(s) is present in the current kernel’s boot parameters
check_host_bios_ver - Verifies the system’s BIOS version
check_kernel_ver - Verifies the current version of the Linux kernel
check_host_package_versions - Queries the installed packages on the host
nv_container_cli_info - Retrieves information about the NVIDIA container CLI (driver and devices)
Daily Checks#
cpu_stepping#
Checks that the CPU stepping parameter is correct for each CPU.
numa_node_count#
Checks that the correct count of Non-uniform memory access (NUMA) nodes are configured with the CPU cores.
NVIDIA Mission Control autonomous hardware recovery Alarm Configuration#
There are several components to an alarm, with the key pieces being the Resource Query, Fire Query, Resolve Query, Check Interval and Automation. An example configuration is shown in the following figure.
Resource Query#
The resource query allows you to customize the resources (hosts, pods, gpus) on which the checks will be performed. In the preceding example, the `hosts | name =~ “.*”` will only check alarms on hosts which have a value set for the “name” tag.
Fire Query#
The fire query is a condition that, when true, will cause the alarm to begin firing. It will be run at each interval.
Resolve Query#
Similar to the fire query, the Resolve query is a condition that will resolve the alarm when true. Resolving an alarm will cause firing to cease and the state to change to Resolved.
Check Interval#
The interval at which the fire and resolve queries are checked.
Automation#
You may use the Automation settings to have Runbooks triggered when an alarm fires, and you may also customize the informational messages that are displayed in the Alarm’s logs.
Alarm States#
If an Alarm has triggered, it will be in one of the following three states:
Triggered#
This state means the alarm is currently firing. Any automation (break/fix) will subsequently be invoked to remediate any issues, potentially resolving the alarm. Alternatively, the user could cancel the alarm by clicking the “Cancel alarm.”
Clicking into the triggering alarm will give you more details on what caused the alarm, metadata and resources relating to the alarm, and will also allow you to view log output from the check itself.
Resolved#
When the clear query of an alarm evaluates to true for a firing alarm, the status will be changed to Resolved. Automation triggered runbooks will invoke break/fix operations that should be configured to result in a resolved alarm.
Canceled#
When a user cancels an alarm from the dashboard, or from the triggered alarm itself, its state will become Canceled. Also, if an alarm configuration is changed for an alarm in the Triggered state, it will be canceled since it was triggered against a defunct configuration.
Firmware Upgrades with NVIDIA Mission Control autonomous hardware recovery#
Overview#
NVIDIA Mission Control autonomous hardware recovery provides functionality for upgrading, cycling, and verifying firmware and the corresponding OS within your GB300 racks. The distinct components for which firmware can be upgraded using this process are:
Compute trays
Switches
Mellanox
NVOS
Powershelf (PSU and PMC)
Asynchronous component workflows: Firmware upgrade workflows for different component types (compute tray, switch, Mellanox, and NVOS) run asynchronously; powershelf firmware upgrades are not included in asynchronous execution yet. You can schedule, run, and monitor each component workflow independently, and multiple firmware runs may be in progress for different components at the same time. The subsections below describe each workflow; use run history and Firmware Reports to track status across concurrent upgrades.
The workflow invocation is performed via autonomous hardware recovery’s Runbooks. To view all Firmware upgrade related runbooks, you may search by the FIRMWARE_UPGRADE label as shown below.
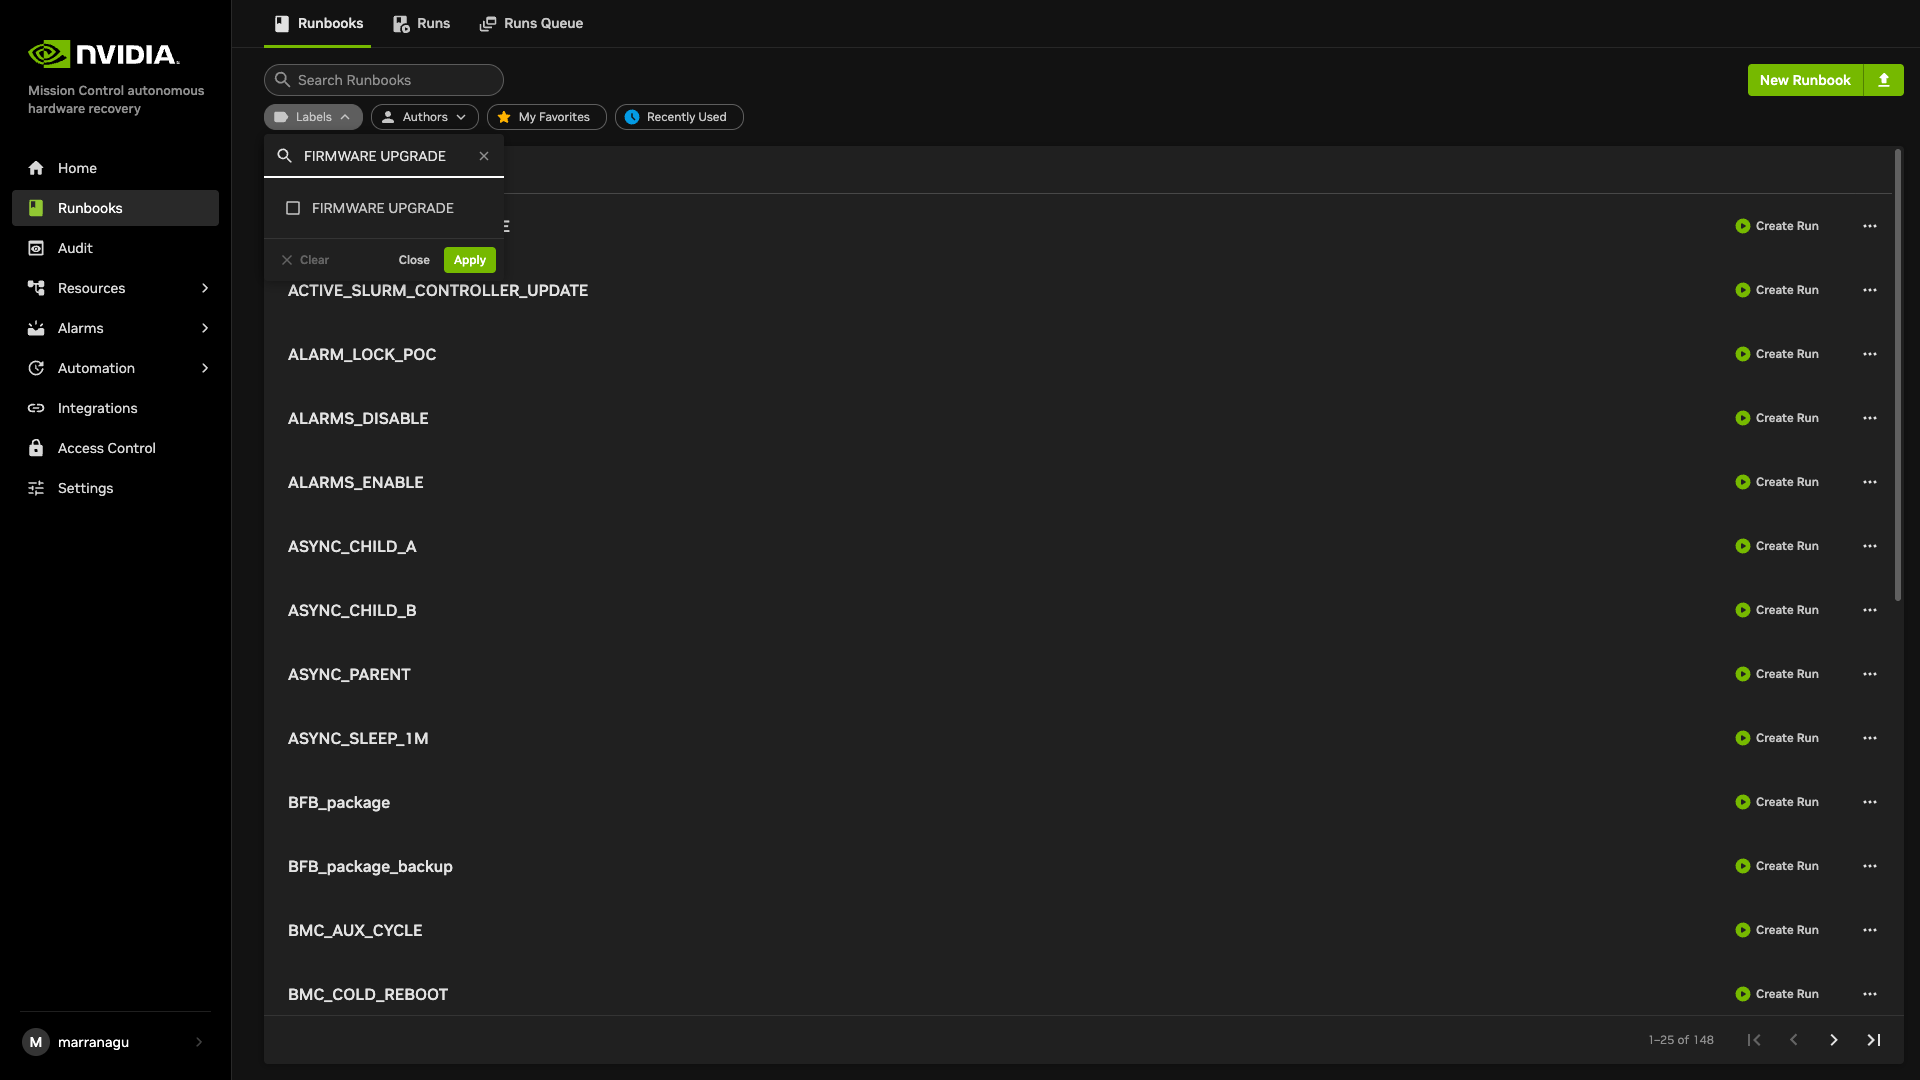
Using the filter will reduce the runbooks displayed to a list. In general, you will use these runbooks to upgrade the compute trays, switches, or switch NVOSes by following the steps in the next section.
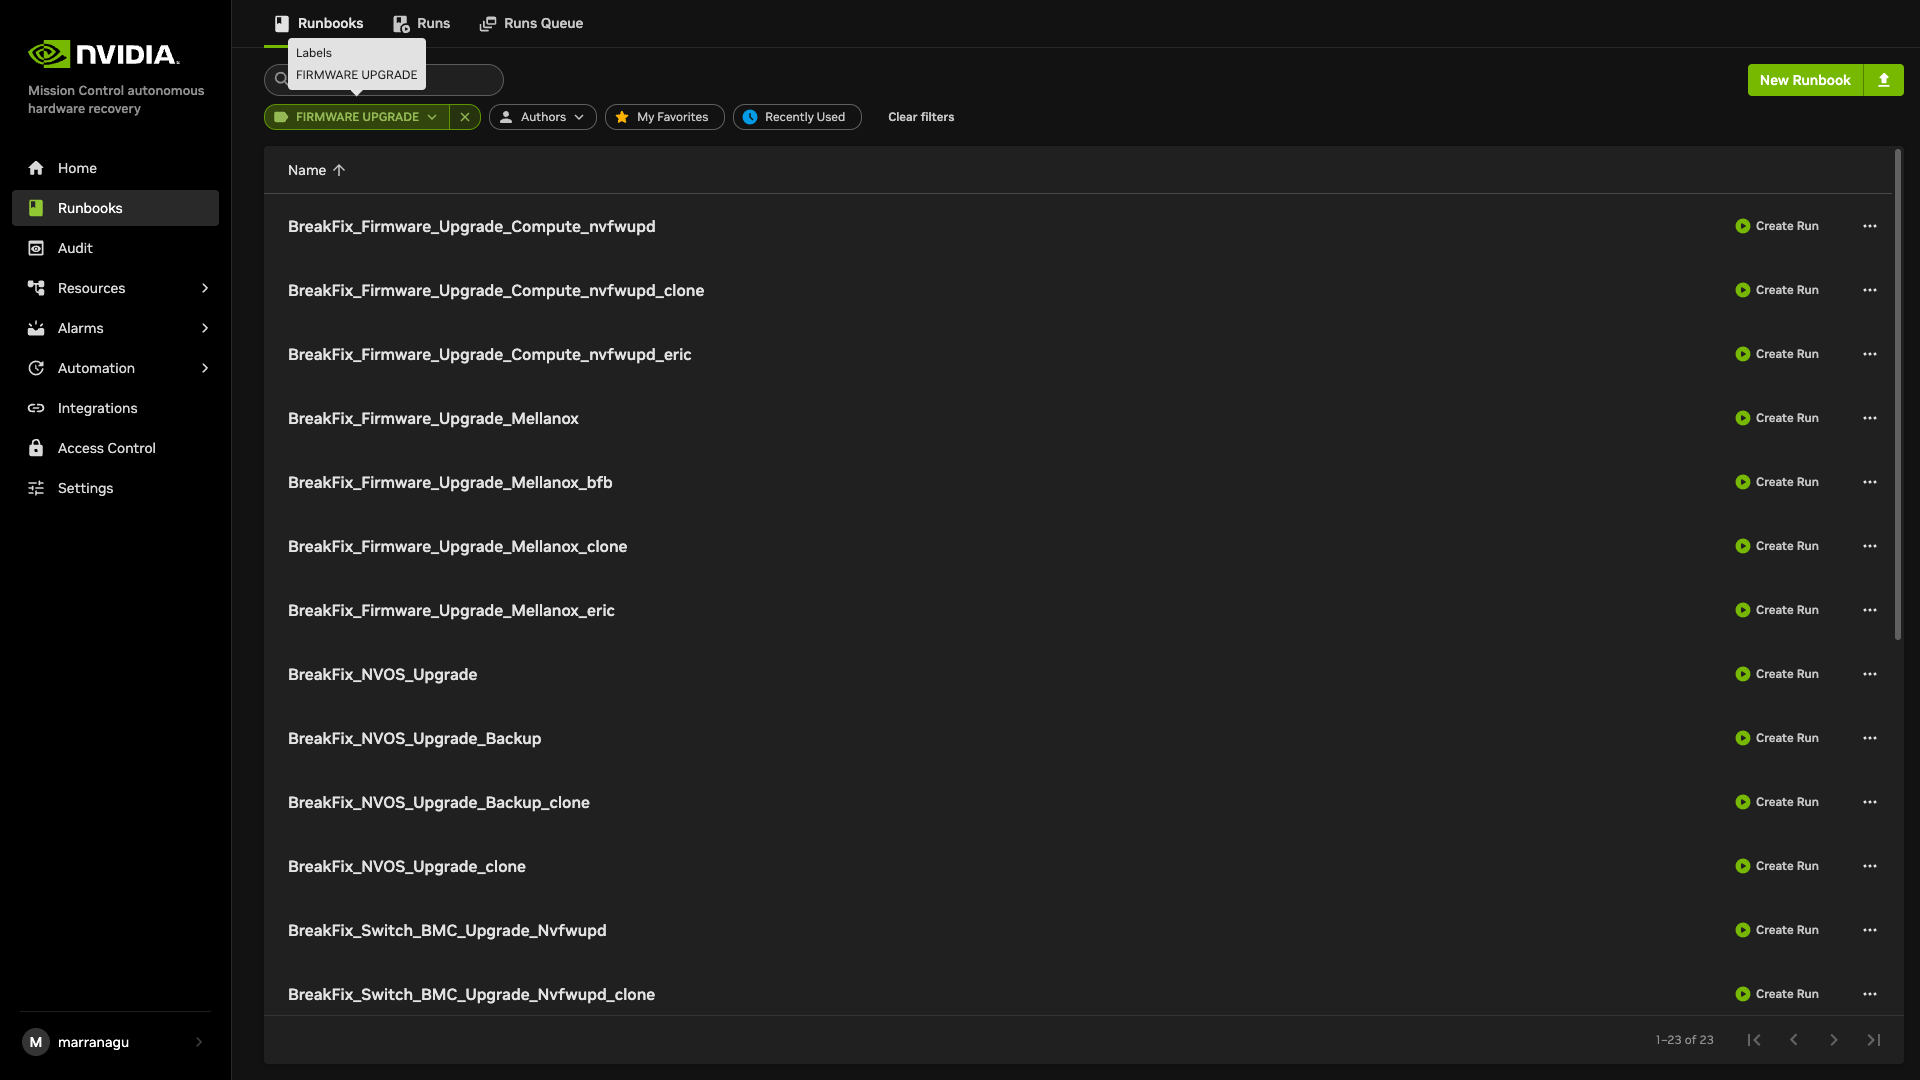
Preparing the Upgrade#
In the firmware upgrade runbook, nvfwupd and nv action are used with the upgrade package file to determine the versions needing upgrade. You will need to obtain the firmware package and the Source of Truth (SOT) JSON file, the latter of which defines the referenced settings used for validation.
The SOT JSON may be obtained from the NVIS team, whereas the firmware packages may be downloaded from the NVIDIA Application Hub.
Source of Truth Snippet (truncated)#
{
    "ProductName": "DGX-GB300-NVL72",
    "SOTUniqueID": "1",
    "SOTType": "Release",
    "Milestones": [
        {
            "TemplateVersion": "0.5",
            "Id": "f32d9ee4-2df4-4544-9f2a-e4e19d7cd894",
            "Name": "1.0.00GA",
            "State": "Onboarded",
            "ReleaseDate": "2025-09-04T16:49:58.186442",
            "ReleaseCustomers": [],
            "Tests": [],
            "Packages": [],
            "BoardSKUs": [
                {
                    "SKUID": "699-24764-0001-TS3,699-24764-0001-TS1,692-24764-0001-000",
                    "Name": "P4059",
                    "Components": {
                        "Software": [
                            {
                                "Component": "DOCA_Host",
                                "Version": "3.1.0-091513",
                                "External": true,
                                "Sideload": true,
                                "Informational": false,
                                "Type": "Prod",
                                "Locations": [
                                    {
                                        "Location": "https://linux.mellanox.com/public/repo/doca/3.1.0-091513/ubuntu24.04/arm64-sbsa/doca-ofed_3.1.0-091513_arm64.deb",
                                        "LocationType": "HTTP",
                                        "Distro": "Ubuntu",
                                        "Architecture": "All",
                                        "PackageName": "GB300NVL72_DOCA_MFT",
                                        "PackageSubdirectory": "",
                                        "External": false
                                    }
                                ],
                                "SubComponents": []
Ordering Constraints#
The runbooks used to perform upgrades automatically determine the ordering of applicable packages and will AUX cycle nodes when appropriate. The following paragraph describes this ordering, but is for informational purposes only, as there is no requirement for the user.
For the compute tray, older firmware packages require the BMC to be upgraded prior to HMC, but this is no longer the case with modern firmware. Both BMC and HMC can be upgraded within a single AC cycle.
For the switch tray, the BMC firmware should be updated first. SBIOS and CPLD packages may be upgraded within the same AC cycle. Our runbooks take care of this ordering for you.
Coordination with other jobs#
To prevent other tasks from utilizing the nodes undergoing the upgrade process, AHR will do two things:
It will tag the nodes with a special
maintenancetag.Subsequently, it will drain the node via Slurm on BCM.
In particular, this will prevent other upgrade processes from interfering, and will also bypass AHR’s breakfix workflow. This tag will be automatically removed upon successful completion of the upgrade, and the node will be undrained. If there’s an issue during the upgrade process, this tag and drain state will remain for further investigation. At this point of failure, the user should review the failures, and return the nodes to undrained and remove the maintenance tag once the nodes are deemed healthy.
If you need to remove the maintenance tags after the firmware upgrade process encounters an issue, troubleshooting has completed, or even after unsuccessful breakfix triage, you may do so using the CLEAR_MAINTENANCE_TAGS runbook, specifying resource_tag (e.g. rack_name) and resource_value (e.g. B05) as parameters.
Performing the Upgrade#
Entry-point runbook: FIRMWARE_UPGRADE
The FIRMWARE_UPGRADE runbook is the single entry point for upgrading both compute and switch firmware (and optionally Mellanox/NVOS when the corresponding paths are provided). It performs resource scoping, maintenance tagging, drain, and then invokes the appropriate child runbooks: FIRMWARE_UPGRADE_COMPUTE when compute packages are specified, and FIRMWARE_UPGRADE_SWITCH when switch packages are specified. After upgrades, it runs AUX cycle (if enabled), undrains nodes, removes the maintenance tag, and runs firmware validation. Use this runbook for combined compute-and-switch upgrades or for compute-only or switch-only upgrades by setting only the relevant package path(s).
This section details the steps and parameters for each component. The runbooks take care of invoking the process, performing the upgrade, calling any ancillary runbooks, and ultimately performing validation of the upgraded component once complete.
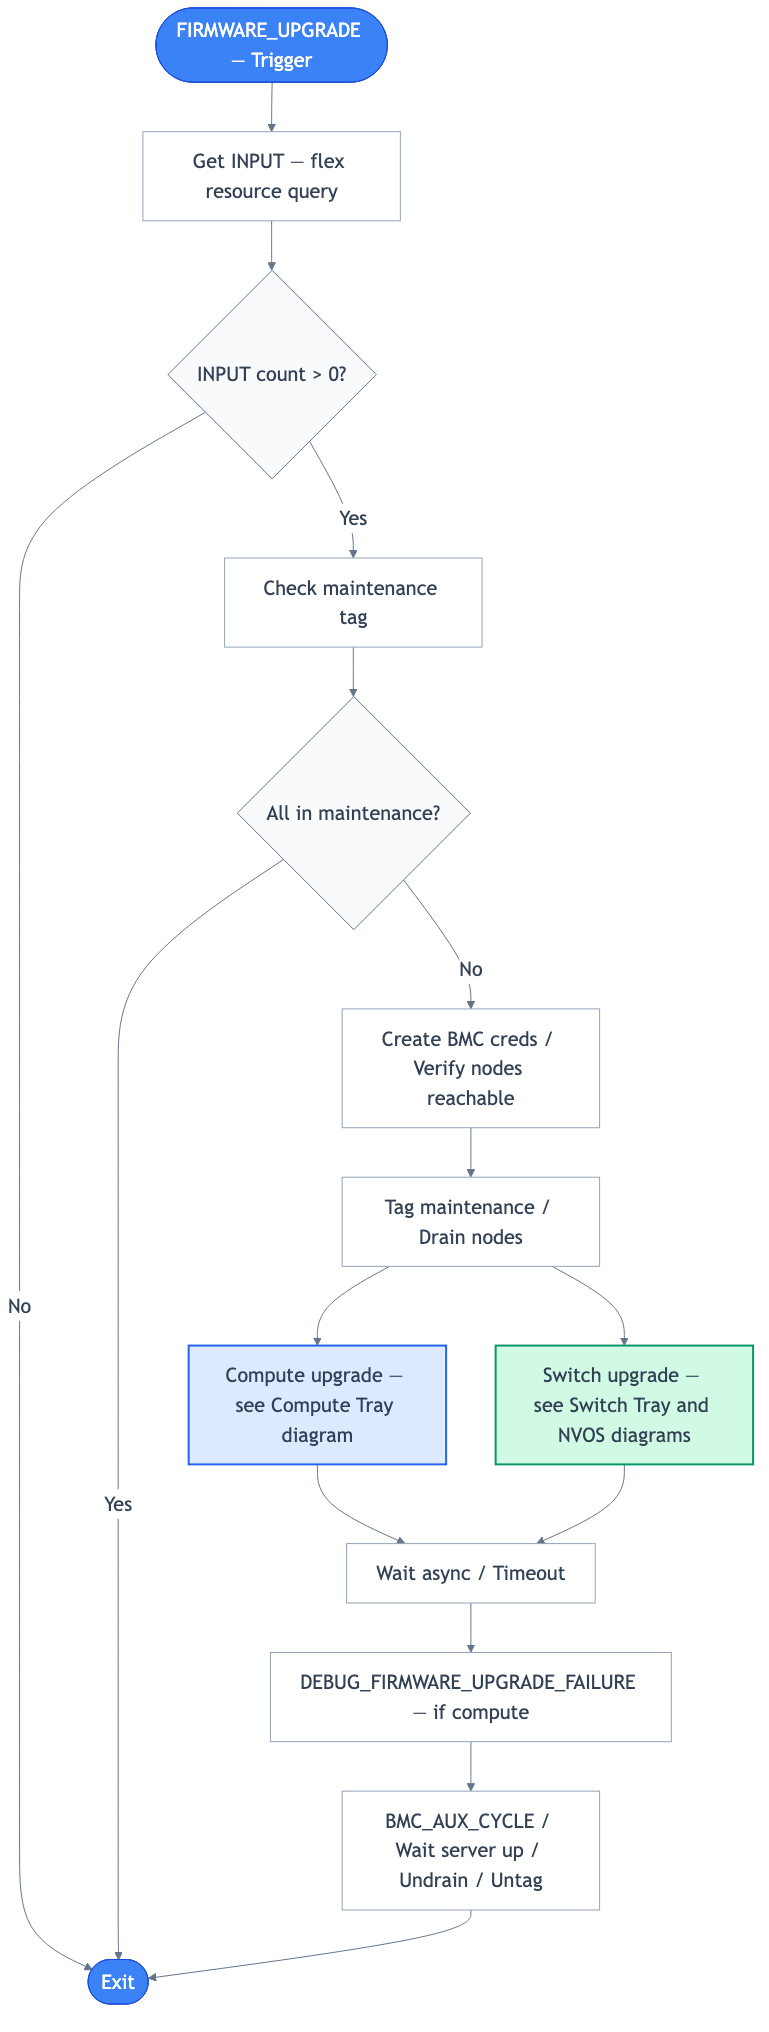
Figure: Firmware Upgrade (high-level). Detailed flows: Compute Tray (fw_image01), Switch Tray (fw_image02), Switch NVOS (fw_image03), Mellanox (mellanox_fw_upgrade_flowchart).
Compute Tray#
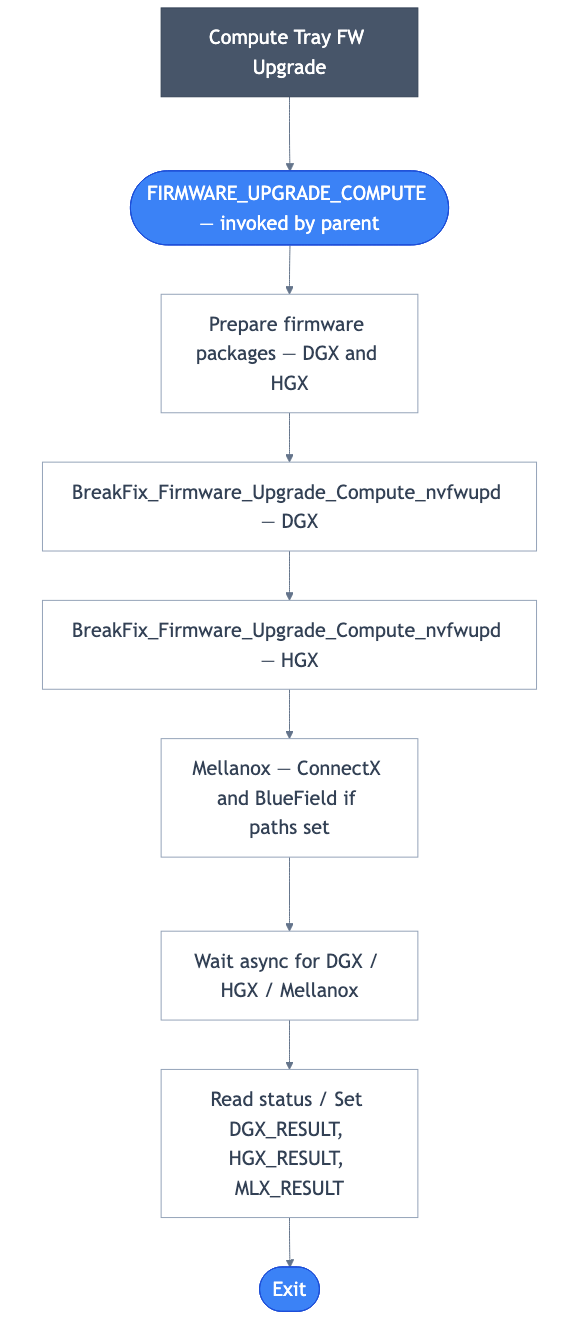
Prerequisites#
Download the firmware upgrade packages.
Obtain the SOT JSON file from the NVIS team.
On the headnode, place the JSON and packages in a subdirectory of
/cm/shared/apps/autonomous-hardware-recovery/var/firmware/, which is accessible to theshorelineuser.Upgrade packages use the following naming convention:
nvfw_DGX*
nvfw_HGX*
Upgrading#
From the Runbooks view, select “Create Run” for the FIRMWARE_UPGRADE runbook (entry point for compute and switch). To upgrade compute firmware, provide the following parameters. The parent runbook invokes FIRMWARE_UPGRADE_COMPUTE when FWPKG_DIR_PATH_COMPUTE is set.
Required parameters:
resource_tag – Tag for flex resource query (use
rack_namefor rack filtering).resource_value – Value for flex resource query (e.g., rack name or regex: A01, m06|m07).
FW_SOURCE_JSON_PATH – Path to the golden configuration JSON file included in the firmware package. This file defines the reference settings used for validation. If the file is not available, set this parameter to NA.
FWPKG_DIR_PATH_COMPUTE – Directory containing the compute firmware upgrade packages (nvfw_DGX*, nvfw_HGX*). Set to empty if you are only upgrading switch.
Optional parameters (commonly used):
FWPKG_DIR_PATH_SWITCH – Directory of the switch firmware packages. Set if you also want to upgrade switch in the same run; leave empty for compute-only.
NVOS_FILE_PATH – Full path to the NVOS bin file (if upgrading switch NVOS).
FWPKG_CX_FILE_PATH – Full path to the ConnectX firmware package. Set this (and FWPKG_BF_FILE_PATH) if you also need to upgrade Mellanox (ConnectX/BlueField) in the same run as compute.
FWPKG_BF_FILE_PATH – Full path to the BlueField firmware package. Set this (and FWPKG_CX_FILE_PATH) if you also need to upgrade Mellanox in the same run as compute.
FORCE_UPGRADE – When set to true, forces the firmware upgrade to proceed regardless of version checks; false follows standard upgrade rules.
IGNORE_LIST – List of nodes to exclude from scope (e.g., node01, or “none”).
AUX_CYCLE – When true (default), performs an AUX power cycle after upgrade; set to false to skip.
When you need to upgrade compute and Mellanox together, run FIRMWARE_UPGRADE with FWPKG_DIR_PATH_COMPUTE set and FWPKG_CX_FILE_PATH and FWPKG_BF_FILE_PATH set to the ConnectX and BlueField package paths. When you need to upgrade only compute firmware, run FIRMWARE_UPGRADE with FWPKG_DIR_PATH_COMPUTE set and FWPKG_DIR_PATH_SWITCH left empty. For advanced scenarios you may run the BreakFix_Firmware_Upgrade_Compute_nvfwupd runbook directly (e.g., single rack).
Switch Tray#
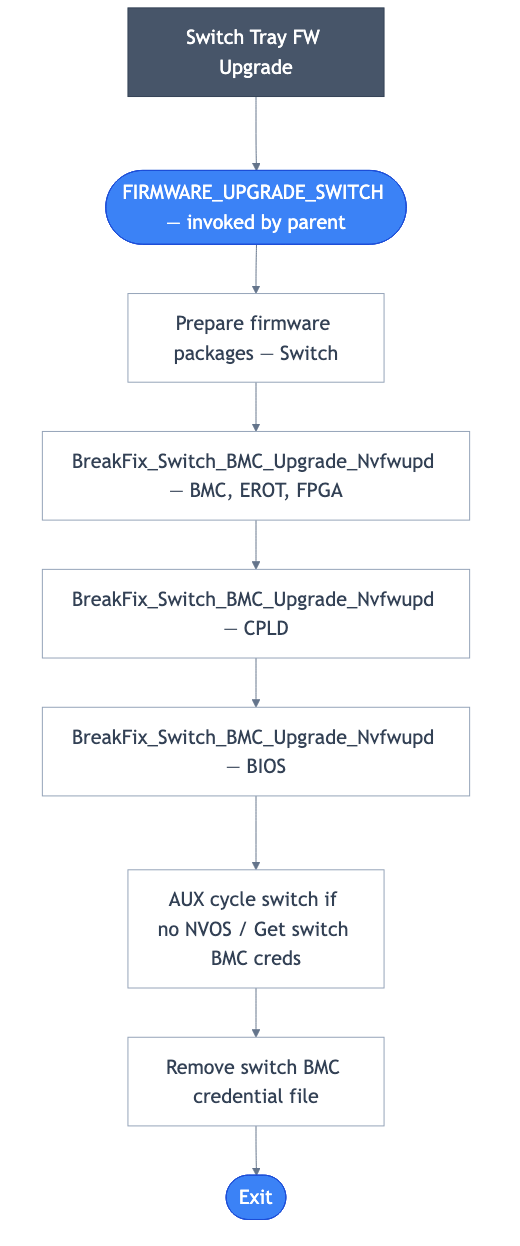
Prerequisites#
Download the firmware upgrade packages.
Obtain the golden configuration JSON file from the NVIS team.
On the headnode, place the JSON and packages in a subdirectory of
/cm/shared/apps/autonomous-hardware-recovery/var/firmware/, which is accessible to theshorelineuser.Upgrade packages use the following naming convention:
*nvfw*_0004_*
*nvfw*_0006_*
*nvfw*_0007_*
Upgrading#
When performing this upgrade, it should be noted that all of the rack’s 18 nodes will be drained from the Slurm pool, tagged with our maintenance tag, and subsequently AUX cycled.
To begin, from the Runbooks view, select “Create Run” for the FIRMWARE_UPGRADE runbook (entry point). To upgrade switch firmware, set FWPKG_DIR_PATH_SWITCH (and optionally NVOS_FILE_PATH for NVOS). The parent runbook invokes FIRMWARE_UPGRADE_SWITCH when FWPKG_DIR_PATH_SWITCH is set. Provide the same resource_tag, resource_value, and FW_SOURCE_JSON_PATH as for compute.
Required parameters (when upgrading switch):
resource_tag – Tag for flex resource query (use
rack_namefor rack filtering).resource_value – Value for flex resource query (e.g., A01).
FW_SOURCE_JSON_PATH – Path to the golden configuration JSON file provided within the firmware package. If the file is not available, set this parameter to NA.
FWPKG_DIR_PATH_SWITCH – Directory of the switch firmware upgrade packages. Set to empty if you are only upgrading compute.
Optional: NVOS_FILE_PATH – Full path to the NVOS bin file if upgrading switch NVOS. FORCE_UPGRADE, AUX_CYCLE – same as for compute.
When you need to upgrade only switch firmware, run FIRMWARE_UPGRADE with FWPKG_DIR_PATH_SWITCH set and FWPKG_DIR_PATH_COMPUTE left empty. The FIRMWARE_UPGRADE_SWITCH child runbook is invoked by the parent and is not intended to be run directly. For advanced scenarios you may run the BreakFix_Switch_BMC_Upgrade_Nvfwupd runbook directly.
Switch NVOS#
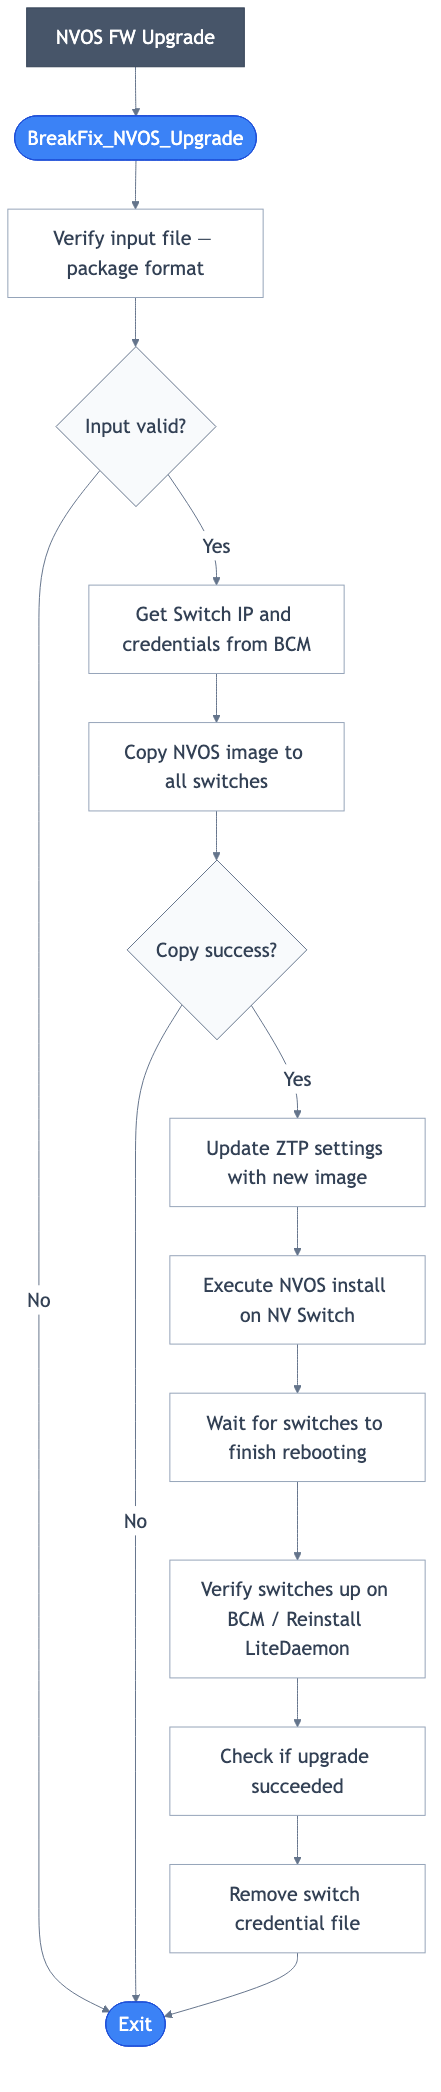
Prerequisites#
Download the NVOS upgrade package bin file.
Obtain the golden configuration JSON file from the NVIS team.
On the headnode, place the JSON and packages in a subdirectory of
/cm/shared/apps/autonomous-hardware-recovery/var/firmware/, which is accessible to theshorelineuser.
Upgrading#
Use the FIRMWARE_UPGRADE runbook (entry point), same as for Switch Tray and Compute. To upgrade switch NVOS, set NVOS_FILE_PATH and optionally FWPKG_DIR_PATH_SWITCH (if also upgrading switch tray firmware). The parent runbook invokes FIRMWARE_UPGRADE_SWITCH, which performs both switch tray firmware and NVOS upgrade when NVOS_FILE_PATH is provided.
Required parameters:
resource_tag – Tag for flex resource query (use
rack_namefor rack filtering).resource_value – Value for flex resource query (e.g., A01).
FW_SOURCE_JSON_PATH – Path to the golden configuration JSON file provided within the firmware package. If the file is not available, set this parameter to NA.
NVOS_FILE_PATH – Full path to the NVOS bin file including the file itself.
Optional: FWPKG_DIR_PATH_SWITCH – Set if you are also upgrading switch tray firmware in the same run; leave empty if only upgrading NVOS.
Alternatively, run BreakFix_NVOS_Upgrade directly with resource_value, NVOS_FILE_PATH, FW_SOURCE_JSON_PATH, and INPUT_SWITCH (from flex query or parent context).
Mellanox#
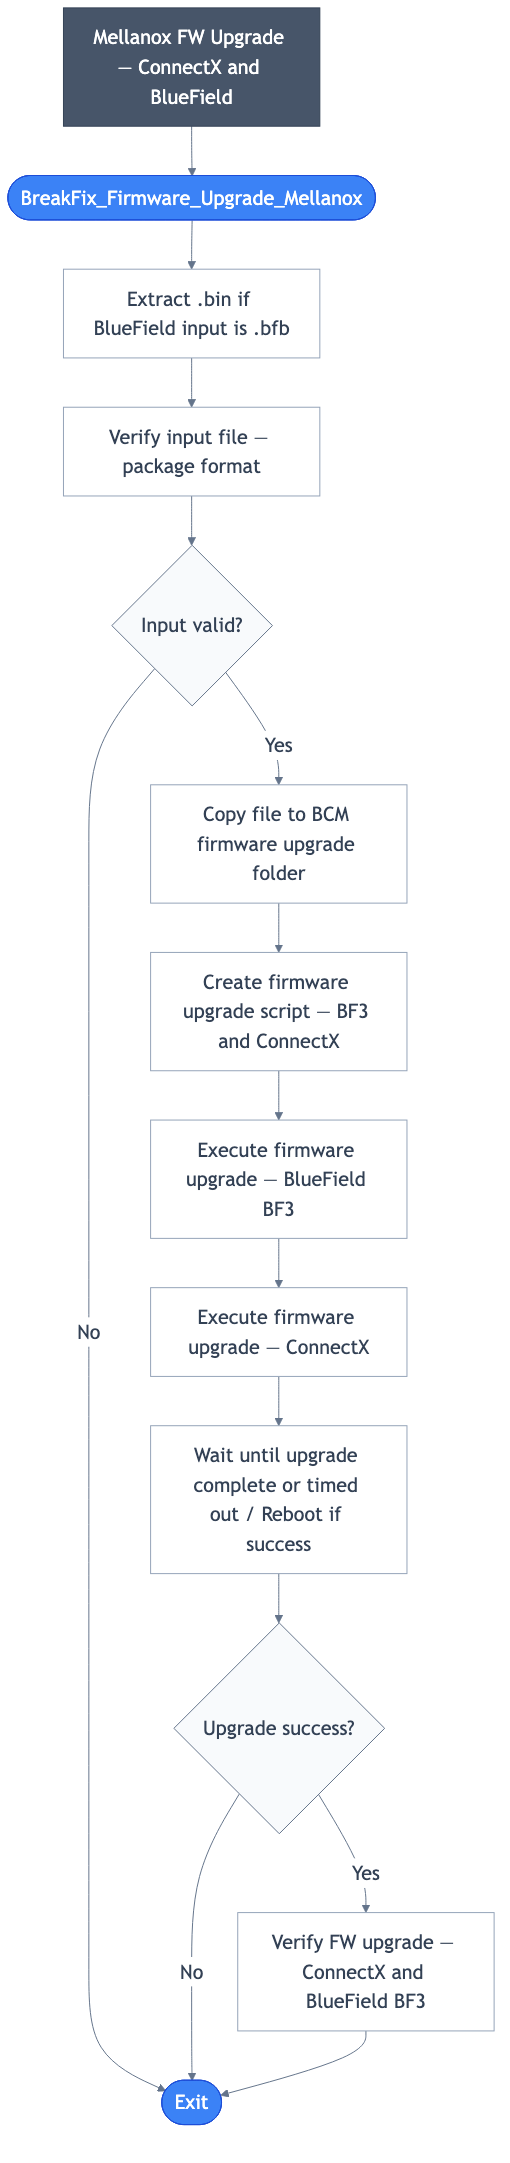
Figure: Mellanox FW Upgrade (ConnectX and BlueField) — from BreakFix_Firmware_Upgrade_Mellanox runbook.
Prerequisites#
Download the BlueField and ConnectX upgrade packages.
Obtain the golden configuration JSON file from the NVIS team.
On the headnode, place the JSON and packages in a subdirectory of
/cm/shared/apps/autonomous-hardware-recovery/var/firmware/, which is accessible to theshorelineuser.
Upgrading#
Use the FIRMWARE_UPGRADE runbook (entry point), same as for Compute and Switch. To upgrade Mellanox (ConnectX and BlueField) firmware, set FWPKG_CX_FILE_PATH and FWPKG_BF_FILE_PATH; you can set FWPKG_DIR_PATH_COMPUTE to a directory (or leave empty if only Mellanox). The parent runbook invokes FIRMWARE_UPGRADE_COMPUTE, which performs ConnectX and BlueField firmware upgrade when these paths are provided.
Required parameters:
resource_tag – Tag for flex resource query (use
rack_namefor rack filtering).resource_value – Value for flex resource query (e.g., A01, or regex).
FW_SOURCE_JSON_PATH – Path to the golden configuration JSON file provided within the firmware package. If the file is not available, set this parameter to NA.
FWPKG_CX_FILE_PATH – Full path to the ConnectX firmware package file.
FWPKG_BF_FILE_PATH – Full path to the BlueField firmware package file (either .bin or .bfb package).
Optional: FWPKG_DIR_PATH_COMPUTE – Directory of compute firmware packages if you are also upgrading compute tray in the same run; leave empty for Mellanox-only.
Alternatively, run BreakFix_Firmware_Upgrade_Mellanox directly with FWPKG_CX_FILE_PATH, FWPKG_BF_FILE_PATH, FW_SOURCE_JSON_PATH, and INPUT_COMPUTE (from flex query or parent context).
Powershelf#
GB300 supports firmware upgrades for power shelves (LiteOn and Delta). Use the FIRMWARE_UPGRADE_POWERSHELF runbook. It upgrades PMC (Power Management Controller) first, then PSU, and finally runs SINGLENODE_HEALTHCHECK_FIRMWARE_POWERSHELF for validation.
Prerequisites#
Obtain the PSU and PMC firmware packages and the golden configuration JSON file (from the NVIS team or firmware package).
On the headnode, place the JSON and packages in a subdirectory of
/cm/shared/apps/autonomous-hardware-recovery/var/firmware/, which is accessible to theshorelineuser.
Upgrading#
From the Runbooks view, select “Create Run” for the FIRMWARE_UPGRADE_POWERSHELF runbook. Required parameters (per runbook):
resource_tag – Tag for flex resource query (use rack_name for rack filtering).
resource_value – Value for flex resource query (e.g., A01, or regex).
IGNORE_LIST – List of nodes to ignore for baseline tests. Accepted formats: single node (e.g. node01), list (e.g. [“node01”, “node02”]), pipe-delimited (e.g. node01|node02), or “none” if no nodes should be ignored.
PSU_FILE_FULL_PATH – Full path to the directory and file name of the PSU firmware package.
PMC_FILE_FULL_PATH – Full path to the directory and file name of the PMC firmware package.
FW_SOURCE_JSON_PATH – Path to the golden configuration JSON file provided within the firmware package. This file defines the reference settings used for validation.
FORCE_UPGRADE – When set to true, forces the firmware upgrade to proceed regardless of version checks or validation; false follows standard upgrade rules.
The runbook invokes POWERSHELF_COMPONENT_UPGRADE for PMC first, then PSU, and finally SINGLENODE_HEALTHCHECK_FIRMWARE_POWERSHELF to verify the upgrade.
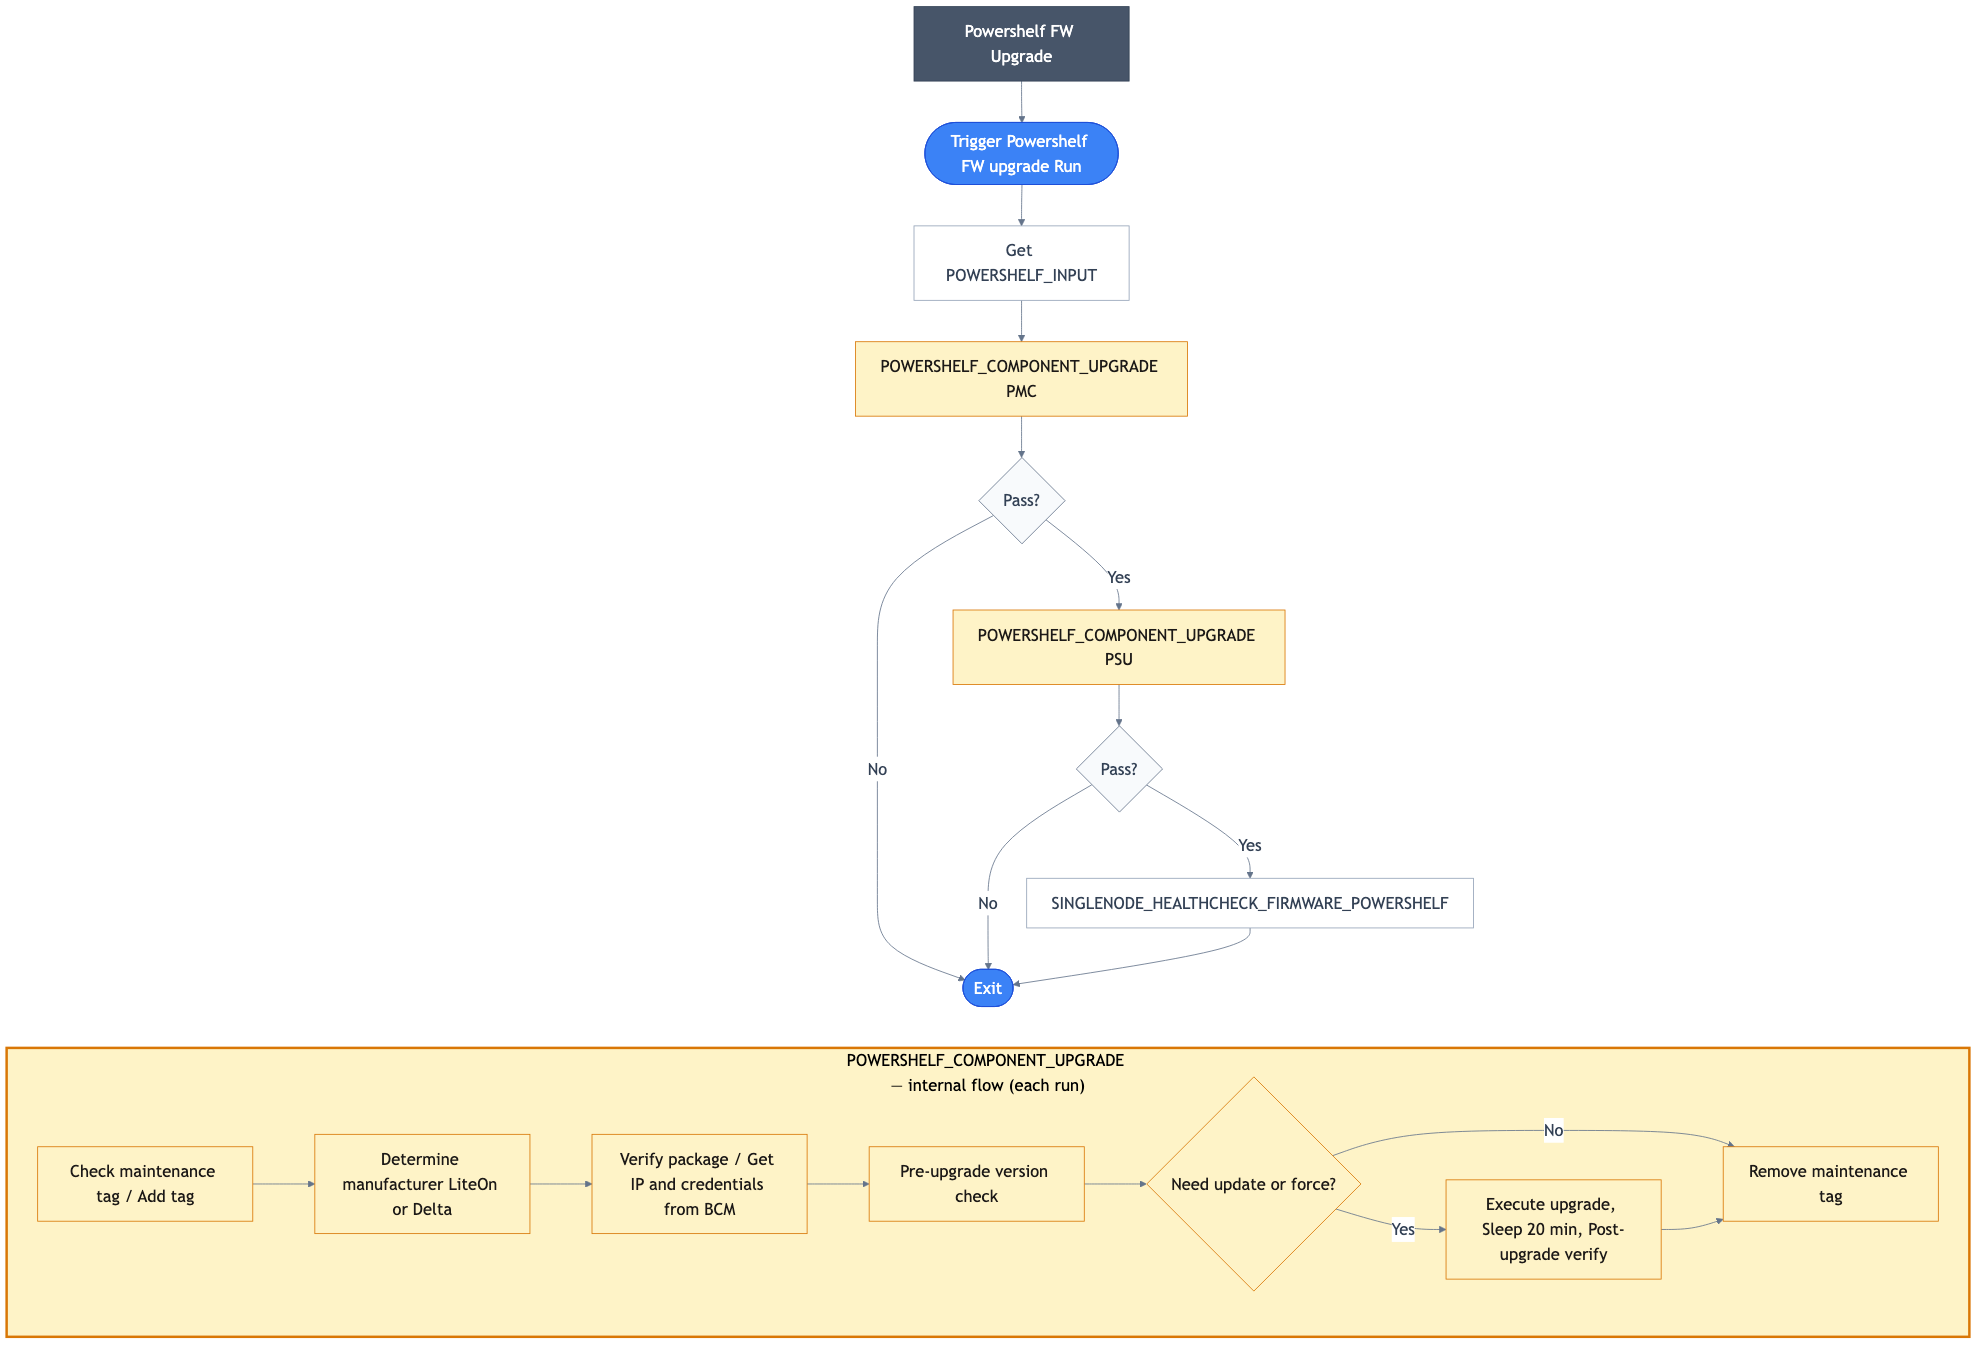
Figure: Powershelf Firmware Upgrade Workflow – This diagram illustrates the end-to-end Powershelf firmware upgrade process. FIRMWARE_UPGRADE_POWERSHELF obtains the target powershelves via flex query, then invokes POWERSHELF_COMPONENT_UPGRADE for PMC (Power Management Controller) first and PSU next, each with optional exit on failure. The workflow concludes with SINGLENODE_HEALTHCHECK_FIRMWARE_POWERSHELF to validate the upgrade against the golden configuration JSON.
BF Firmware Bundle Extraction Guide#
This guide explains how to extract a BF firmware package provided as a BF Bundle (.bfb).
Important:
These steps must be performed on the compute node, as it already has thebfb-toolutility installed.
Prerequisites#
Ensure the following dependency is installed:
sudo apt install -y qemu-user-static
Extracting the BF Bundle
Note: The --bfb argument must use the complete (absolute) path to the .bfb file.
Relative paths may cause the extraction to fail.
bfb-tool extract \
  --bfb /path/to/bf-fwbundle-<version>-prod.bfb \
  --opn 900-9D3B6-00CN-P_Ax
Using the Extracted Firmware
After extraction, go to the folder created in /tmp (named after the .bfb file). Inside this folder, open the subfolder corresponding to your OPN (e.g., 900-9D3B6-00CN-P_Ax). In that subfolder, locate the .bin firmware file, which should be used as the input to the runbook.
Troubleshooting#
1. Excluding a node from upgrade or runbook cells#
To exclude a particular node, you can add a cell near the start of your runbook (after INPUT_SWITCH is exported) with something like the following:
INPUT_SWITCH | name != "<node_name>" | export(“INPUT_SWITCH")
This will export all the resources except <node_name> back into the INPUT_SWITCH variable.
Firmware upgrade includes a series of steps to ensure the nodes are removed from jobs being scheduled, complete the upgrade, and place the nodes back in service. Below are some common issues you may encounter during the firmware upgrade:
2. Nodes not reachable from headnode#
To upgrade firmware, the BMC IP must be accessible from the headnode. The runbook verifies node accessibility and automatically skips unreachable nodes.
Action: Ensure the node is online and accessible from the headnode, then rerun the firmware upgrade runbook.
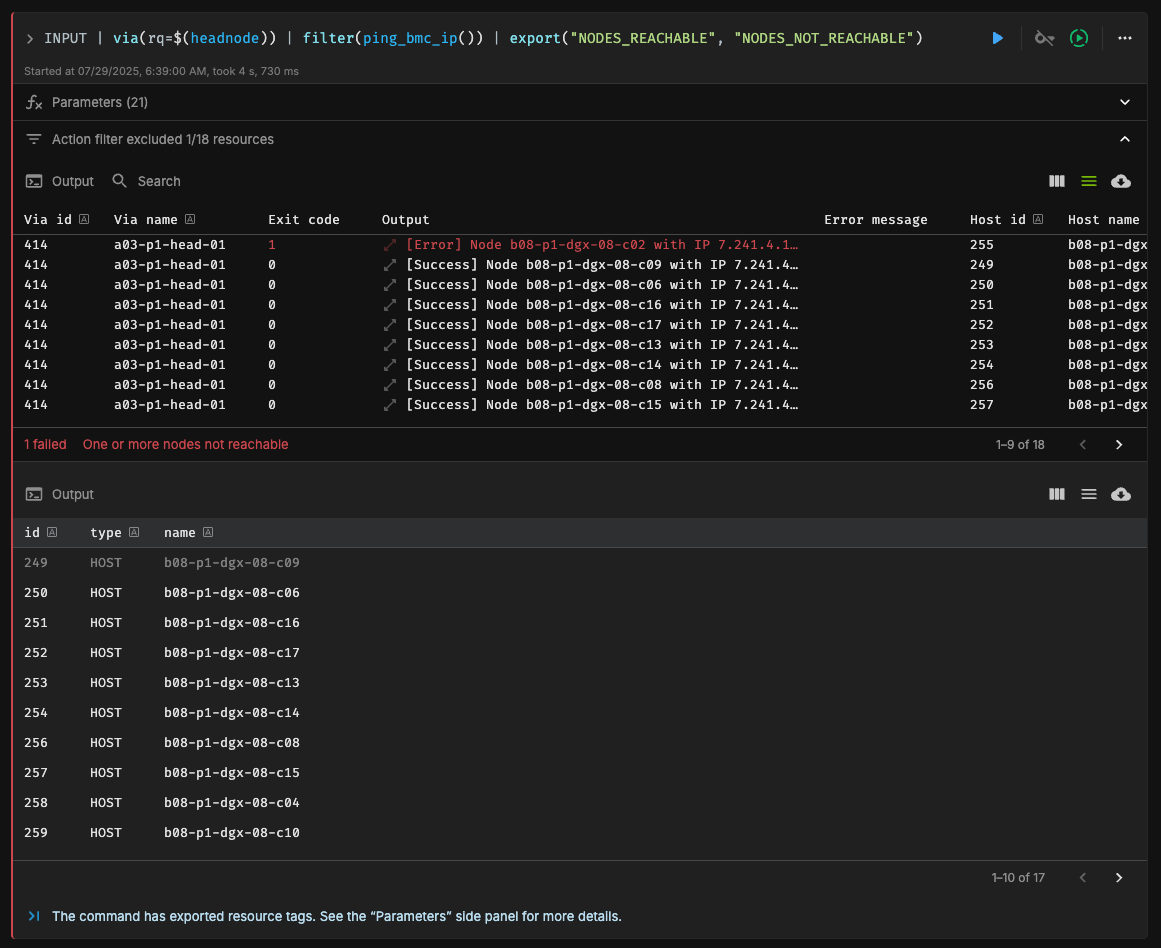
3. Failed firmware upgrade#
The firmware upgrade failed to complete successfully. Possible causes include failures in the nvfwupd command, NV OS, or the flint command, depending on the package.
Action: Verify logs by clicking on the Output, which includes the command’s stdout and stderr.
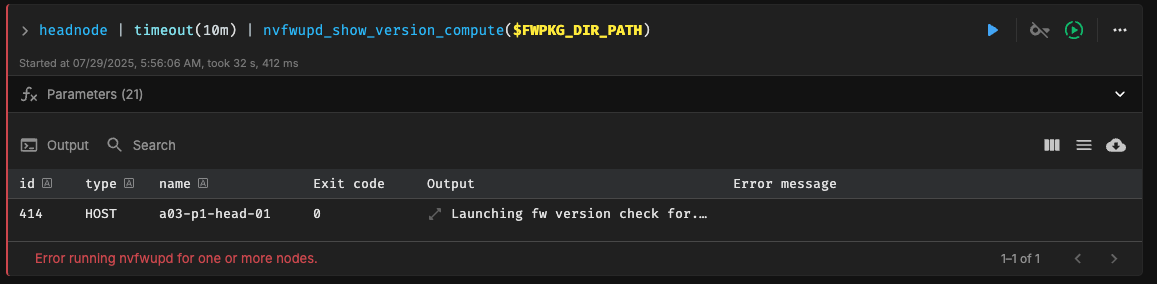
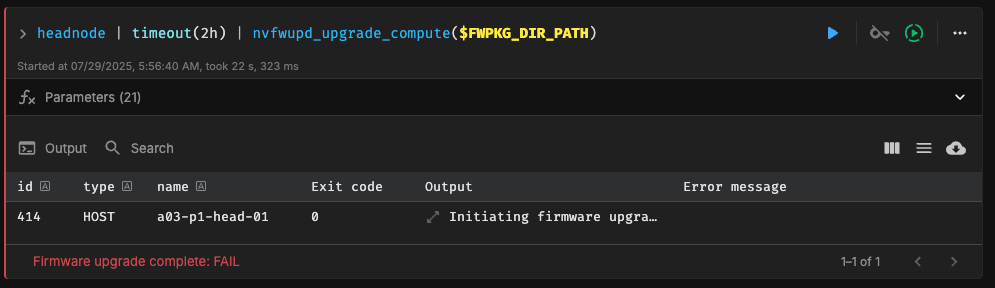
Note that the runbook does not automatically undrain or untag maintenance when the firmware upgrade fails. After verifying that the failures are safe to ignore and the nodes are ready to return to the pool, undrain, and untag the nodes using the UNDRAIN_AND_UNTAG_RACKS runbook. Provide resource_tag (e.g. rack_name) and resource_value (e.g. B05 or m06|m07) when prompted.
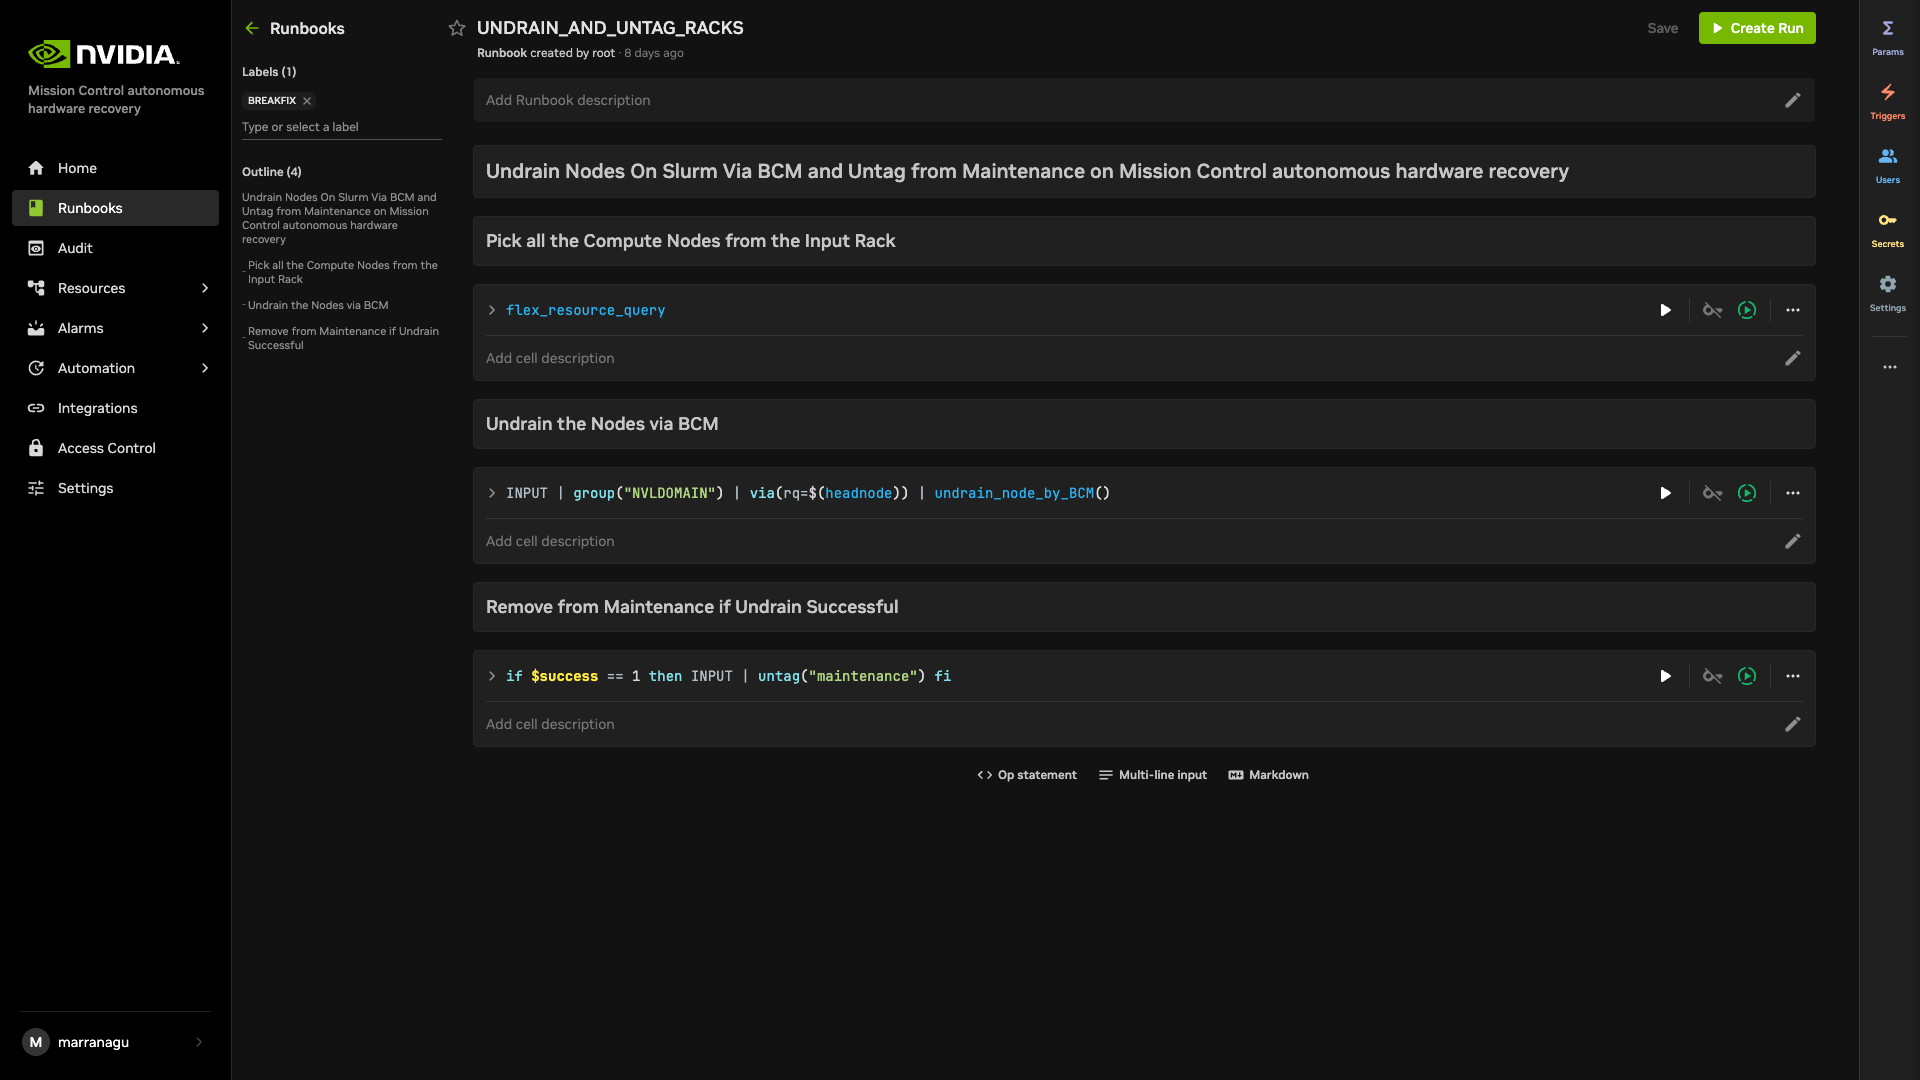
4. SSH failures for Switch Upgrade runbooks.#
The switch firmware upgrade runs commands via SSH. The runbook dynamically retrieves the user and password from BCM using cmsh commands, which are then used to run the SSH commands.
Action: Verify SSH access to the switch from the headnode using the credentials stored in BCM.
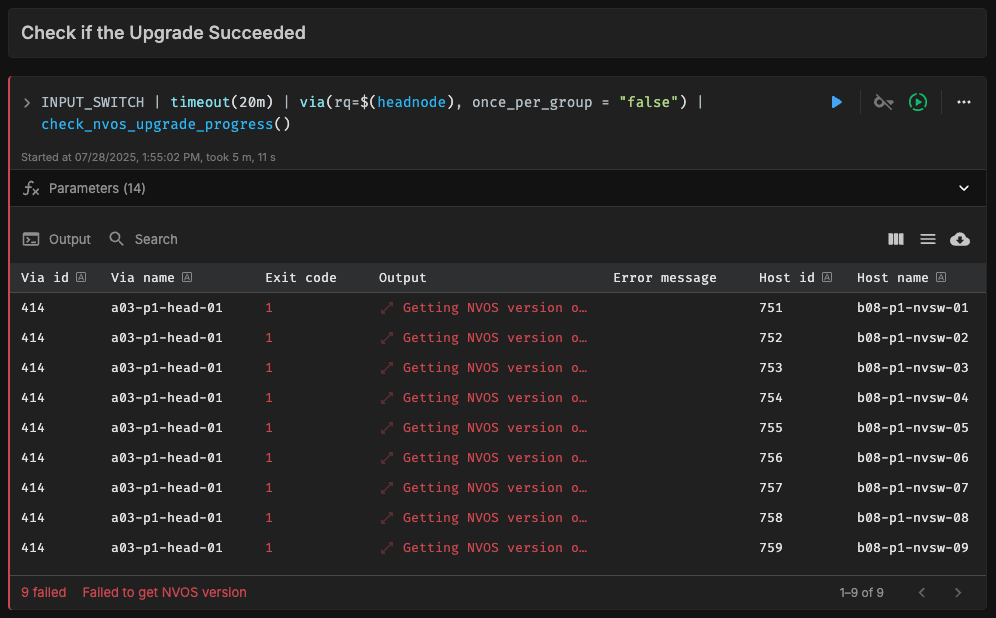
5. Failed validation stage#
The last step in every firmware upgrade is validation. The runbook selects a subset of tests to verify upgrade success. Failures may result from upgrade issues, incorrect SOT JSON, or command failures when fetching component versions.
Action: Compare the expected and actual versions in the logs and check for any other errors.
Notes#
Netcat is used to check if nodes are back online after a reboot.
The runbook cannot exclude a subset of nodes. This means if any nodes are down, the runbook will ignore the node and upgrade others.
Multiple racks cannot be upgraded simultaneously.
If
nvfwupddoes not upgrade, (due to already being at the specific version, for example) and FORCE_UPGRADE is not specified as true, the runbook will exit after untagging frommaintenance.
Links#
Please see Firmware Reports for more information on Firmware related reports.
NVIDIA Mission Control autonomous hardware recovery Break/Fix Workflow#
Break/Fix Introduction#
NVIDIA Mission Control autonomous hardware recovery provides automated break/fix workflows to handle tray failures for GB300. These workflows execute a series of diagnostic steps to determine the cause of the failure and take necessary repair steps and create Support tickets for the issues that cannot be auto resolved.
The automated break/fix workflow is designed to efficiently diagnose and remediate issues, with clear paths for different failure scenarios and comprehensive validation to ensure systems are properly restored to service.

Figure: Compute Break/Fix Workflow (high-level) — Trigger, Triage, Validation, then Return to service or Run diag / Support ticket.
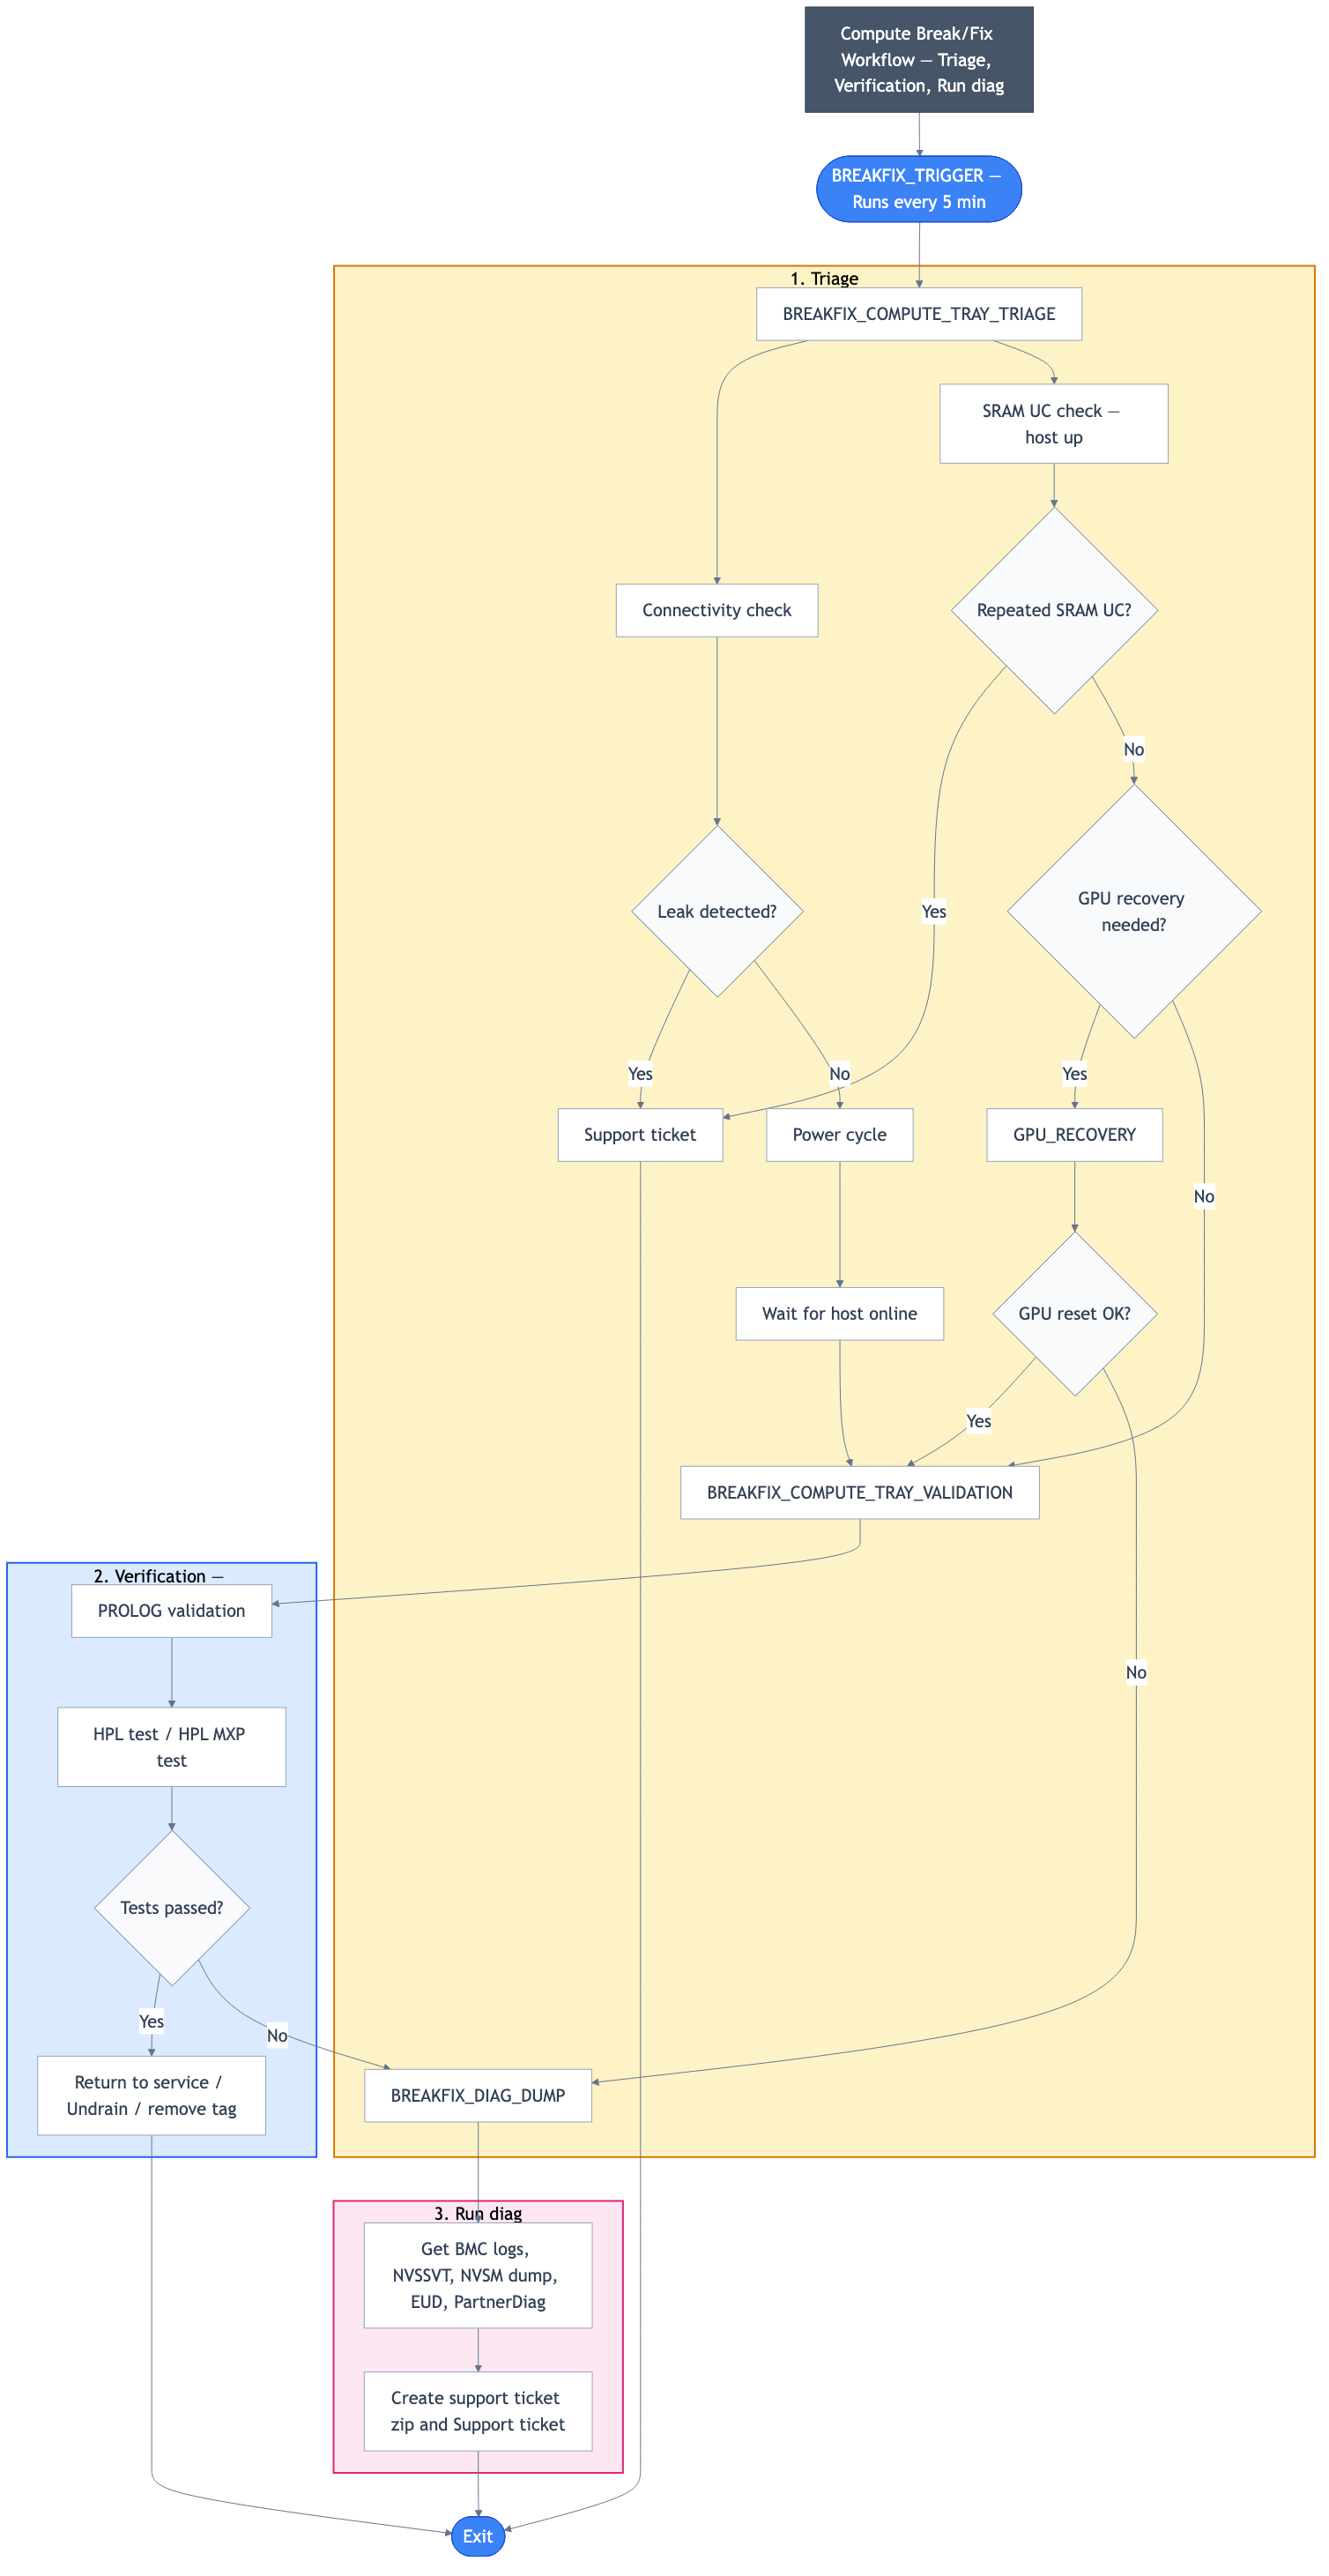
Figure: Compute Break/Fix Workflow (detailed) — Explains each phase: 1. Triage (connectivity check, SRAM UC check, leak detection, power cycle, GPU recovery), 2. Verification (BREAKFIX_COMPUTE_TRAY_VALIDATION, tests passed?), 3. Run diag (BREAKFIX_DIAG_DUMP, support ticket creation). All paths from triage converge on validation; failed validation leads to diagnostic dump and support ticket; success leads to return to service.
Key Features#
Automatic Detection: Identifies drained nodes without manual intervention
Intelligent Triage: Routes to appropriate diagnostic workflows based on failure symptoms
Comprehensive Diagnostics: Performs thorough hardware and software checks
Automated Remediation: Attempts to resolve issues without human intervention when possible
Detailed Reporting: Provides comprehensive logs for RMA or further troubleshooting
Entrypoint of Break/Fix Workflow#
A centralized automated break/fix interface has been established to facilitate streamlined diagnostics and remediation. This unified entry point provides comprehensive access to the break/fix framework, enabling efficient navigation and implementation of all remediation procedures.
To access the break/fix interface:
Access the NVIDIA Mission Control autonomous hardware recovery portal using your credentials and navigate to the Runbooks section.
Locate the “BREAKFIX_TRIGGER” runbook through the search functionality
Upon selecting the “BREAKFIX_TRIGGER” runbook, you will be presented with the interface showing the workflow for automated break/fix.
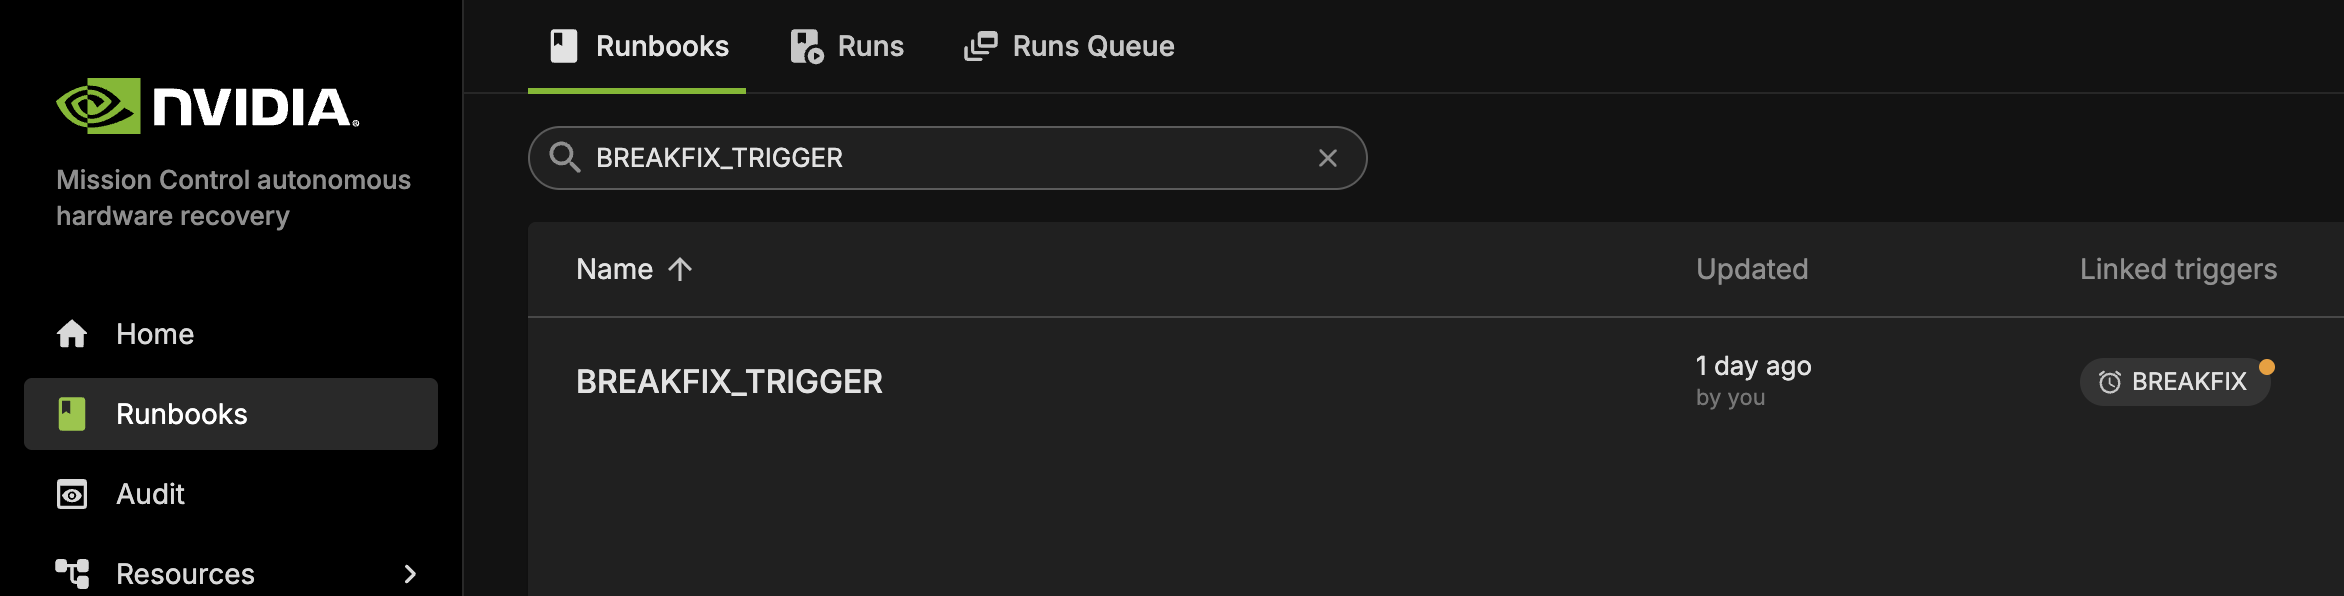
Run Break/Fix Workflow#
The BREAKFIX_TRIGGER is a time-triggered runbook that automatically runs every 5 minutes. When executed, it:
Gets drained nodes from BCM and proceeds only if the drain reason is one of the allowed reasons. Otherwise the runbook exits with no action.
Allowed drain reasons (runbook exits if no nodes have these reasons): Excluded by ARE, Prolog/Epilog error, Kill task failed, Duplicate jobid, Low RealMemory, Drained by CMDaemon, Test breakfix flow, or Not responding.
Processes one node per execution cycle from the drained node pool; applies a maintenance tag in AHR to prevent duplicate processing, and ensures drained nodes are handled sequentially across multiple runs.
Verifies the AHR agent is connected and accepts commands before proceeding; exits if the agent does not accept commands.
Gets the drain reason from BCM, updates it with “(AHR in-progress)”, and re-drains the node via BCM with the updated reason.
Invokes BREAKFIX_COMPUTE_TRAY_TRIAGE(INPUT, DRAIN_REASON) asynchronously to perform triage on the selected compute node.
No manual intervention is required to start the process.
The BREAKFIX_TRIGGER runbook is shared across GB300, GB200, and B200. It has no user-configurable scope parameters; it discovers drained nodes from BCM automatically.
One can see the time trigger settings on the right side of the Runbook under Triggers, where it shows that it is currently enabled and runs every 5 minutes.

You can also manually trigger the workflow:
Navigate to the “BREAKFIX_TRIGGER” runbook in the Runbooks section
Select the “Create Run” button positioned in the top right corner of the interface
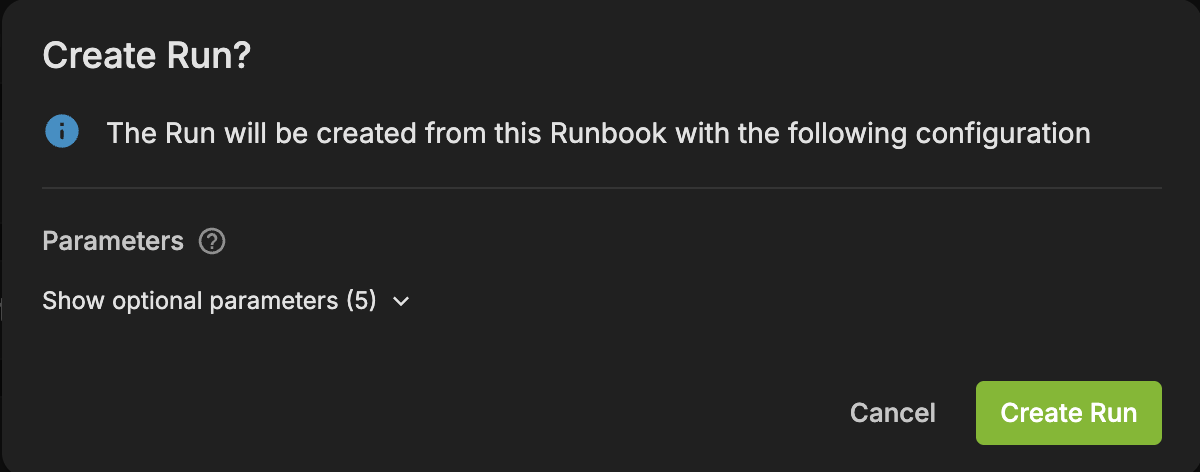
After initiating the process, a confirmation dialog will appear with a “View Run” link
Selecting this link will redirect you to a page displaying comprehensive job status and details
The automated nature of this workflow ensures that system issues are addressed promptly without requiring constant monitoring or manual intervention.
Break/Fix Workflow Components#
The break/fix system consists of several key components that work together to diagnose and remediate issues with compute nodes. The following is a detailed explanation of each component:
BREAKFIX_TRIGGER#
The entry-point runbook (shared for GB300, GB200, and B200 compute break/fix) that:
Runs automatically every 5 minutes via time trigger.
Gets drained nodes from BCM and only proceeds if the drain reason is one of the allowed reasons: Excluded by ARE, Prolog/Epilog error, Kill task failed, Duplicate jobid, Low RealMemory, Drained by CMDaemon, Test breakfix flow, or Not responding.
Processes one node per run: selects a drained node not already in maintenance, verifies AHR agent accepts commands, sets the maintenance tag, gets and updates the drain reason with “(AHR in-progress)”, re-drains via BCM, then invokes BREAKFIX_COMPUTE_TRAY_TRIAGE(INPUT, DRAIN_REASON) asynchronously.
Has no user-facing parameters; node discovery and scope are driven by BCM drained state.
BREAKFIX_COMPUTE_TRAY_TRIAGE#
This runbook is automatically triggered by BREAKFIX_TRIGGER and performs comprehensive triage on drained compute trays.
This runbook performs comprehensive triage on drained compute trays with two main workflows:
Workflow for Unresponsive Compute Nodes#
Initial Assessment
Tests connectivity using ping to check if compute nodes are responsive or unresponsive
Identifies nodes that are already unresponsive and require recovery
Leak Detection
Checks if any leaking is reported through BCM
Creates Support ticket immediately for any nodes with detected leaking (if opted in to support ticket service)
Recovery Process for Non-Leaking Nodes
Initiates power cycle for nodes without leaking issues
Waits and checks if hosts come back online
Waits until the AHR agent is connected to confirm successful recovery
Failure Handling
Creates Support ticket for hosts that fail to start up (if opted in to support ticket service)
Validation
For recovered nodes, automatically runs BREAKFIX_COMPUTE_TRAY_VALIDATION to verify functionality
Workflow for Responsive Compute Nodes#
GPU Recovery Assessment
Checks if any GPU recovery action is present
Routes to GPU_RECOVERY runbook if GPU issues are detected
Automatically runs BREAKFIX_COMPUTE_TRAY_VALIDATION for nodes without specific issues
GPU_RECOVERY#
This specialized diagnostic runbook is automatically invoked by BREAKFIX_COMPUTE_TRAY_TRIAGE when GPU-related issues are detected.
This specialized diagnostic runbook focuses on GPU-related issues:
Verification and Assessment
Verifies the node is still drained from BCM
Categorizes recovery actions (Reboot, Reset, or None)
Recovery Actions Based on Type
For Reboot Action:
Reboots the node requiring GPU reboot
Waits for host to come back online
Automatically runs BREAKFIX_COMPUTE_TRAY_VALIDATION if host is up
Creates Support ticket for host that fail to start up (if opted in to support ticket service)
For Reset Action:
Resets the GPU
Automatically runs BREAKFIX_COMPUTE_TRAY_VALIDATION to verify on successful GPU reset
If reset fails, automatically runs BREAKFIX_DIAG_DUMP and creates a Support Ticket (if opted in to support ticket service)
For No Action Required:
Automatically runs BREAKFIX_COMPUTE_TRAY_VALIDATION directly
BREAKFIX_COMPUTE_TRAY_VALIDATION#
This runbook is automatically executed after remediation actions to validate system health as part of the automated workflow following triage and recovery operations.
After remediation actions, this runbook validates the system health:
Comprehensive Testing
Runs testing suites to validate the compute tray
Executes HPL test (HPL use mpirun for single-node execution instead of Slurm for break/fix scenarios)
Runs AHR prolog script to prevent undraining of nodes that are still failing prolog checks, since undraining will result in them being drained again at the next Slurm invocation
Result Handling
For failed tests, automatically runs BREAKFIX_DIAG_DUMP for detailed diagnostics
For passed tests, undrains/untags the host to return it to service
BREAKFIX_DIAG_DUMP#
This runbook is automatically triggered when validation tests fail, collecting comprehensive diagnostic information for support ticket creation.
This runbook collects comprehensive diagnostic information:
Runs NVSSVT (NVIDIA System Software Validation Toolkit)
Collects NVSM (NVIDIA System Management) health dumps
Executes EUD (End User Diagnostics)
Runs Partnerdiag if necessary
Creates a consolidated diagnostic log dump package
Generates a Support ticket with diagnostic log for support (if opted in to support ticket service)
Prerequisites for EUD and Partnerdiag:
EUD: Binary must be installed on every compute node for execution
Partnerdiag: Binary must be installed on the head node under path
/cm/shared/partnerdiagIf these binaries are not properly installed, EUD and Partnerdiag will be skipped during diagnostic collection
View Break/Fix Result#
Users can monitor break/fix operations and determine outcomes through multiple methods:
Accessing Break/Fix Results#
Via Runbook Execution View:
Click “Runs” in the upper left corner
Filter by “BREAKFIX_TRIGGER” to see all break/fix executions
Select a specific run to view detailed execution flow
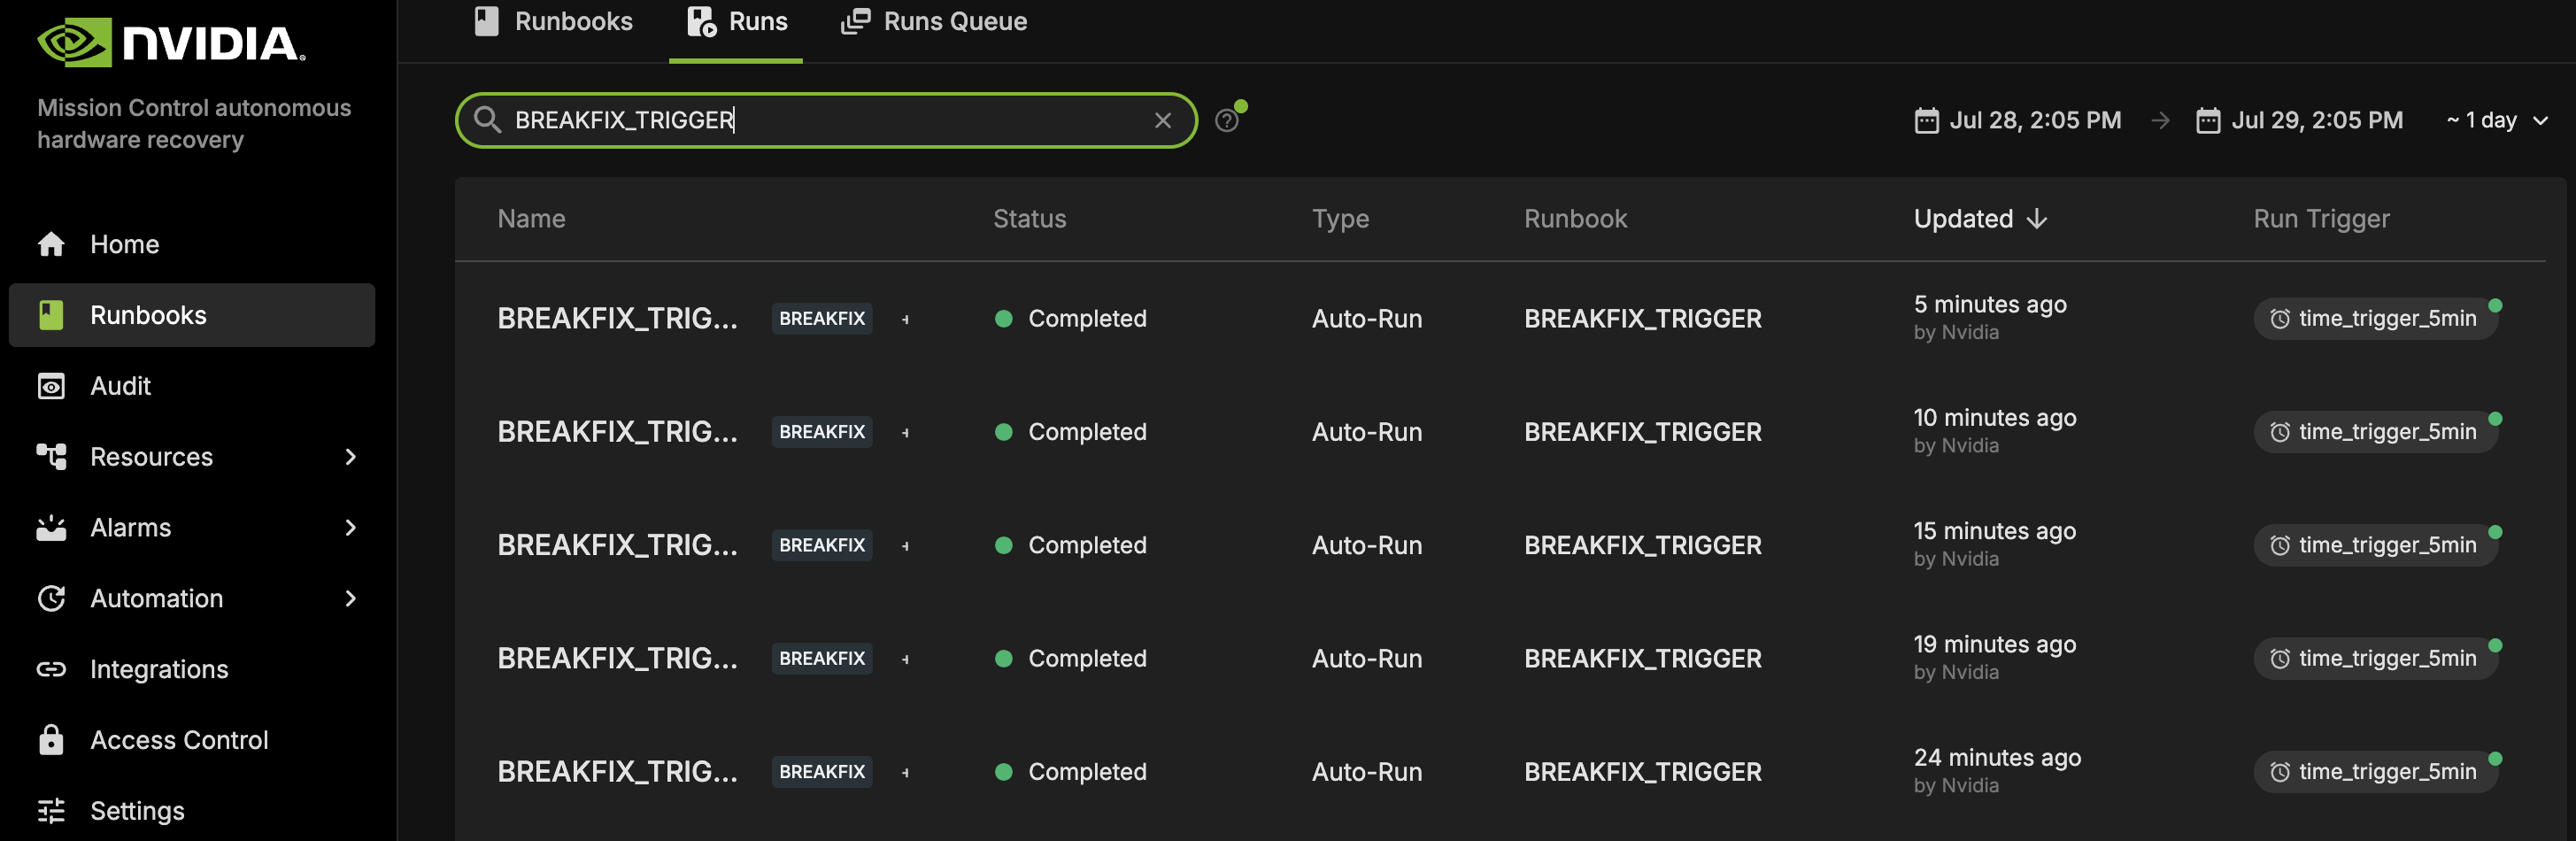
Via Resource Run History:
Navigate to “Resources” in the left panel and search for the resource (e.g., “b06-p1-dgx-06-c05”)
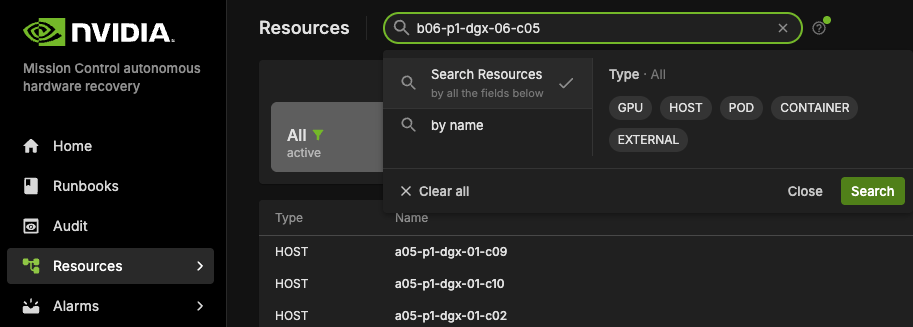
Click on the resource name
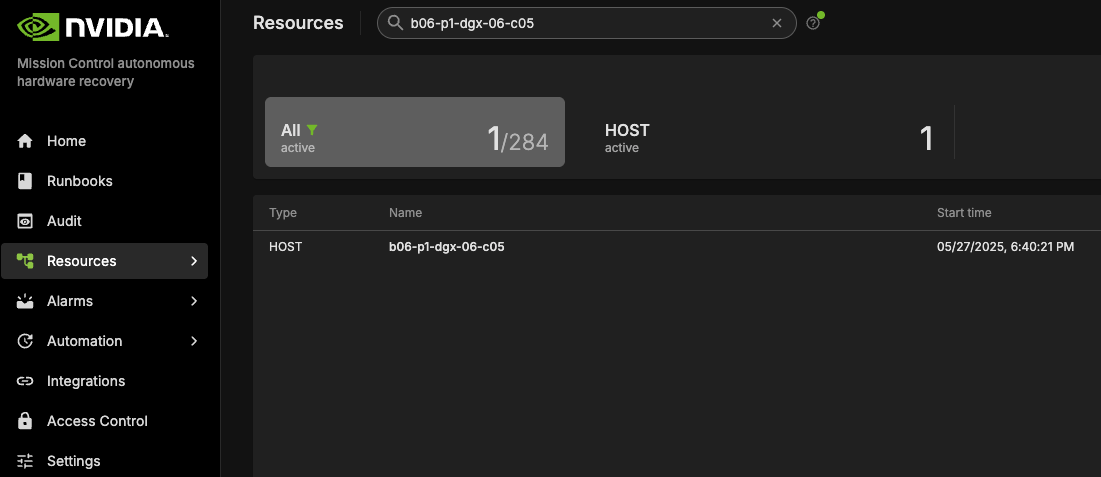
View the “Run History” page which displays all runbooks the resource participated in, with execution timestamps and status
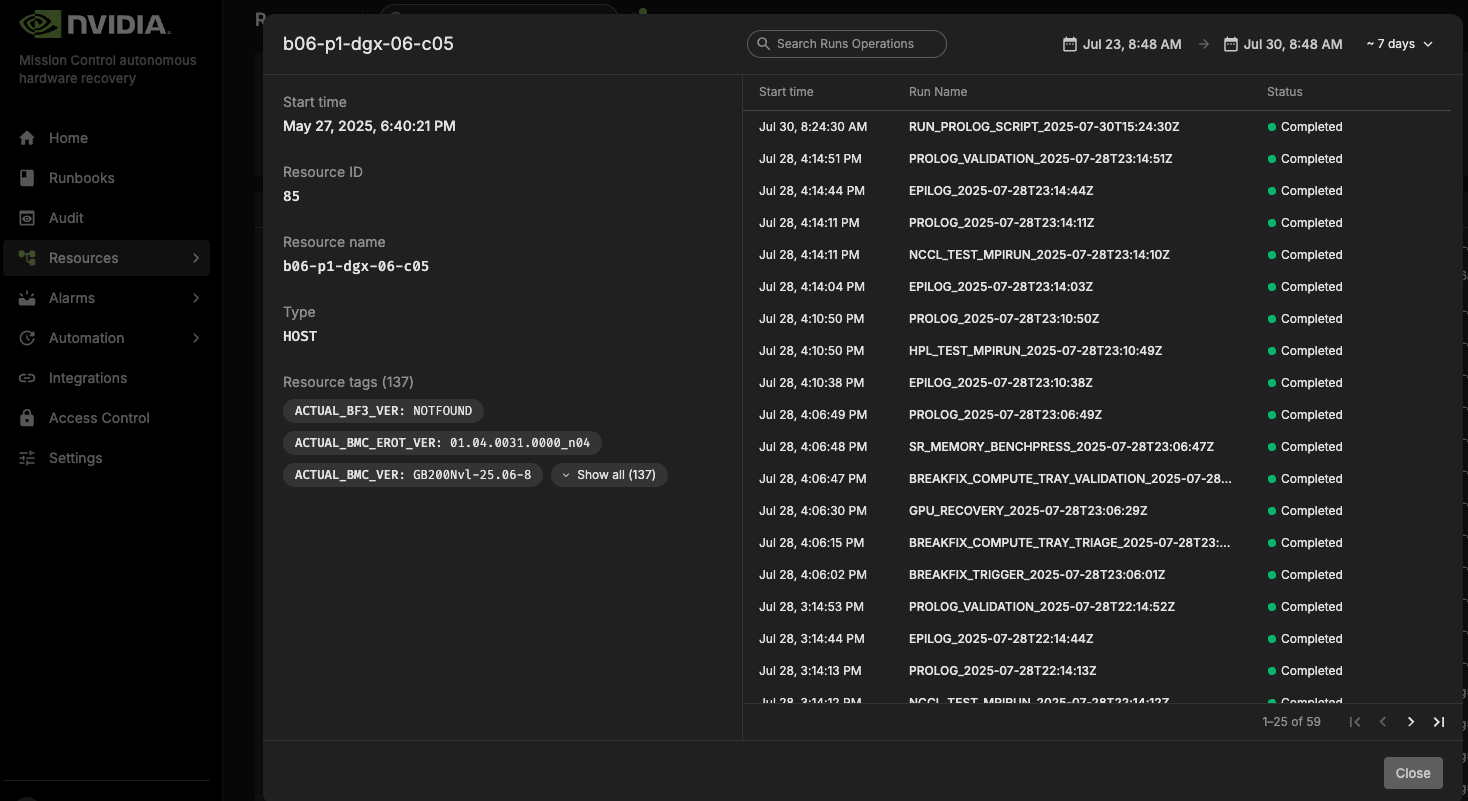
Filter or search for BREAKFIX related runbooks to see the complete history of remediation attempts for that specific node
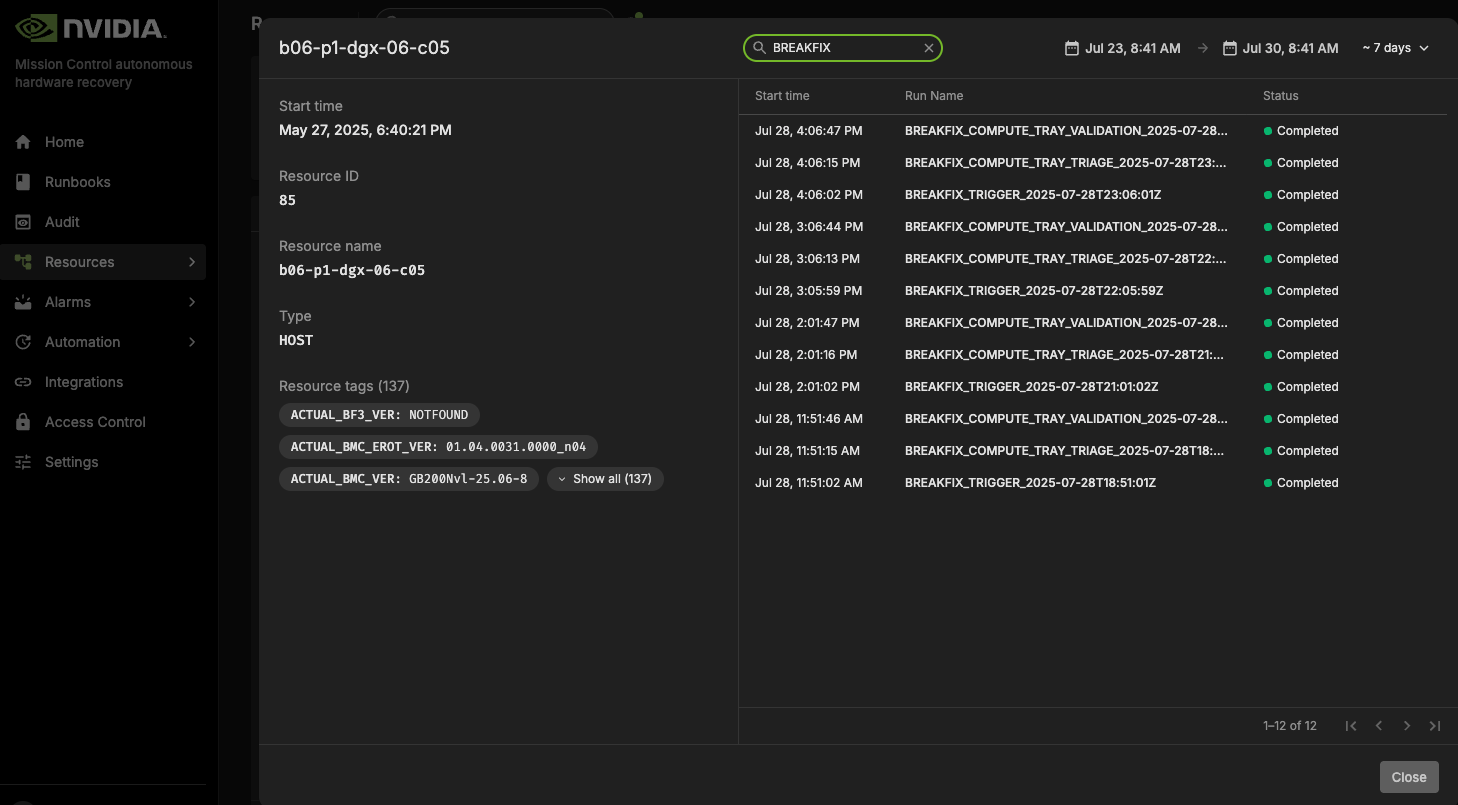
Understanding Break/Fix Outcomes#
Successful Recovery Indicators:
Node status changes from “DRAINED” to “IDLE” or “ALLOCATED” in BCM
Maintenance tag is removed from the node
BREAKFIX_COMPUTE_TRAY_VALIDATION shows “PASSED” status
Node is automatically returned to service
Failed Recovery Indicators:
Node remains in “DRAINED” state
Support ticket is automatically created (if opted in to support ticket service)
BREAKFIX_DIAG_DUMP execution indicates diagnostic collection
Maintenance tag remains on the node
Drain reason is updated to add “(AHR complete)” to indicate AHR processing has finished. Note that “(AHR in-progress)” indicates Break/Fix is still processing the node.
Determining Recovery Path#
GPU Recovery Path:
Look for GPU_RECOVERY runbook execution in the workflow
Check if GPU reboot or reset actions were performed
Validation results indicate GPU functionality restoration
Power Cycle Recovery Path:
BREAKFIX_COMPUTE_TRAY_TRIAGE shows auxiliary power cycle execution
Node connectivity tests show successful recovery
Monitoring Ongoing Operations#
Break/fix operations run every 5 minutes automatically
Check the “maintenance” tag to see which nodes are currently being processed
Review recent BREAKFIX_TRIGGER executions to track system-wide break/fix operations
NVIDIA Mission Control autonomous hardware recovery Break/Fix Post RMA#
Break/Fix Post RMA Introduction#
The NVIDIA Mission Control autonomous hardware recovery Break/Fix Post RMA workflow automates the process of bringing hardware components back into service after a Return Merchandise Authorization (RMA) replacement. This workflow ensures that replaced hardware is properly configured, firmware is updated to the correct versions, and the component is thoroughly validated before returning to production.

Figure: Break/Fix Post RMA Workflow - This diagram illustrates the comprehensive post-RMA process for compute tray replacement, starting with BCM inventory updates for new MAC addresses, followed by BMC credential management, OPROM configuration, and boot order correction. The workflow then proceeds through firmware updates to ensure correct versions, concludes with system validation including agent connectivity verification and comprehensive testing via BREAKFIX_COMPUTE_TRAY_VALIDATION, and automatically returns validated hardware to service.
Key Features#
Automated Configuration: Configures replaced hardware components with proper settings
Firmware Updates: Updates firmware to match the required versions for the environment
Boot Order Correction: Ensures proper boot sequence for reliable operation
Comprehensive Validation: Performs thorough testing to verify hardware functionality
Seamless Integration: Automatically returns validated hardware to service
Post RMA Workflow Components#
The Post RMA workflow consists of several key steps that ensure replaced hardware is properly configured and validated:
Physical Replacement Procedures#
Compute Tray Removal: Detailed step-by-step instructions for safely removing failed compute trays, including power down procedures, cable disconnection, and proper handling
Compute Tray Installation: Comprehensive installation guide covering component migration (M.2 boot drive, E1.S cache drives, HMC, BMC, TPM), rail installation, and cable reconnection
Component Migration: Transfer of critical components from old tray to new tray while maintaining proper slot assignments and ESD protection
BCM Inventory Update#
ONLY REQUIRED FOR NEW HARDWARE: Updates BCM inventory information using the BREAKFIX_POST_RMA_UPDATE_BCM_INVENTORY runbook when a new compute tray is installed (GB300 uses a dedicated runbook with parameters for BMC MAC, BF3_1 MAC/Storage, host name, and optional tray serial number)
Skip this step for repaired trays as MAC addresses remain unchanged
Ensures MAC addresses and other hardware identifiers are correctly registered in BCM (new MAC addresses are provided by the Enterprise Support team who manage serial numbers and asset inventory for customer deployments)
Enables proper management and monitoring of the replaced hardware
BMC Credential Management#
Creates necessary BMC credential files for secure access to hardware components
Establishes secure communication channels for configuration operations
BlueField Configuration#
Checks if BlueField devices are in NIC mode
Enables OPROM on BlueField devices to ensure proper initialization
Configures hardware components for optimal operation
Boot Order Correction#
Ensures the boot sequence is properly configured
Prevents boot failures and improves system reliability
Performs power reset through BMC after configuration changes
Connectivity Verification#
Verifies SSH connectivity to compute nodes
Checks BCM device status to ensure proper registration
Confirms network accessibility before proceeding with firmware updates
Firmware Updates#
Upgrades compute firmware to the version in the specified package directory
Upgrades Mellanox BlueField and ConnectX firmware using the provided package file paths
Uses the golden configuration JSON (FW_SOURCE_JSON_PATH) for validation; all components are updated in a single run
System Validation#
Waits for hosts to come back online after each firmware update cycle
Verifies agent connectivity to ensure management capabilities
Runs comprehensive validation tests using BREAKFIX_COMPUTE_TRAY_VALIDATION
Opens nodes in BCM and validates Slurm readiness for successful nodes
Running the Post RMA Workflow#
Step 1: Update BCM Inventory (ONLY FOR NEW HARDWARE)#
Note: This step is ONLY required when installing a new compute tray. Skip this step for repaired trays as MAC addresses remain unchanged.
For new hardware replacement, update the BCM inventory with new MAC addresses and hardware identifiers using the BREAKFIX_POST_RMA_UPDATE_BCM_INVENTORY runbook. This runbook updates the BCM inventory accordingly and supports provisioning the compute node and running baseline tests.
Navigate to the “BREAKFIX_POST_RMA_UPDATE_BCM_INVENTORY” runbook in the Runbooks section
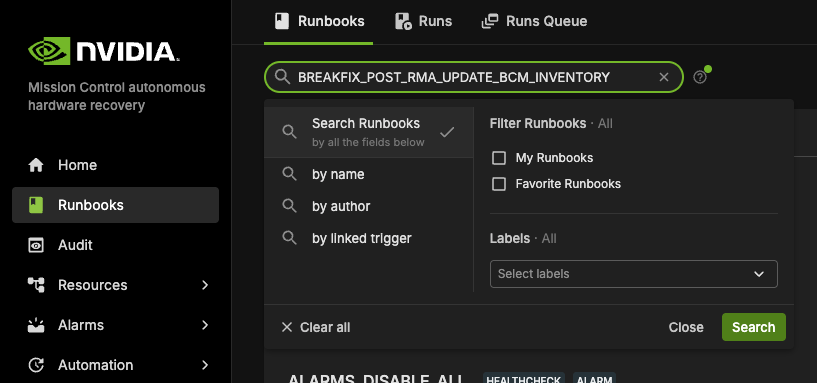
Configure the required parameters (MAC addresses and serial numbers are provided by the Enterprise Support team):
HOST_NAME (required): Host name to update in BCM inventory (e.g., a07-p1-dgx-03-c08)
BMC_MAC (required): MAC Address of the BMC
BF3_1_MAC (required): MAC Address of Predictable Network Interface Name enP22p3s0f0np0
BF3_1_STORAGE (optional): MAC Address of Predictable Network Interface Name enP22p3s0f1np1
TRAY_SERIAL_NUMBER (optional): Serial Number of the Tray
Select “Create Run” to initiate the BCM inventory update
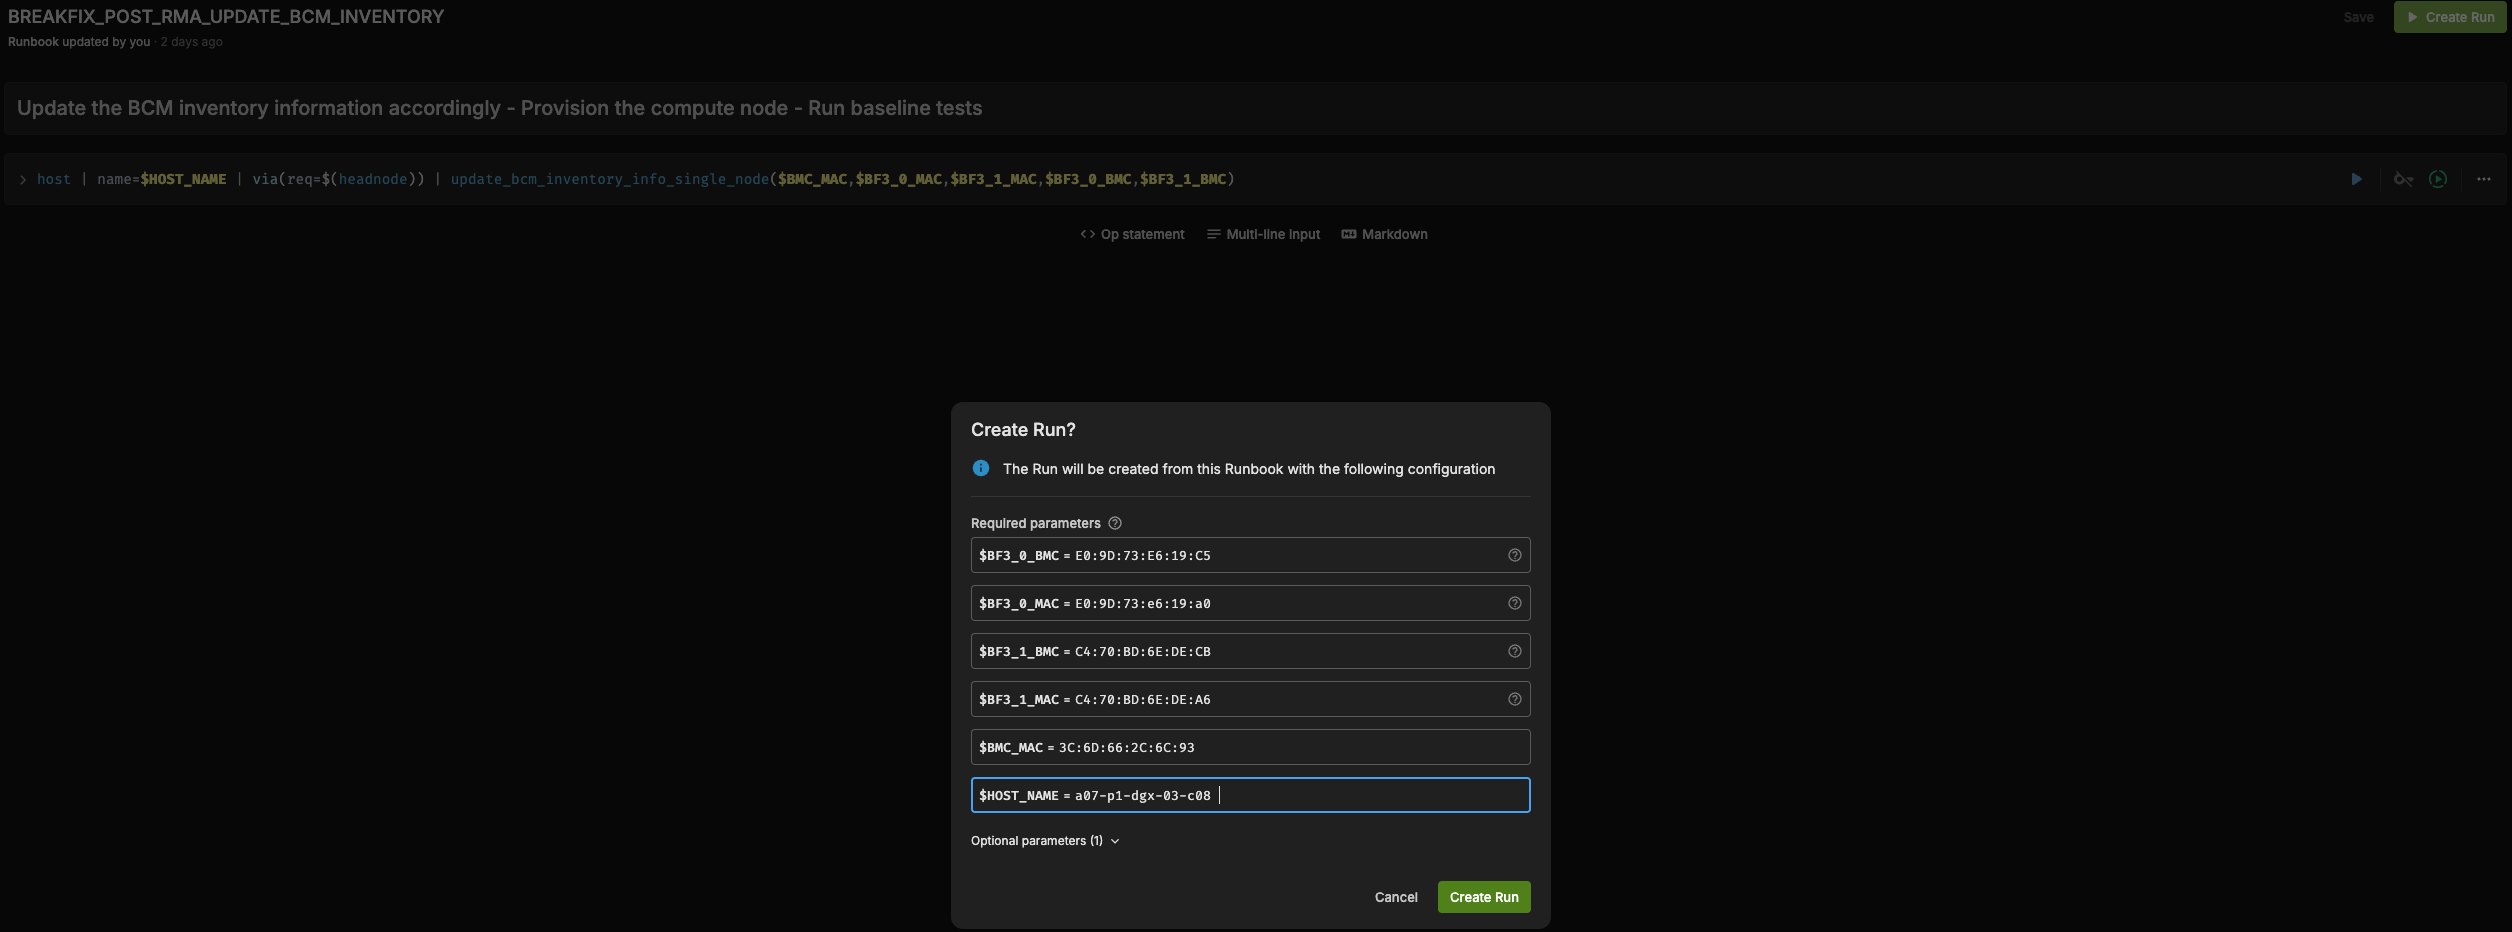
Monitor the execution progress to ensure successful completion
Step 2: Execute Main Post RMA Workflow#
After successfully updating the BCM inventory (if required for new hardware), proceed with the main Post RMA workflow:
To execute the Post RMA workflow:
Navigate to the “BREAKFIX_POST_RMA” runbook in the Runbooks section
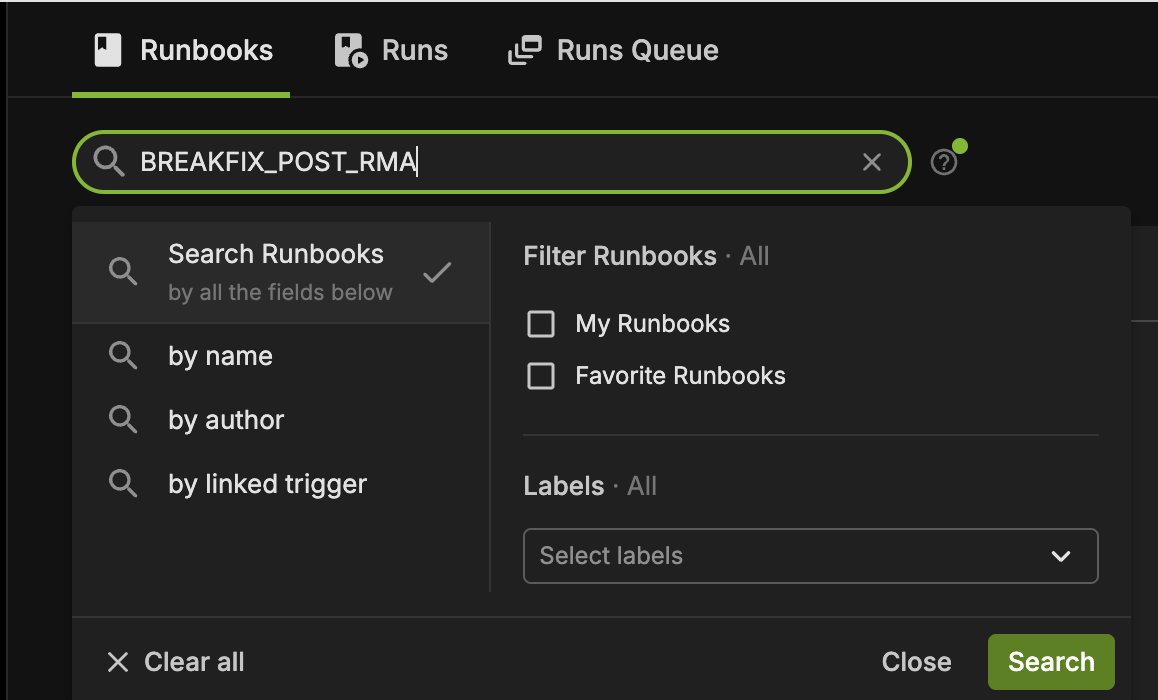
Configure the required parameters:
HOST_NAME (required): Name of the replaced host (e.g., a07-p1-dgx-03-c08)
FWPKG_DIR_PATH (required): Full path to the directory containing all firmware packages or the individual package (.fwpkg) for compute nodes
FWPKG_BF_FILE_PATH (required): Full path to the BlueField (BF3) firmware package file
FWPKG_CX_FILE_PATH (required): Full path to the ConnectX firmware package file
FW_SOURCE_JSON_PATH (required): Path to the golden configuration JSON from the firmware package; defines reference settings for validation. Set to NA if not available.
resource_tag (optional): Tag for resource query (e.g., rack_name)
resource_value (optional): Value for resource query (e.g., rack identifier)
Configure the required secrets (if not already configured):
AHR_API_ENDPOINT: The API endpoint URL for NVIDIA Mission Control
AHR_TOKEN: Authentication token for API access
To add or update these secrets:
In the Shoreline UI, go to Settings.
Click on the Secrets section.
Use the + Secret button to create:
AHR_API_ENDPOINT— Provide the correct API endpoint.AHR_TOKEN— Provide the secure API token.
If a secret already exists, click its name to update the value.
Click Save to persist the changes.
🔐 These secrets will be securely injected into the action at runtime.
Select “Create Run” to initiate the workflow
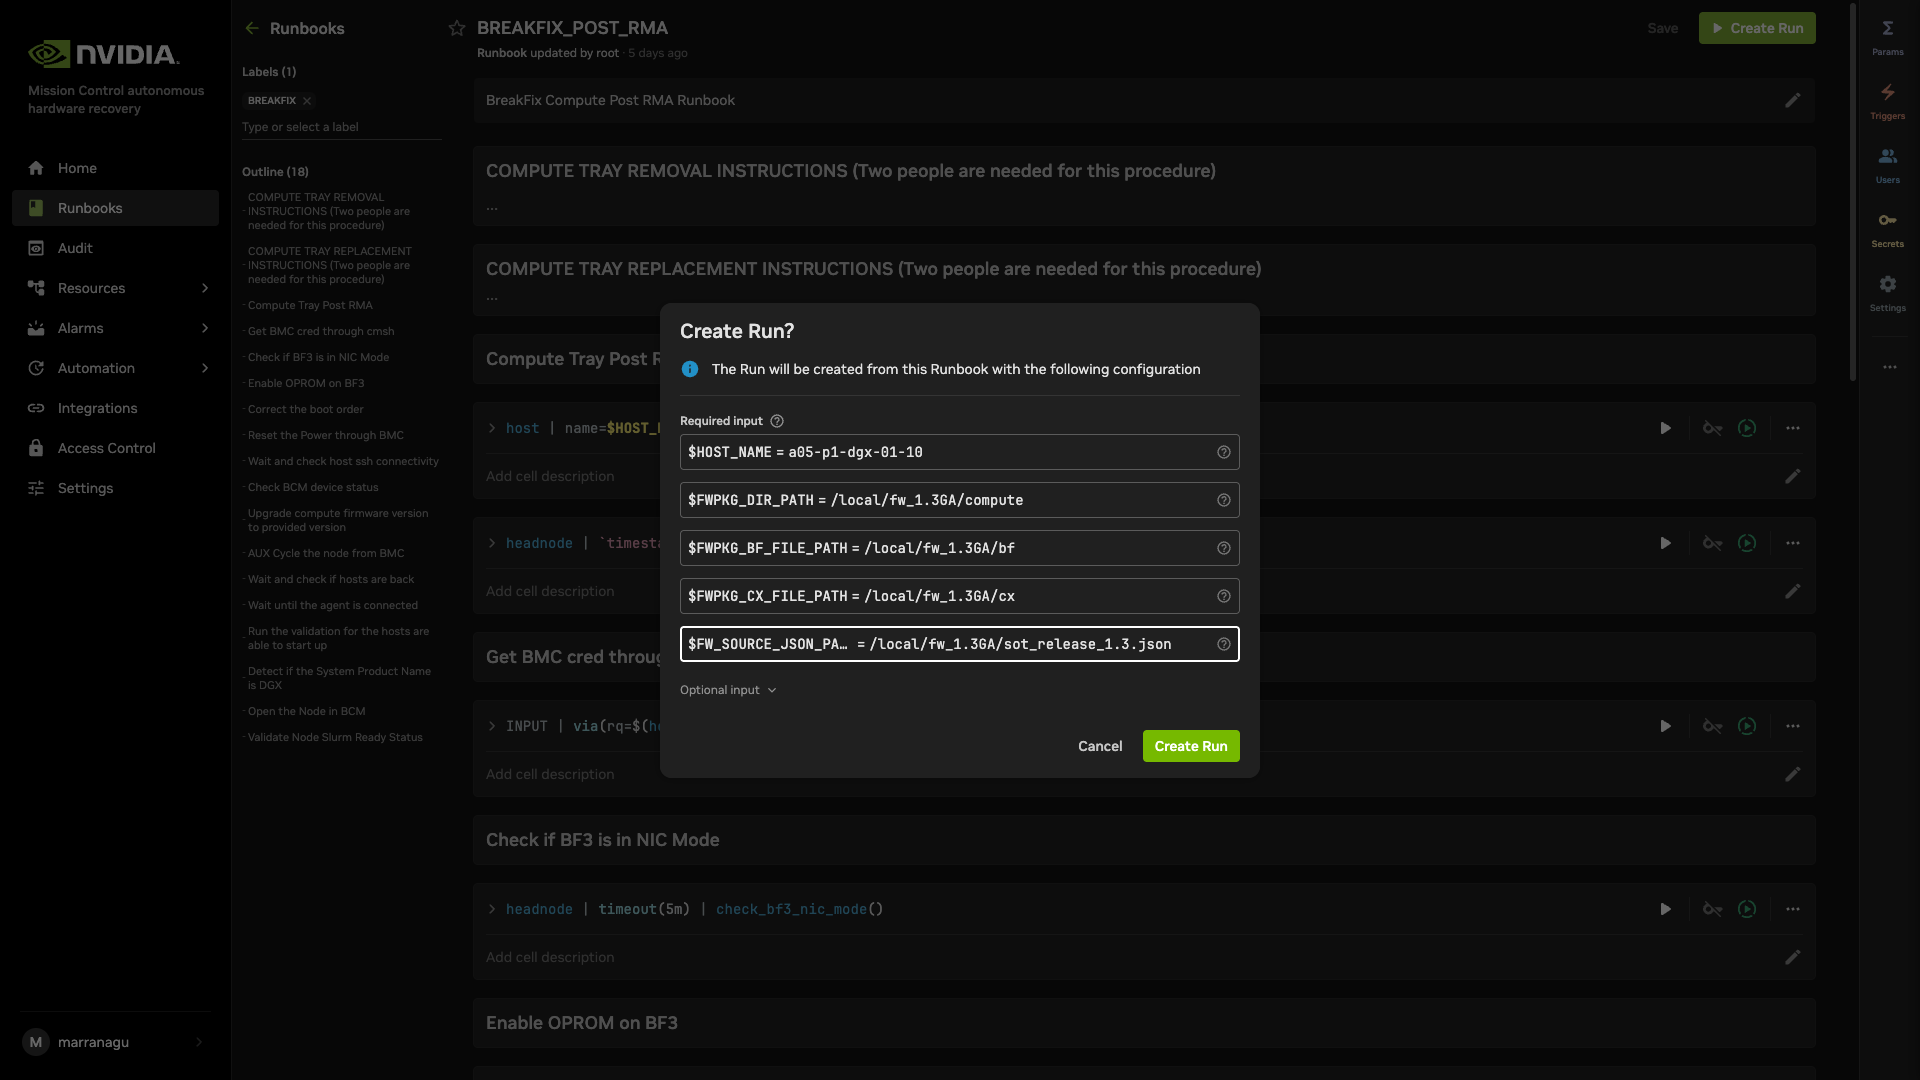
Monitor the execution progress and results
Note: The workflow includes detailed physical replacement instructions that must be followed before executing the automated portions. Ensure all physical replacement steps are completed as outlined in the runbook’s markdown sections.
NVIDIA Mission Control autonomous hardware recovery Break/Fix Post RMA Powershelf#
Break/Fix Post RMA Powershelf Introduction#
The Break/Fix Post RMA Powershelf workflow brings a replaced power shelf tray back into service after an RMA. It is available for GB300 and GB200 and consists of two runbooks: updating BCM inventory for the new powershelf node (when applicable), then running the main powershelf post RMA workflow to verify BCM status, identify the PowerShelf manufacturer (LiteOn or Delta), and upgrade PSU and PMC firmware to the provided versions.
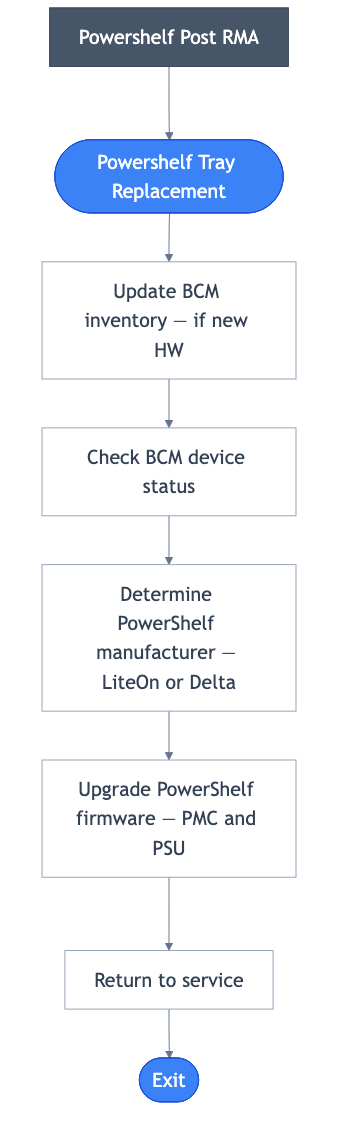
Figure: Powershelf Post RMA Workflow — BCM inventory update (if new HW), Check BCM device status, Determine manufacturer (LiteOn or Delta), Upgrade PMC and PSU firmware, Return to service.
Running the Post RMA Powershelf Workflow#
Step 1: Update BCM Inventory (ONLY FOR NEW POWERSHELF HARDWARE)#
Note: This step is ONLY required when installing a new power shelf tray. Skip for repaired trays where the BMC MAC is unchanged.
Use the BREAKFIX_POST_RMA_UPDATE_POWERSHELF_BCM_INVENTORY runbook to register the new powershelf in BCM:
Navigate to the “BREAKFIX_POST_RMA_UPDATE_POWERSHELF_BCM_INVENTORY” runbook in the Runbooks section.
Configure the required parameters:
HOST_NAME (required): Host name to update in BCM inventory (e.g., b06-p01-pwr-01).
BMC_MAC (required): MAC address of the powershelf BMC.
Select “Create Run” and monitor the execution.
Step 2: Execute Main Powershelf Post RMA Workflow#
After updating BCM inventory (if required for new hardware), run the main powershelf post RMA workflow:
Navigate to the “BREAKFIX_POWERSHELF_POST_RMA” runbook in the Runbooks section.
Configure the required parameters:
resource_value (required): Scope value (e.g., rack name) for the workflow.
HOST_NAME (required): Name of the replaced powershelf host (e.g., b06-p01-pwr-01).
PSU_FILE_FULL_PATH (required): Full path to the PSU tar file for powershelf nodes.
PMC_FILE_FULL_PATH (required): Full path to the PMC tar file for powershelf nodes.
FW_SOURCE_JSON_PATH (required): Path to the golden configuration JSON from the firmware package; defines reference settings for validation.
Select “Create Run” to start the workflow. The runbook checks BCM device status, determines the PowerShelf manufacturer (LiteOn or Delta), and upgrades PSU and PMC firmware via the firmware upgrade step. Monitor execution until completion.
NVIDIA Mission Control autonomous hardware recovery Domain Triage#
Domain Triage Introduction#
The BREAKFIX_DOMAIN_TRIAGE runbook provides manual diagnostics and troubleshooting for NVSwitch and NVLink domain-level issues. This workflow is only manually triggered on demand when domain-level problems are identified; it is not automatically triggered by BREAKFIX_TRIGGER (unlike the Break/Fix Workflow, which is triggered automatically). This workflow is designed to collect comprehensive diagnostic information when problems are detected at the domain level, facilitating efficient resolution and minimizing system downtime. This runbook is available for GB300 and GB200 only.
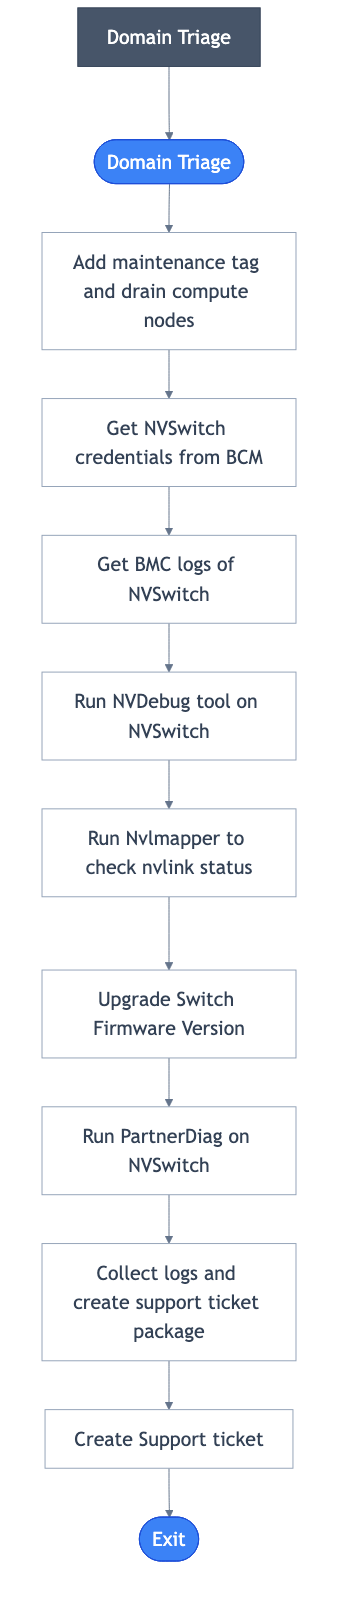
Figure: Domain Triage Workflow - This diagram illustrates the comprehensive domain-level diagnostic process for NVSwitch and NVLink issues. The workflow begins with compute node management by adding maintenance tags and draining nodes to prevent workload interference. It then proceeds through NVSwitch credential management to establish secure access, followed by extensive diagnostic data collection including BMC log dumps, NVDebug analysis, Nvlmapper connectivity checks, and PartnerDiag hardware diagnostics. The process concludes with case management that consolidates all diagnostic information into a comprehensive package and creates support tickets with attached logs for efficient troubleshooting.
Domain Triage Workflow Components#
The Domain Triage workflow consists of several key steps that ensure thorough diagnosis of NVSwitch and NVLink domain issues:
Compute Node Management#
Adds AHR maintenance tags to all compute nodes in the affected rack
Drains compute nodes from Slurm to prevent workloads from running during diagnostics (no jobs will be scheduled on the entire rack)
NVSwitch Credential Management#
Retrieves BMC credentials for NVSwitches from BCM
Establishes secure access to NVSwitch components for diagnostics
Collects system rack serial numbers for identification
Diagnostic Data Collection#
Dumps BMC logs from NVSwitches to capture hardware-level events
Runs NVDebug tool to collect detailed information about NVSwitch status
Executes Nvlmapper tool to check NVLink status and connectivity (binary must be installed under /tmp/nvlmapper; see PID for download)
Switch Firmware Upgrade#
Upgrades NVSwitch firmware to the version provided in the specified package directory, using the golden configuration JSON for validation
PartnerDiag#
Runs PartnerDiag for comprehensive hardware diagnostics (binary must be installed under /tmp/partnerdiag; see PID for download)
Case Management#
Collects and organizes all diagnostic logs into a single package
Creates a support ticket with the consolidated diagnostic package (default message: NMC_BREAKFIX_NVSwitch; details: “Potential NVSwitch or NVLink issue”)
Attaches detailed logs to facilitate efficient troubleshooting
Running the Domain Triage Workflow#
Note: Domain Triage must be manually triggered on demand and is not an automated trigger runbook like BREAKFIX_TRIGGER.
To manually execute the Domain Triage workflow:
Navigate to the “BREAKFIX_DOMAIN_TRIAGE” runbook in the Runbooks section
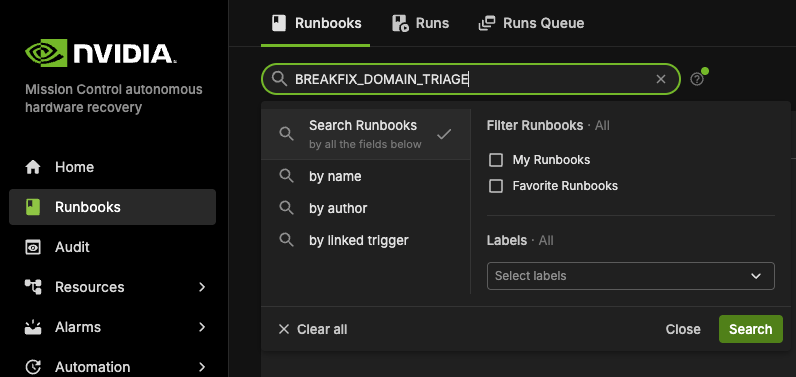
Configure the required parameters:
resource_tag: Tag for the resource query (use
rack_namefor rack filtering).resource_value: Value for the resource query; set to the rack to diagnose (e.g., B05). Use the same value as you would for RACK_NAME.
SWITCH_FWPKG_DIR_PATH: Full path to the directory containing all firmware packages for the switch node.
FW_SOURCE_JSON_PATH: Path to the golden configuration JSON file (from the firmware package) that defines the reference settings used for validation.
Optionally set:
IGNORE_LIST: Comma-separated list of nodes to exclude from scope (e.g.,
node01,node02), ornone.MESSAGE: Message for the support ticket (default: NMC_BREAKFIX_NVSwitch).
SYSTEM_SERIAL, BMC_CRED_FILE, LOG_FILE_PATH: For support ticket and credential/log paths when needed.
Select “Create Run” to initiate the workflow
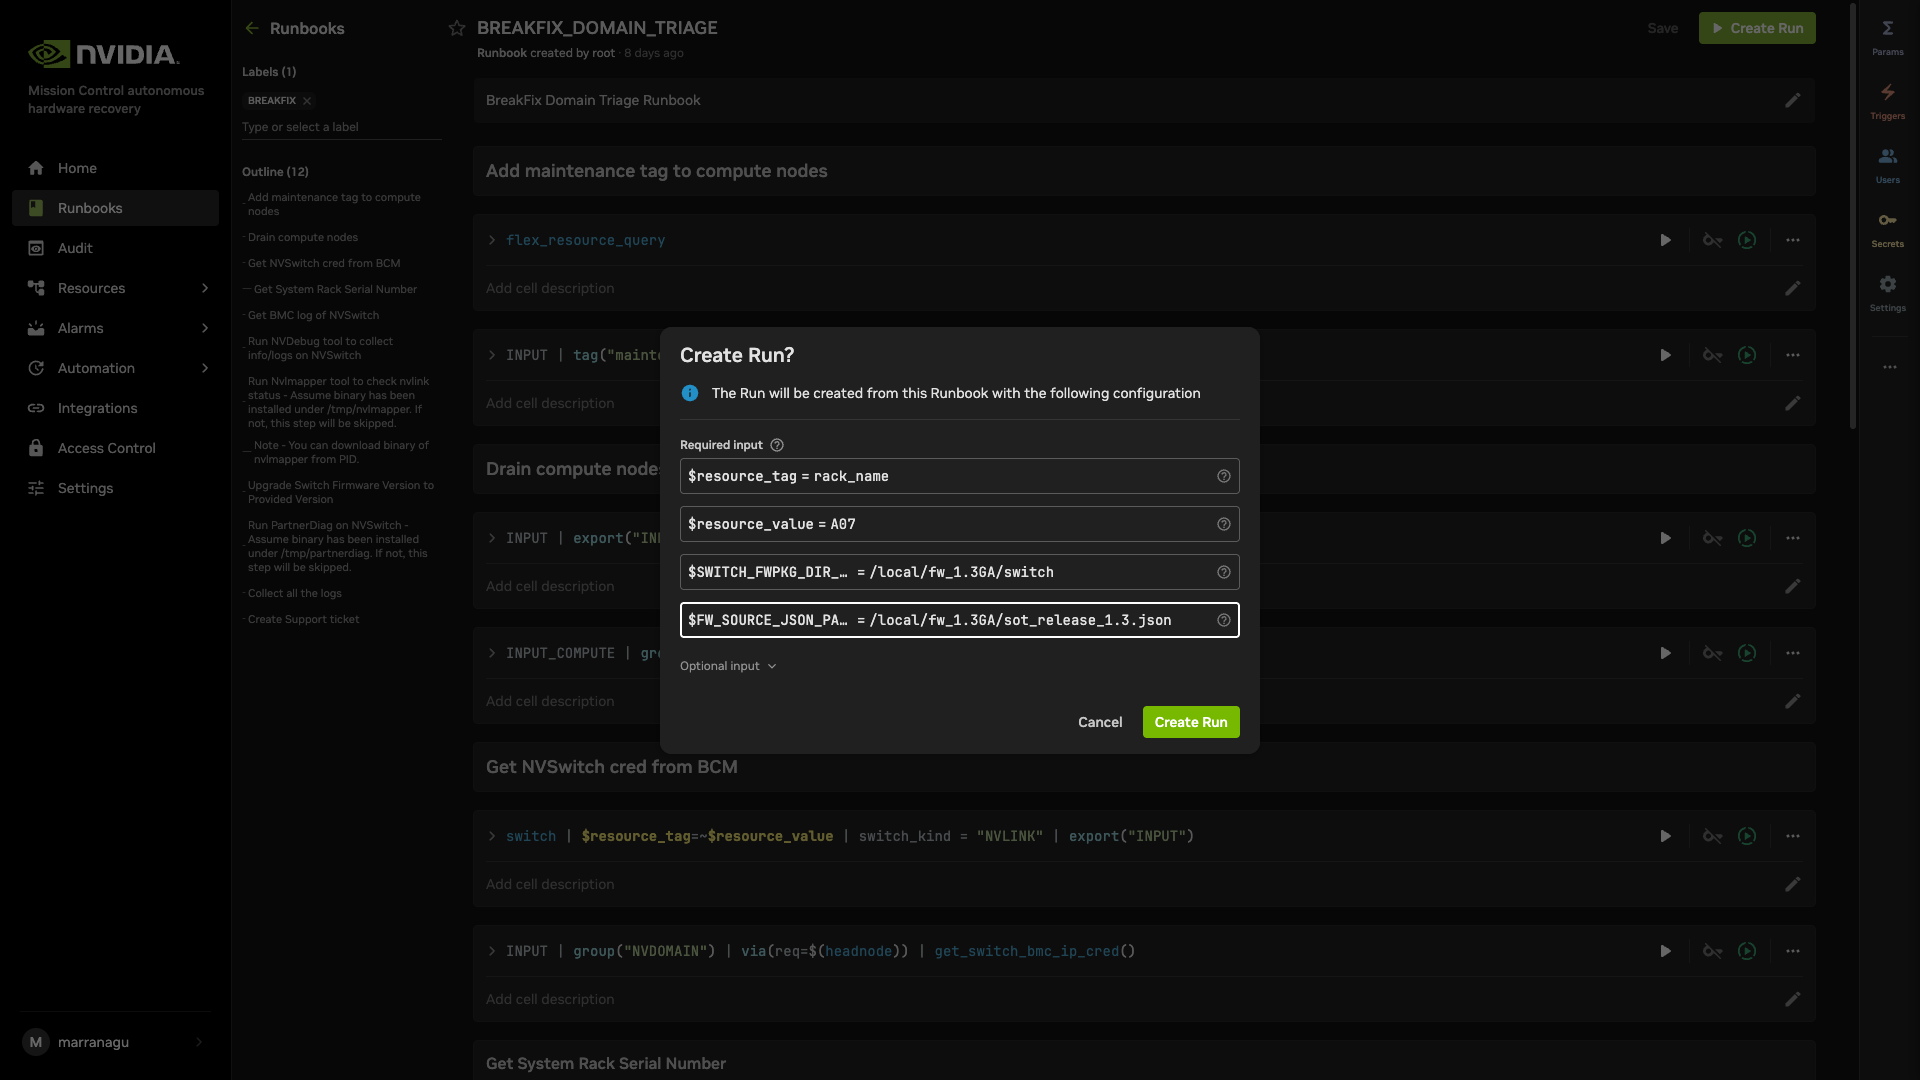
Monitor the execution progress and results
Domain Triage Results#
Accessing Domain Triage Results#
Via Runbook Execution View:
Navigate to “Runbooks” in the left panel
Click “Runs” in the upper left corner
Filter by “BREAKFIX_DOMAIN_TRIAGE” to see all domain triage executions
Select a specific run to view detailed execution flow
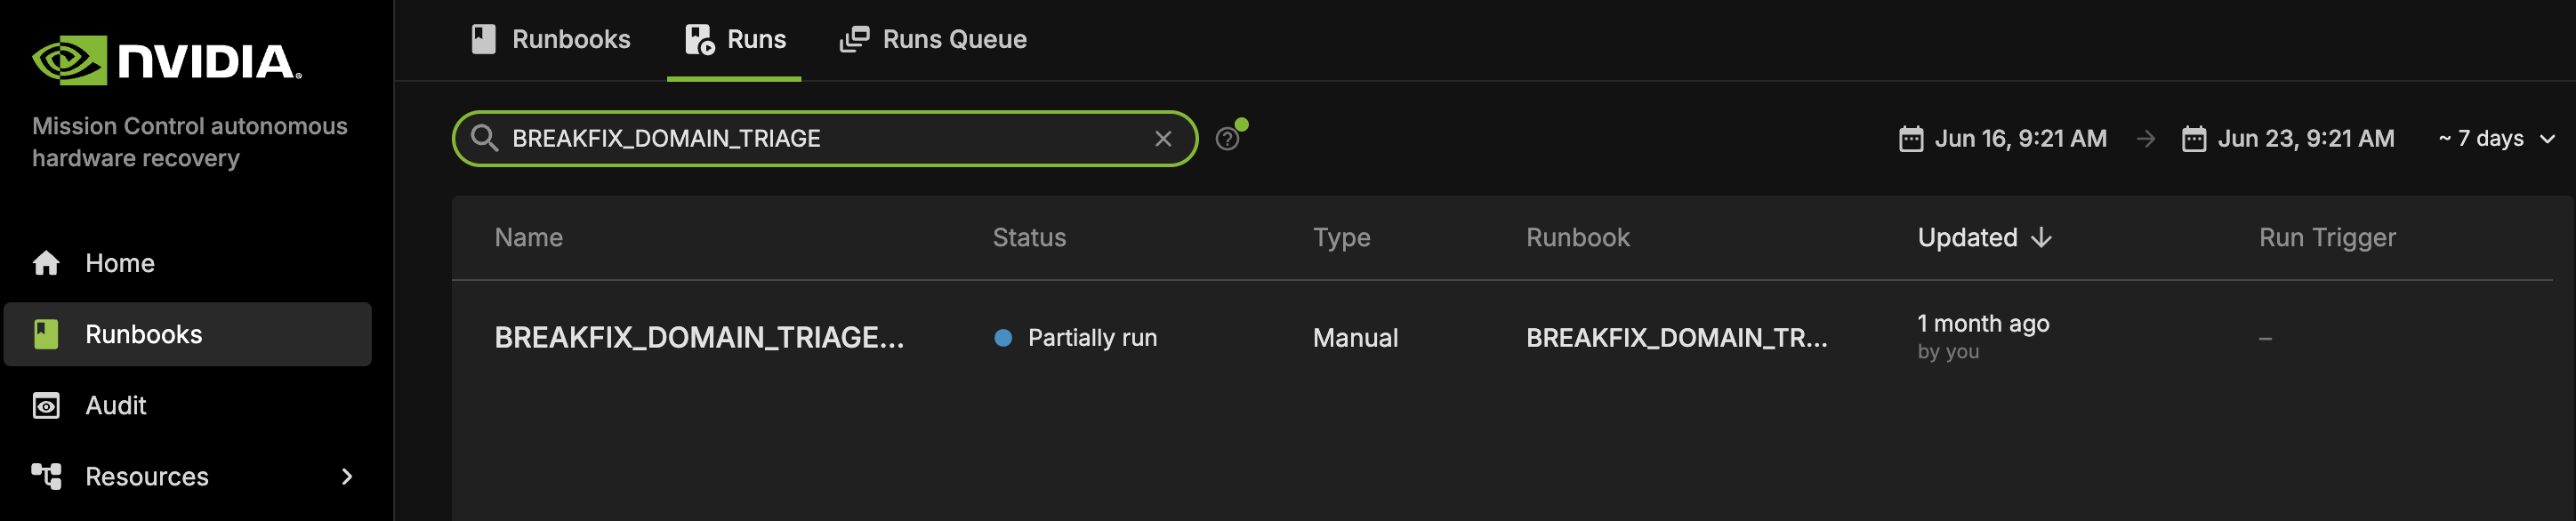
Via Resource Run History:
Navigate to “Resources” in the left panel and search for rack name (e.g., “b07”)
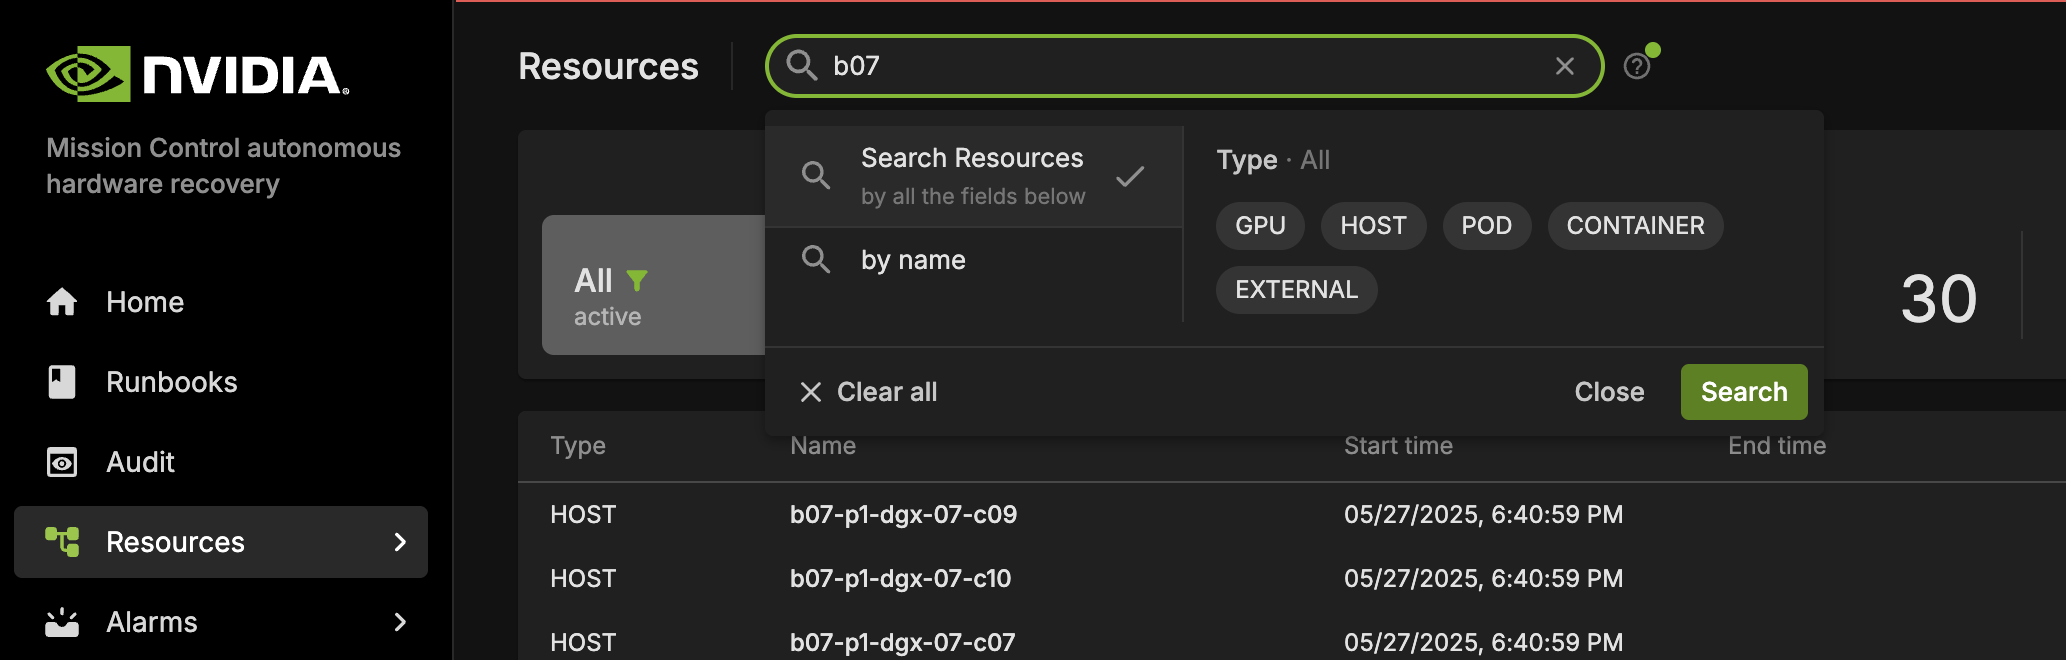
Click on any compute node from the affected rack
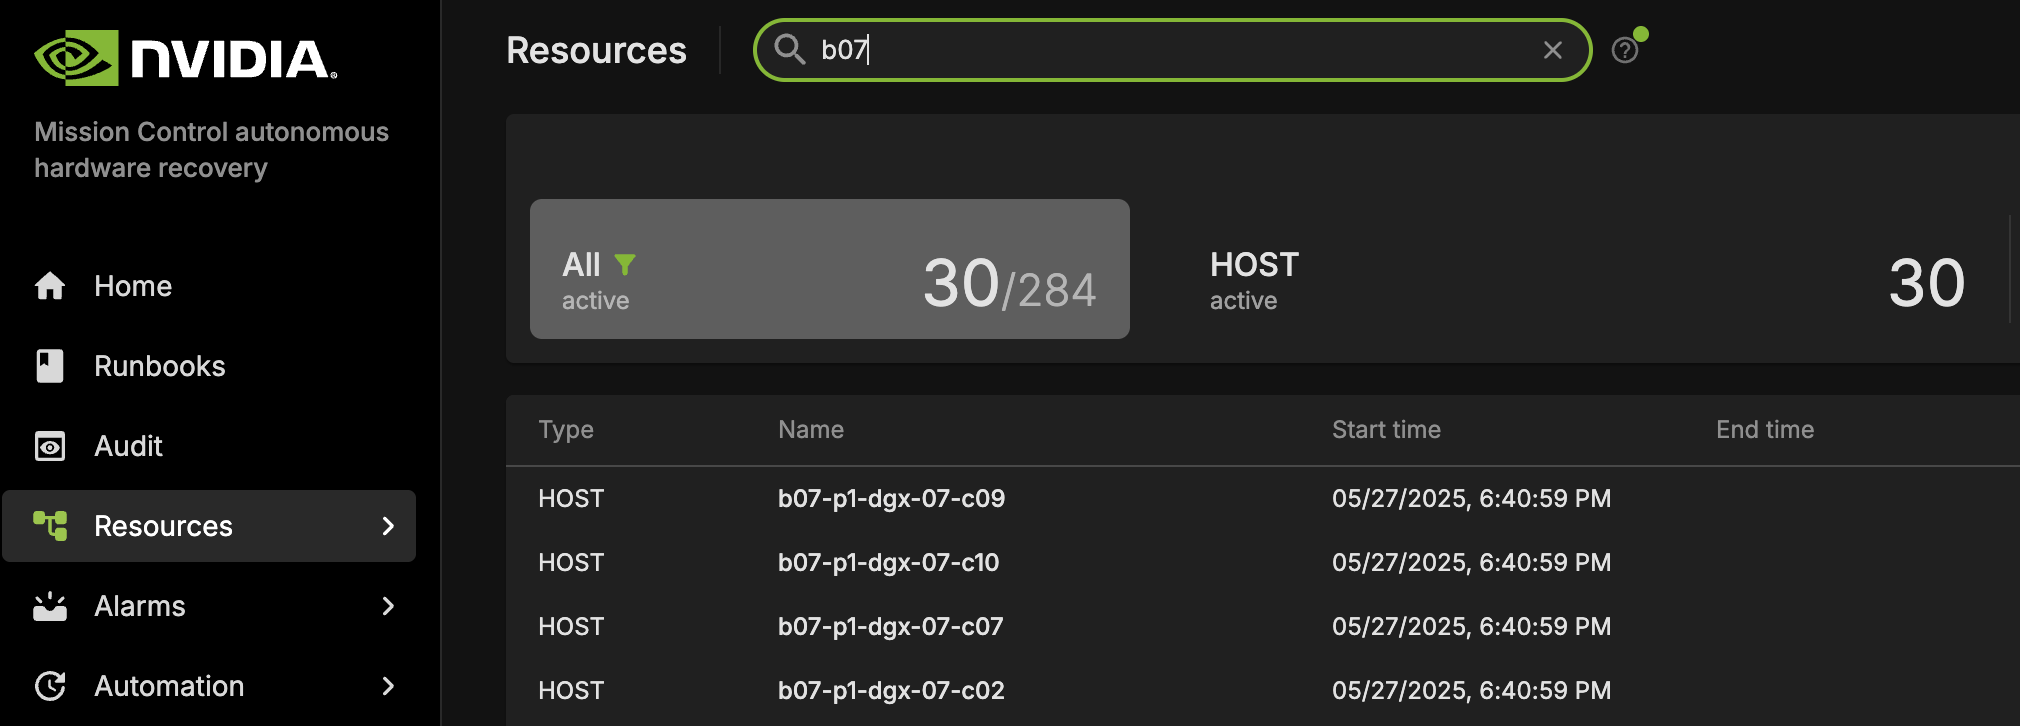
View the “Run History” page to see all domain triage executions for that resource
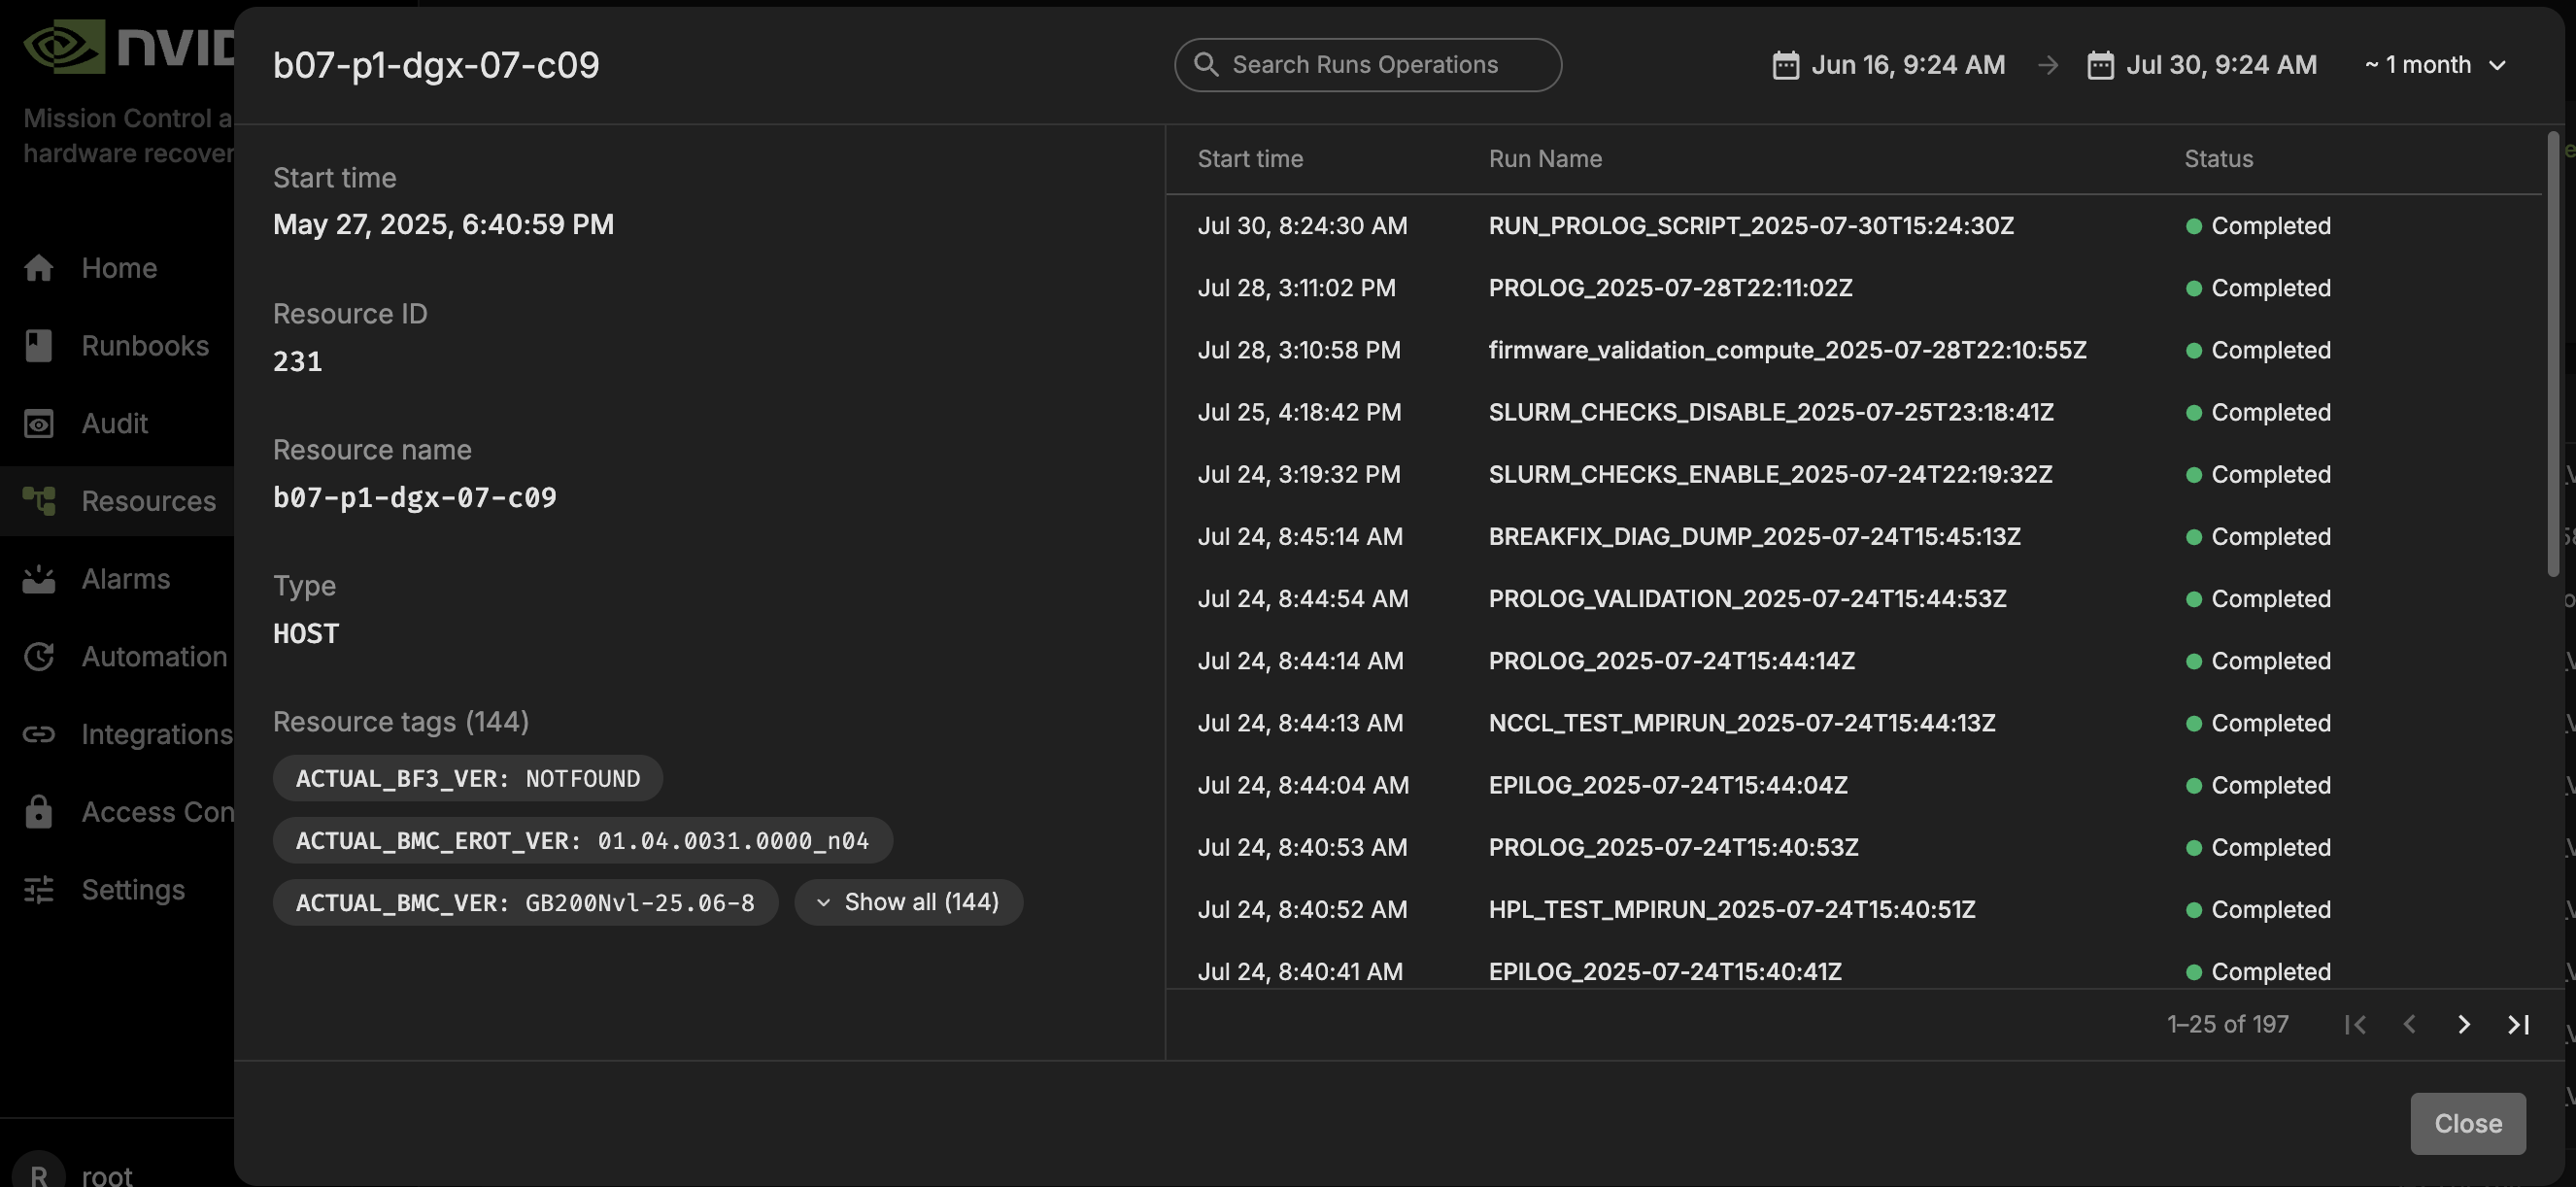
Filter for “BREAKFIX_DOMAIN_TRIAGE” to see domain-level diagnostic attempts
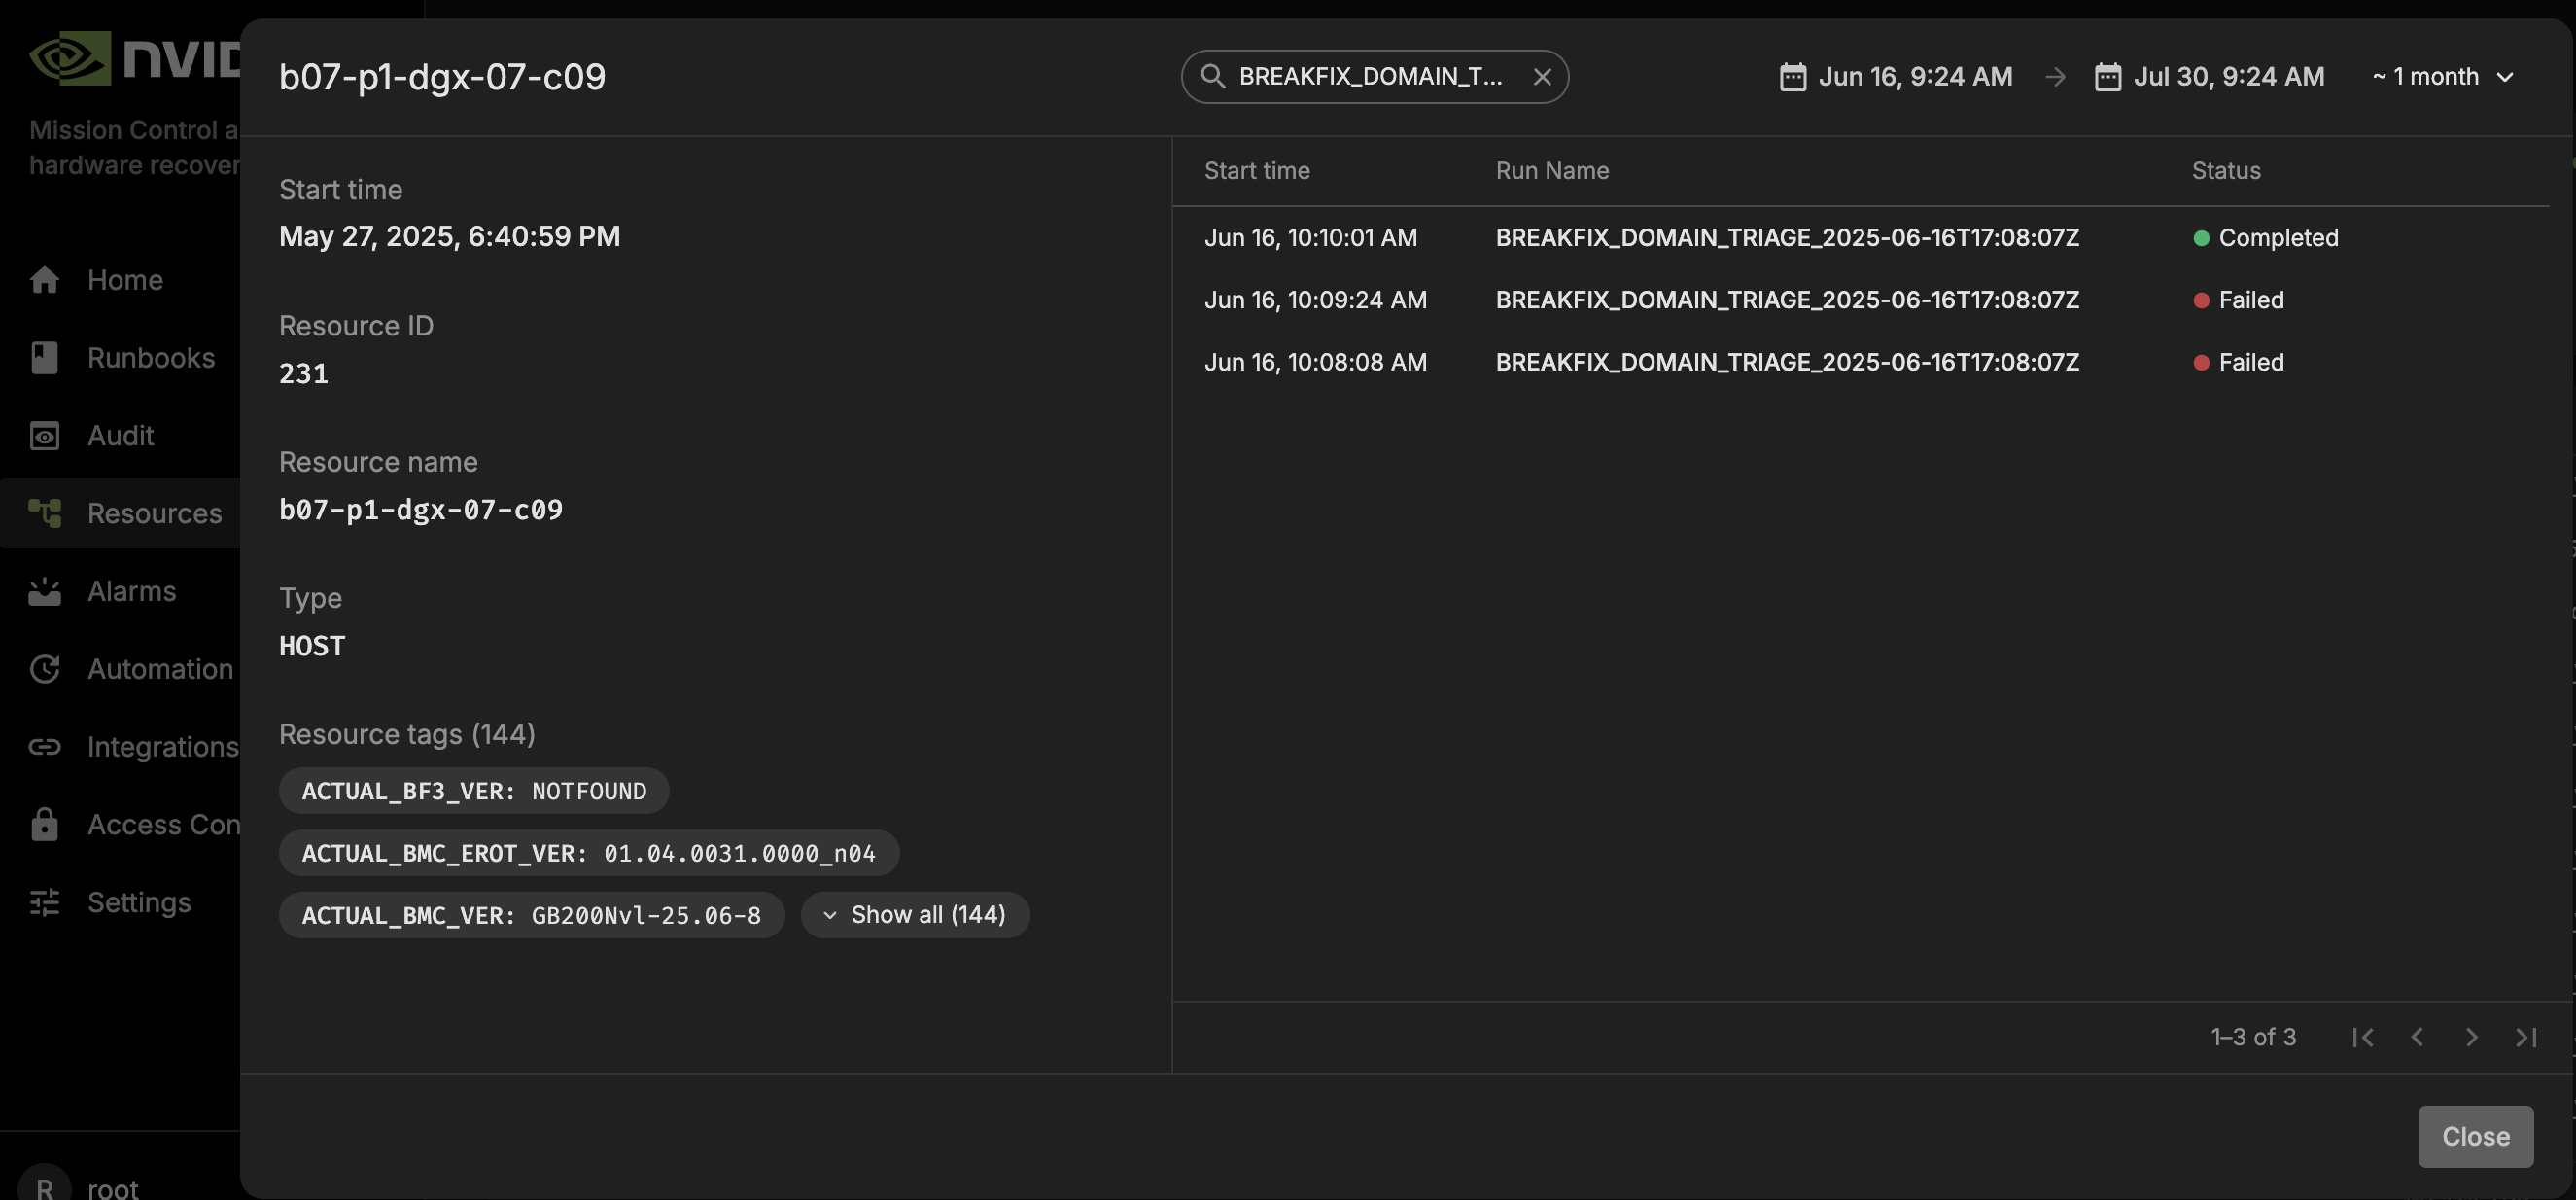
Understanding Domain Triage Outcomes#
After successful completion of the Domain Triage workflow:
Diagnostic Data Collection:
BMC logs from all NVSwitches in the affected domain
NVDebug output containing detailed switch status information
Nvlmapper results showing NVLink connectivity status
PartnerDiag comprehensive hardware diagnostic reports
Support Ticket Creation:
Automated support ticket generation with consolidated diagnostic package (if opted in to support ticket service)
All collected logs attached to the ticket for support team analysis
Rack serial numbers and system identification included
Maintenance tags remain on compute nodes until issue resolution
Monitoring Domain Triage Progress#
During Execution:
Check compute node status - nodes should show maintenance tags
Verify diagnostic tool execution in runbook cells
Monitor support ticket creation process
Post-Execution:
Support teams receive comprehensive diagnostic information
All relevant logs are organized and accessible
System remains in maintenance mode pending resolution
NVIDIA Mission Control autonomous hardware recovery Break/Fix Switch Post RMA#
Switch Post RMA Introduction#
The NVIDIA Mission Control autonomous hardware recovery Break/Fix Switch Post RMA workflow automates the process of bringing NVSwitch components back into service after a Return Merchandise Authorization (RMA) replacement. This comprehensive workflow includes both physical switch tray replacement procedures and automated software configuration to ensure that replaced switch hardware is properly configured, firmware is updated to the correct versions, and the component is thoroughly validated before returning to production. This runbook is available for GB300 and GB200.
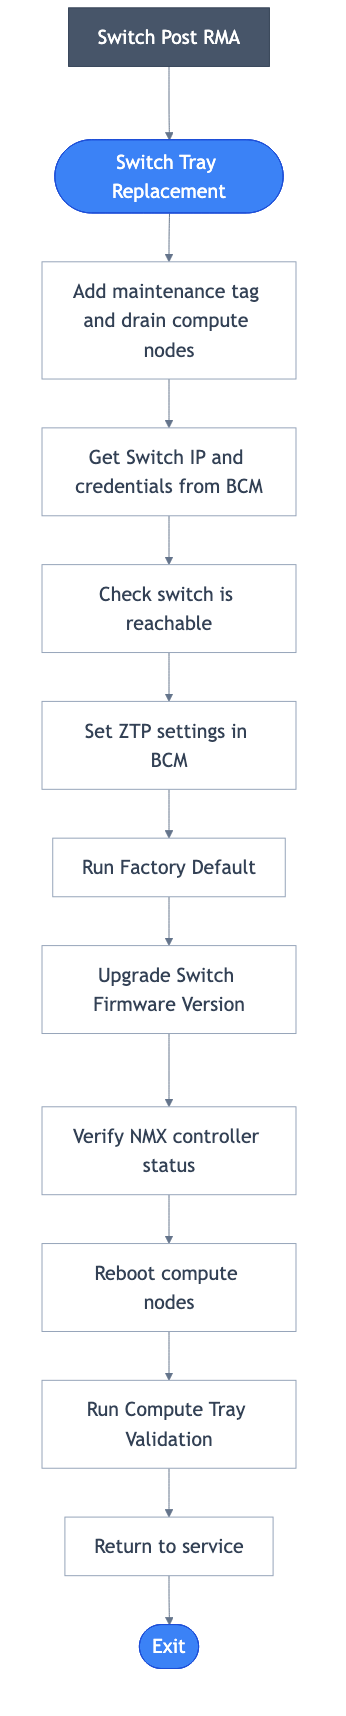
Figure: Switch Post RMA Workflow - This diagram illustrates the comprehensive switch replacement process following RMA procedures. The workflow begins with mandatory BCM inventory updates to register new MAC addresses, followed by switch connectivity verification and secure credential establishment. The process continues through factory reset and Zero Touch Provisioning for clean initialization, and firmware updates to match required versions. The workflow concludes with comprehensive system validation including NMX controller verification, rebooting the compute nodes, and thorough compute tray validation to ensure the replaced switch integrates seamlessly with the existing infrastructure.
Key Features#
Physical Replacement Procedures: Detailed instructions for safe switch tray removal and installation with proper cooling and power management
Compute Node Management: Adds maintenance tags and drains compute nodes during switch replacement to prevent workload interference
Switch Connectivity Verification: Establishes and verifies SSH connectivity to replaced switch components
Factory Reset and ZTP: Performs factory reset and monitors Zero Touch Provisioning for clean initialization
Firmware Updates: Updates switch firmware to the version in the specified package directory using the golden configuration JSON for validation
System Validation: Comprehensive testing including NMX controller verification, compute node reboots, and compute tray validation
Switch Post RMA Workflow Components#
The Switch Post RMA workflow consists of several key steps that ensure replaced switch hardware is properly configured and validated:
Physical Replacement Procedures#
Switch Tray Removal: Detailed instructions for powering down the entire rack, cooling procedures, cable disconnection, and safe tray removal
Switch Tray Installation: Comprehensive installation guide covering rail migration, tray insertion, cable reconnection, and power-on sequence
Compute Node Management#
Adds maintenance tags to all compute nodes in the affected rack
Drains compute nodes from Slurm to prevent workload interference during switch replacement
BCM Inventory Update#
ONLY REQUIRED FOR NEW HARDWARE: Updates BCM inventory information using BREAKFIX_POST_RMA_UPDATE_SWITCH_BCM_INVENTORY when a new switch is installed
Skip this step for repaired switches as MAC addresses remain unchanged
Ensures BMC MAC and COMe MAC addresses are correctly registered in BCM (new MAC addresses are provided by the Enterprise Support team who manage asset inventory for customer deployments)
Enables proper management and monitoring of the replaced switch hardware
Switch Connectivity and Configuration#
Retrieves switch IP and credentials from BCM
Verifies SSH connectivity to the switch node
Updates ZTP settings in BCM with NVOS image file configuration
Ensures the switch is reachable for configuration operations
Factory Reset and ZTP#
Performs factory default reset on the switch
Monitors Zero Touch Provisioning (ZTP) status until successful completion
Creates support tickets if ZTP fails and exits workflow (if opted in to support ticket service)
Switch BMC Credential Management#
Retrieves BMC credentials for NVSwitches from BCM
Establishes secure access to switch components for diagnostics
Collects system rack serial numbers for identification
Firmware Updates#
Upgrades switch firmware to the version in the specified package directory (SWITCH_FWPKG_DIR_PATH) using the golden configuration JSON (FW_SOURCE_JSON_PATH) for validation
Verifies switch connectivity after firmware updates
System Health and Validation#
Performs switch tray health checks
Verifies NMX-C and NMX-T controller status on the active switch node
Reboots all compute nodes in the rack to ensure proper connectivity
Waits for agent connectivity to confirm successful recovery
Validates there are no inactive NVLinks
Runs comprehensive compute tray validation using BREAKFIX_COMPUTE_TRAY_VALIDATION
Running the Switch Post RMA Workflow#
Step 1: Update Switch BCM Inventory (ONLY FOR NEW HARDWARE)#
Note: This step is ONLY required when installing a new switch. Skip this step for repaired switches as MAC addresses remain unchanged.
For new hardware replacement, update the BCM inventory with new MAC addresses:
Navigate to the “BREAKFIX_POST_RMA_UPDATE_SWITCH_BCM_INVENTORY” runbook in the Runbooks section
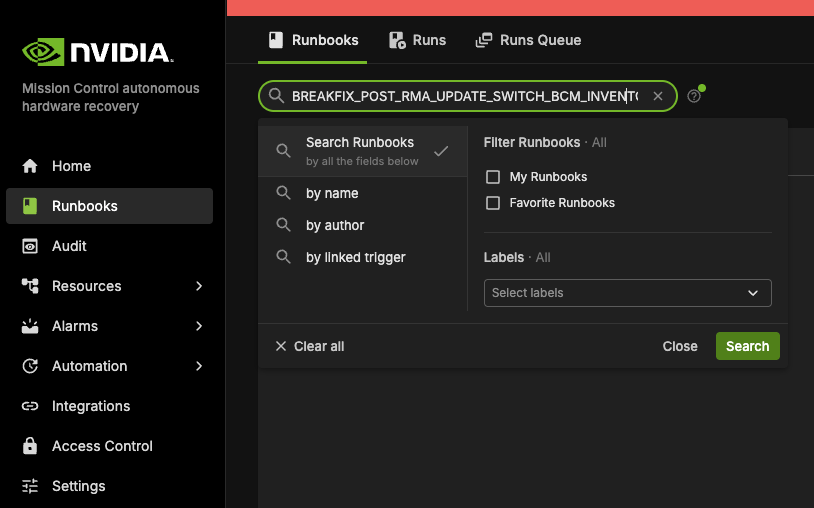
Configure the required parameters (MAC addresses are provided by the Enterprise Support team):
SWITCH_HOSTNAME: The hostname of the replaced switch component
BMC_MAC: BMC MAC Address from Asset File
COMe_MAC_1: COMe MAC 1 Address From Asset File
COMe_MAC_2: COMe MAC 2 Address From Asset File
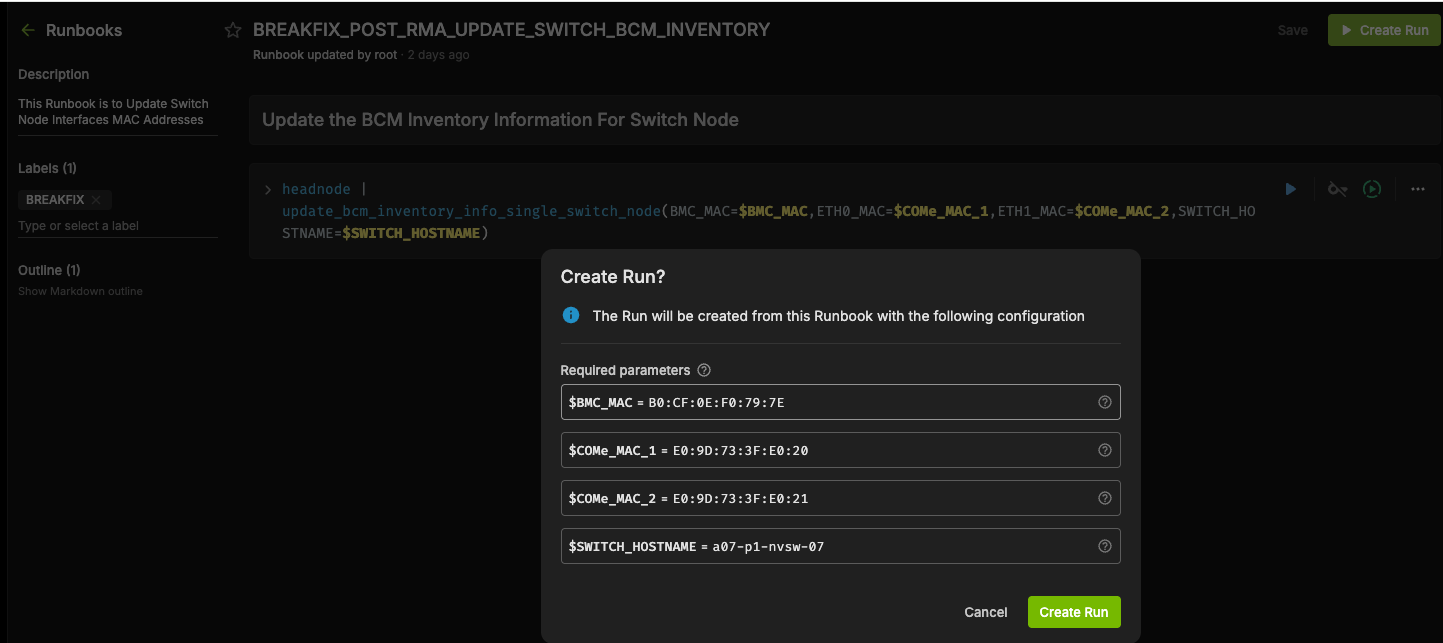
Select “Create Run” to initiate the BCM inventory update
Monitor the execution progress to ensure successful completion
Step 2: Execute Main Switch Post RMA Workflow#
After successfully updating the BCM inventory, proceed with the main Switch Post RMA workflow:
Navigate to the “BREAKFIX_SWITCH_POST_RMA” runbook in the Runbooks section
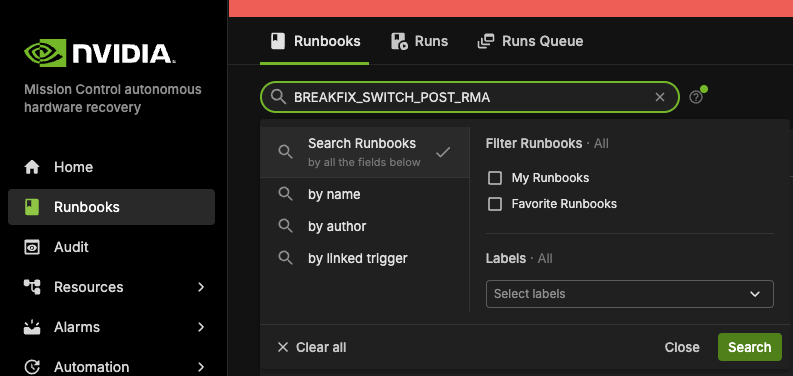
Configure the required parameters:
SWITCH_HOST_NAME (required): Input replaced switch host name.
resource_tag (required): Tag for the resource query (use
rack_namefor rack filtering).resource_value (required): Value for the resource query; set to the rack scope (e.g., A01, or use regex/list format as supported by flex query).
SWITCH_FWPKG_DIR_PATH (required): Full path to the directory containing all firmware packages for the switch node.
NVOS_IMAGE_FILE_NAME (required): Latest NVOS image file name from the headnode under the path
/cm/local/apps/cmd/etc/htdocs/switch/image. If the latest image is not found, copy the image file to this path and provide the file name.FW_SOURCE_JSON_PATH (required): Path to the golden configuration JSON that defines the reference settings used for validation.
IGNORE_LIST (optional): List of nodes to exclude from scope (e.g., node01, or
none).MESSAGE (optional): Message for support ticket creation if ZTP fails (default: AHR_BREAKFIX_NVSwitch_POST_RMA).
Configure the required secrets (if not already configured): AHR_API_ENDPOINT and AHR_TOKEN (used for agent connectivity checks and compute tray validation). Add or update them under Settings → Secrets in the Shoreline UI.
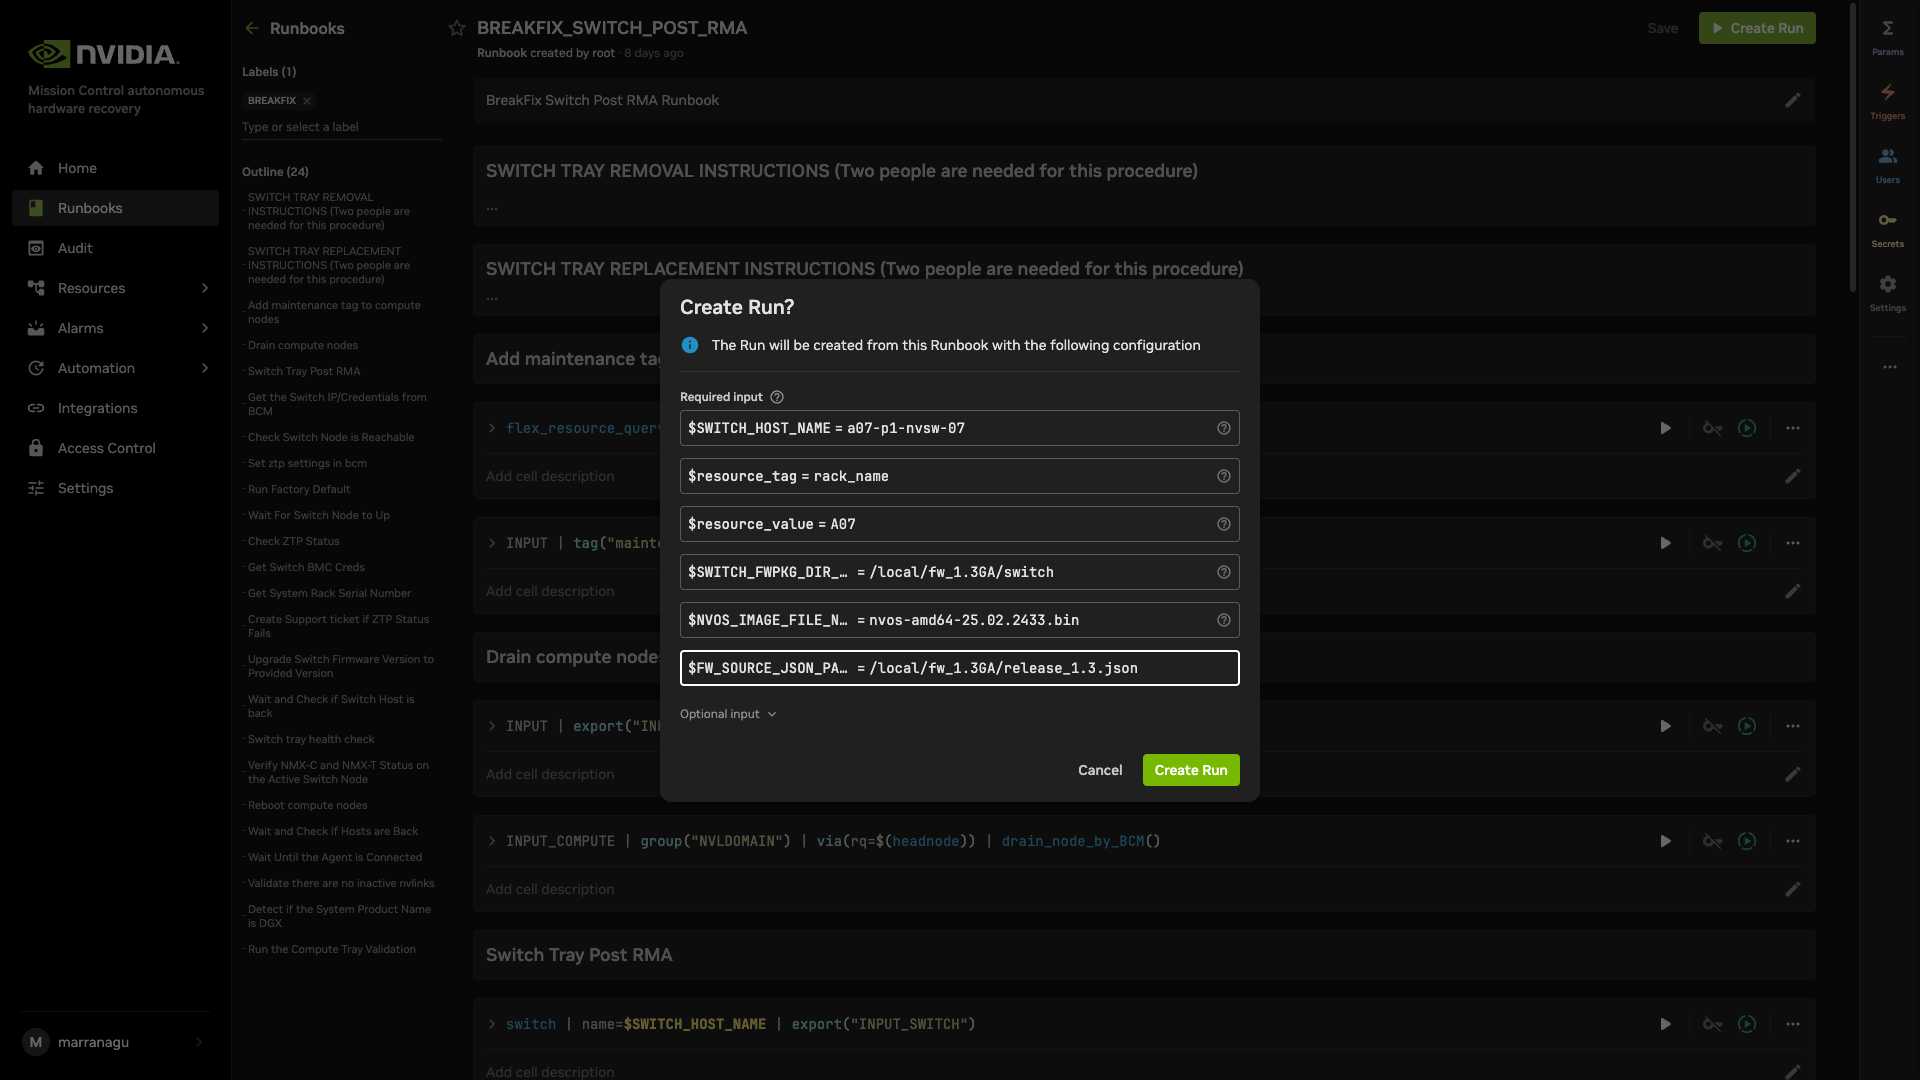
Select “Create Run” to initiate the workflow
Monitor the execution progress and results
GB200#
Automated Baseline Testing with NVIDIA Mission Control autonomous hardware recovery#
Introduction#
The NVIDIA Mission Control autonomous hardware recovery portal enables efficient automation of baseline testing procedures. This comprehensive testing framework can be flexibly executed across various scales of infrastructure, from individual compute nodes to complete racks or multiple rack configurations. The system performs extensive validation of critical compute node components, including CPU/GPU/Memory/storage functionality, network connectivity, and firmware versioning. Additionally, it incorporates industry-standard performance benchmarking tools such as HPL, NCCL, and Nemotron(Large Language Model) to assess system capabilities. This streamlined approach significantly enhances both testing efficiency and thoroughness while reducing execution time.
Entrypoint of Automated Testing#
A centralized automated baseline testing interface has been established to facilitate streamlined test execution and management. This unified entry point provides comprehensive access to the testing framework, enabling efficient navigation and one click implementation of all testing procedures.
To access the baseline testing interface:
Access the NVIDIA Mission Control autonomous hardware recovery portal using your credentials and navigate to the Runbooks section.
Locate the “DGX_SUPERPOD_BASELINE_TESTING” runbook through the search functionality (reference the interface depicted following)
Upon selecting the “DGX_SUPERPOD_BASELINE_TESTING” runbook, you will be presented with the interface shown below. The subsequent sections of this documentation will provide detailed guidance on executing various testing procedures.
Run SRT (Single Rack Testing) Job#
Guide to Initiating Baseline Testing Procedures for Single Rack Configuration when one or multiple racks are ready for testing.
Navigate to the “DGX_SUPERPOD_BASELINE_TESTING” runbook utilizing the previously outlined navigation protocol.
Ensure the “DGX_SUPERPOD_BASELINE_TESTING_SRT” component is activated by toggling its switch control. This control is located on the right side of its immediate group of interface icons. The switch indicator in its default deactivated state should be visually distinct from the activated state. Note: When activated, the switch indicator displays as a green circle with a play icon.
Verify that the “DGX_SUPERPOD_BASELINE_TESTING_MRT” component is in its deactivated state. This deactivated state is indicated by its corresponding switch control displaying as a grey circular icon containing a muted play symbol, signifying it is ‘Off’.
Select the “Save” button positioned in the top right corner of the interface to preserve your settings.
Upon successful completion of these preliminary steps, your runbook configuration should reflect the specified parameters as illustrated below.
To initiate a run, select the Create Run button located at the top right corner of the interface. A new window will appear as shown below. For detailed information about each parameter, simply hover over the info icon beside it.
You are required to provide the following inputs for the runbook
Resource filtering (flex query): Runbooks use a flexible resource query instead of hardcoding a single rack. You specify:
resource_tag (required): Tag for the flex resource query. Use
rack_namefor rack-based filtering (e.g., to run on a specific rack or set of racks).resource_value (required): Value for the flex resource query. Set to the same value you would have used for the rack name (e.g., B05, A01, m06|m07 for multiple racks), or use “none” if you do not want to filter by that tag. This allows you to target any resource—not just a single hardcoded rack.
FW_SOURCE_JSON_PATHSpecify the file path to the golden configuration JSON file included in the firmware package. This file defines the reference settings used for validation. If the file is not available, set this parameter to NA.IGNORE_LISTProvide a list of nodes to exclude from the test only if required. Leave the value as “none” if no nodes need to be ignored. This parameter supports regular expressions. Here are some examples:Single node: node01
List format: [“node01”, “node02”]
Pipe-delimited string: node01|node02
After entering the correct resource_tag and resource_value (e.g., resource_tag=rack_name, resource_value=m06 or m06|m07), select the “Create Run” button to initiate the process. A confirmation dialog will appear with a “View Run” link illustrated below. Selecting this link will redirect you to a new page displaying comprehensive job status and details. For additional information regarding job monitoring and results, please refer to the “Check Job Status and Result” section of this documentation.
IMPORTANT NOTES:
How to get the value for resource_value (e.g. rack_name):
Be noted the value (e.g. rack_name) is generated and captured automatically from BCM Inventory. below are the steps to get the value
Access the NVIDIA Mission Control autonomous hardware recovery portal using your credentials and navigate to the Runbooks section.
Click the button at right top “New Runbook” then you will see below.
In the central page, click “Op Statement” to create your first cell to query the resource
Type “host” in the cell as your first query and press Enter so then you can see all the host information as below example.
You will be able to see the value for the chosen tag (e.g. “rack_name”). In case it’s not show up, click “Show Panel” and type the tag name (e.g. “rack_name”) in Search and ensure it’s selected.
Predefined the timeout for SRT is 4 hours. You can adjust based on your requirements.
Run MRT (Multi Rack Testing) Job#
Guide to Initiating Baseline Testing Procedures for Multi-Rack Configuration.
Navigate to the “DGX_SUPERPOD_BASELINE_TESTING” runbook utilizing the previously outlined navigation protocol.
Ensure the “DGX_SUPERPOD_BASELINE_TESTING_MRT” component is activated by toggling the switch control. This control is located on the right side of its immediate group of interface icons. The switch indicator in its default deactivated state should be visually distinct from the activated state. Note: When activated, the switch indicator displays as a green circle with a play icon.
Verify that the “DGX_SUPERPOD_BASELINE_TESTING_SRT” component is in its deactivated state. This deactivated state is indicated by its corresponding switch control displaying as a grey circular icon containing a muted play symbol, signifying it is ‘Off’.
Select the “Save” button positioned in the top right corner of the interface to preserve your settings.
Upon successful completion of these preliminary steps, your runbook configuration should reflect the specified parameters as illustrated below.
Select the “Create Run” button positioned in the top right corner of the interface, the new window will pop out as illustrated below.
The identifier represents the resource filter. For rack-based runs, use resource_tag=rack_name and resource_value set to the rack designation. The system accommodates both single and multiple rack configurations, as detailed below:
Single Rack Format:
Standard notation: resource_value (Example: m06)
Multiple Rack Format:
Standard notation: resource_value|resource_value (Example: m06|m07)
Critical: No spaces are permitted between rack identifiers and the delimiter (|)
After entering the correct resource_tag and resource_value, select the “Create Run” button to initiate the process. A confirmation dialog will appear with a “View Run” link illustrated below. Selecting this link will redirect you to a new page displaying comprehensive job status and details. For additional information regarding job monitoring and results, please refer to the “Check Job Status and Result” section of this documentation.
IMPORTANT NOTES:
how to get the value for resource_value (e.g. rack_name):
Be noted the value (e.g. rack_name) is generated and captured automatically from BCM Inventory. below are the steps to get the value
Access the NVIDIA Mission Control autonomous hardware recovery portal using your credentials and navigate to the Runbooks section.
Click the button at right top “New Runbook” then you will see below.
In the central page, click “Op Statement” to create your first cell to query the resource
Type “host” in the cell as your first query and press Enter so then you can see all the host information as in the below example.
You will be able to see the value for the chosen tag (e.g. “rack_name”). In case it’s not showing up, click “Show Panel” and type the tag name (e.g. “rack_name”) in Search and ensure it’s selected.
Predefined the timeout for SRT is 4 hours. You can adjust based on your requirements.
Runbook Configurations#
Before you initiate real jobs, we’d like to provide you with a guide on how to check the Runbook Configurations.
Select “Runbook” from the left navigation panel, then use the search field on the right side of the page to find your runbook by name, as shown in the illustration below.
Below is the list of all mission control related runbooks including its name and description.
Category |
Runbook Name |
Description |
|---|---|---|
DGX_SUPERPOD_BASELINE_TESTING |
EntryPoint Runbook |
|
SRT |
DGX_SUPERPOD_BASELINE_TESTING_SRT |
EntryPoint Runbook of SRT |
SRT1 |
EntryPoint Runbook of all single node health checks |
|
SINGLENODE_HEALTHCHECK_GPU_CPU |
Baseline health checks for GPU and CPU |
|
SINGLENODE_HEALTHCHECK_MEMORY_STORAGE |
Baseline health checks for Memory and Storage |
|
SINGLENODE_HEALTHCHECK_NETWORK |
Baseline health checks for Network |
|
SINGLENODE_HEALTHCHECK_SOFTWARE |
Baseline health checks for installed software |
|
SINGLENODE_HEALTHCHECK_FIRMWARE |
Baseline health checks for firmware |
|
SRT2 |
EntryPoint Runbook of component testing |
|
SR_MEMORY_BENCHPRESS |
Benchmark testing for memory |
|
SR_CUDA_SAMPLES |
Benchmark testing for CUDA |
|
SR_P2P_IPERF |
Benchmark testing for pairwise ethernet interfaces |
|
HPL_TEST_SINGLE_NODE |
HPL testing on single node separately |
|
HPL_TEST |
HPL testing on the single rack |
|
SR_NVBANDWIDTH |
Bandwidth testing running in single nvldomain |
|
NCCL_TEST |
NCCL testing on the single rack |
|
SRT3 |
EntryPoint Runbook of burn-in performance testing |
|
HPL_TEST_BURN_IN |
HPL testing on the single rack with long duration |
|
MRT |
DGX_SUPERPOD_BASELINE_TESTING_MRT |
EntryPoint Runbook of MRT |
MRT1 |
EntryPoint Runbook of rack level connectivity testing |
|
MR_INFINIBAND_CHECK |
InfiniBand connectivity check |
|
MRT2 |
EntryPoint Runbook of multi-rack performance testing |
|
MR_HPL_TEST |
HPL testing cross multiple racks |
|
MR_NCCL_TEST |
NCCL testing cross multiple racks |
|
MR_HPL_TEST_BURN_IN |
HPL testing cross multiple racks with long duration |
|
MR_NCCL_TEST_BURN_IN |
NCCL testing cross multiple racks with long duration |
|
MRT3 |
EntryPoint Runbook of cluster level testing |
|
Nemotron_15B |
LLM testing with mocked data |
Runbook Interface Guide#
When accessing the runbook as shown in the example below, please note these important configuration elements:
Central Workspace#
The main content area displays your resource queries, commands, scripts, or nested runbooks.
Each row represents an individual cell
Each cell includes a play button for isolated execution
Toggle switches allow you to enable/disable specific cells
Configuration Panel (Right Side)#
The right panel contains several critical configuration sections:
Parameters Contains all required inputs for runbook execution
Triggers Configure automated execution methods:
Alarm triggers
Time Trigger (cron jobs)
Other integrations like AlertManager
Users Manage permissions for who may run or edit the runbook
Settings General runbook configuration options
… more runbook operations including:
Clone functionality
Export options
Delete runbook
etc.
Check Job Status and Result#
Once you’ve initiated the SRT or MRT using the steps above, there are 2 options to check the job status and results:
Click “View Run” right after you “Created the Run” in above sections to redirect you to another page
Navigate to the “Runbook” section in the left panel, then click the “Run” button located in the upper left corner of the page as shown below. Important: Make sure you’ve selected the correct range in the upper right corner before proceeding.
Note: Runbooks can be nested within other runbooks. When this occurs, you may see a “Execution succeeded - View Run” link after a cell completes. Clicking this link will redirect you to a detailed results page for the nested runbook execution.
In the following part of this section, we will walk you through the topics below.
Check Job status - Whether the job is Running, Completed, Aborted, Terminated or Timed out.
Check Job results - if the job passed or failed, along with detailed logs
Check Job Status#
At the top of each job execution, you will observe one of the following status indicators:
Status Types and Definitions#
Running The job is currently executing. Progress is displayed as a percentage based on completed cells.
Completed The job has finished execution. Note that completion status does not guarantee successful results. Please review the detailed output in the results section.
Aborted The job terminated prematurely due to execution errors, such as cell syntax issues.
Terminated The job was forcibly ended by the system.
Timed Out The job exceeded its maximum allowed execution duration (default timeout is 1 hour for runbook, 1 minute for action)
Canceled The job was manually terminated by a user.
Check Job Results#
When the job status displays “Completed,” you may proceed to review the job results. If the job status shows otherwise, you may click into the job for more details and troubleshooting.
Cell Structure Overview#
Each cell in the runbook contains three primary components:
Main Content Area: This section displays the executed script or command. On the right side of the cell, you’ll find several control icons. While most icons were detailed in the previous section, the “fx” icon is particularly valuable as it displays all parameters along with input/output values for the specific cell when hovering over it.
Execution Information Bar: Located in the middle of the cell, this light grey text line indicates the execution start time and duration of the operation.
Results Section: The bottom portion displays:
Exit code status
Execution location information
Complete command output (accessible by clicking the “Output” column contents)
Additional Features:
Configure output display preferences
Toggle the density
Download results in various formats using the download options menu
Streamlined Error Navigation: When a job contains numerous cells, manually checking for failures becomes inefficient. Use the “Error outline” feature in the middle panel to quickly locate problematic cells. Simply click any item in this list to automatically navigate to the corresponding failed cell.
Notes: there are reports available for the major runbooks. Details can be found “Reports of Testings”
Handling Job Failures#
In the event of job or cell execution failures, the following remediation options are available:
Major Issue Resolution: Upon resolution of critical infrastructure issues (e.g., hardware replacement), a complete re-initialization of the SRT or MRT job is recommended.
Targeted Component Resolution: When specific components have been updated (e.g., firmware version upgrades), execute the relevant job or runbook within the existing session by selecting the “Run” button located in the upper-right interface section. This maintains all previously established parameters.
Individual Cell Correction: For isolated cell failures that have been addressed, execute the specific cell independently by activating the execution control (play button) positioned on the right margin of the cell interface. Note: This option might cause the difficulty to locate the job/run from the reports panel (Please refer Reports of Testing section below).
Firmware checks#
NVIDIA Mission Control autonomous hardware recovery includes firmware checks that extract the current firmware versions of the trays and switches, and compare them with the expected versions specified in the Source of Truth (SOT) file. The SOT file includes the expected versions for all components such as OS, HMC, ConnectX, etc., and is prepopulated. The SOT file can be obtained from the NVIS team.
The runbook extracts the expected versions of all firmware components and compares the current versions against them. If any execution of the firmware validation runbook results in versions not found, please re-run the runbook.
Updating the SOT file#
Place the SOT JSON file on the headnode and provide the complete file path as the input FW_SOURCE_JSON_PATH to the DGX_SUPERPOD_BASELINE_TESTING runbook. To update the file, simply replace it with the new file and update the path in the input parameter of the runbook accordingly.
Thresholds and Defaults#
The thresholds and default values for various tests are defined in the Golden Config File. The runbook picks the appropriate values, and compares it against the values on the nodes. This includes defaults such as number of GPUs and expected benchmarks for benchmarking tests (such as SRT2).
Golden Config File#
The Golden Config File (referred to as the defaults.env file on the trays and control nodes) contains the expected values for all benchmark thresholds, and other relevant settings. This file is distributed across all trays and loaded as environment variables, making its contents available during testing.
Updating the Golden Config File#
To update the golden config values, edit config/<CHIP>/defaults.yaml (for example, config/B200/defaults.yaml or config/GB200/defaults.yaml). The chip-specific env files are generated automatically from these YAML files during deployment — do not edit the generated files under Shoreline_files/generated/ directly.
Once the changes are made and saved, use the NVIDIA Mission Control autonomous hardware recovery Runbook Deployment section (from the NVIDIA Mission Control AHR installation documentation) to apply them via OpenTofu. This process will create a File object on NVIDIA Mission Control autonomous hardware recovery, which pushes the updated file automatically to all control and compute trays. Various tests, including firmware checks, prolog, and epilog checks, source the defaults.env file and utilize the expected values, now available as environment variables.
Reports of Testings#
NVIDIA Mission Control autonomous hardware recovery provides reports for baseline testing, reflecting the status of nodes (compute and switches) at each test stage. These reports help identify and troubleshoot root causes.
To access the NVIDIA Mission Control autonomous hardware recovery reports, click on Resources in the side menu, then select Reports.
The Landing page contains two tabs: Report Templates and Published Reports.
Report Templates provide templates for each stage of Baseline testing. These templates include bar graphs that display the PASS or FAIL status for different nodes during the tests. However, these templates are static and do not store any test data. This means that while you can view the templates, you cannot save or modify the test results within them.
To generate a report that records the test results along with timestamps, click Publish. This action will create a new report based on the template, which will capture the current status of the tests. The report will display PASS for tests that were successful and FAIL for those that did not pass, with each status reflecting the most up-to-date information. The report also includes links to additional reports at the top of the page. These links allow you to access the detailed results of the individual SRT and MRT tests that make up each stage, giving you a deeper insight into the performance and status of each test within the overall baseline testing process.
Note: Reports reflect updated information only after the SRT and MRT tests have been executed.
Guide to initiate Reporting for Baseline Testing#
Navigate to the “DGX_SUPERPOD_BASELINE_TESTING_REPORT” under the Report Templates.
Optional: While templates do not reflect the current status of the test suite, you can use it to view the current state before publishing the reports. Clicking the refresh button at the top of the report will load the current data.
Click on “Publish” to generate a timestamped instance of the template that can be easily viewed and shared. Additionally, it automatically publishes all linked reports at the top of the page, ensuring that all related data is included and accessible.
Retain the auto-generated name for the report which includes the timestamp or provide your own name.
Once the process starts, the published reports will begin generating in the background. This includes “DGX_SUPERPOD_BASELINE_TESTING_REPORTS” as well as all the SRT and MRT linked reports.
A pop-up notification will appear containing a hyperlink to access the published reports that are being currently generated.
When you publish the “DGX_SUPERPOD_BASELINE_TESTING_REPORTS”, it automatically triggers the publication of all “linked reports”, including the associated SRT and MRT reports, with the data captured at that given time.
All the reports will complete building in under a minute, and the “Linked Published Reports” will include the published reports for all the Linked Reports.
Navigating to Previously Published Reports#
Navigate to the Reports from the NVIDIA Mission Control autonomous hardware recovery Home Page
Click on “Published Reports”, and select the “DGX_SUPERPOD_BASELINE_TESTING_REPORT_timestamp” or any other report of interest.
You can also adjust the time range at the top of the screen to view reports generated within specific time frames. Options include viewing reports from the last 10 minutes, last 1 hour, or selecting a custom time range to explore older data beyond these periods.
Breakdown of a Published Report#
DGX_SUPERPOD_BASELINE_TESTING_REPORT#
“DGX_SUPERPOD_BASELINE_TESTING_REPORT”, is the entry point for the Baseline Testing reports. It provides a comprehensive overview of all the SRT/MRT tests for the compute nodes.
Each stage is represented by a separate cell, displaying the results for that specific SRT or MRT test.
To perform a deeper analysis or understand the tests in each stage, click on the relevant report listed under “Linked Published Reports” at the top of the page.
Similarly, all the reports for each stage are available. You can either find the report of interest from Published Reports, or traverse it from the parent report (DGX_SUPERPOD_BASELINE_TESTING_REPORT_<timestamp> )
Understanding the Published Reports#
The reports align up with the SRT and MRT tests. Each cell in “DGX_SUPERPOD_BASELINE_TESTING_REPORT” represents a specific testing stage such as SRT1, SRT2 etc. Within each of these “Linked Reports”, the cells represent individual tests such as Singlenode Healthchecks, HPL, NCCL etc. The layout of the graph for each of the cells is organized as follows:
The Y-axis displays the Rack name, allowing you to quickly identify the location of each resource within the cluster.
The X-axis represents the number of trays within each rack.
For example, in the following visualization, each bar graph indicates the number of trays within a rack. In this case, there are 2 trays per rack, as denoted by the number displayed on the bars. This provides a clear view of the test progress for each tray across different racks. ** note: for NVL72, you will have 18 trays per rack in the report.
You can click on any bar in the graph to view a detailed list of the resources that passed or failed the tests within that specific bar. This allows you to drill down and see the test results for each tray in a particular rack or test stage.
Alternatively, you can click on the legend to filter and display all the passed or failed resources across the entire cluster, providing a comprehensive view of the overall test status.
Root Cause Analysis#
The report for each stage shows the trays that have passed and failed the test. To understand the actual issue and access the logs, you can follow these steps:
Navigate to the report with PASS/FAIL values that you are interested to conduct an RCA. In this example, lets consider SRT1 report where there are a few failed tests for SINGLENODE_HEALTHCHECK_GPU_CPU.
Navigate to the report corresponding to SINGLENODE_HEALTHCHECK_GPU_CPU and scroll to the tests that are failing.
In this example, GPU VBIOS Version has failed for all the trays. Click on the bar for one of the racks to list the resources that the test failed on.
Click on the status (FAIL) which directly links you to the runbook where these tests failed. You can also do the same for tests that passed by clicking on the PASS status.
The errors in the runbook are outlined to the left of the screen. Navigate to the test that we are debugging (VBIOS). Alternatively, you can also scroll through the run to find the failed tests.
Click on the “Command filter excluded x/y resources” to get detailed output for each resource.
Click on the Output to view the detailed logs
Firmware Reports#
For Firmware Checks, NVIDIA Mission Control autonomous hardware recovery offers a tabular report detailing the status of each node. The report includes:
Pass/Fail Status: Indicates whether the firmware check for each node passed or failed.
Expected Version: Shows the firmware version that was expected for the node.
Current Version: Displays the actual firmware version currently installed on the node.
Navigating to Tabular Report for Firmware Checks#
You can access the SINGLENODE_HEALTHCHECK_FIRMWARE_<timestamp> report either through the Runs (Check Job Status and Result) section or by navigating to the Runs History (see Root Cause Analysis).
Scroll to the last cell of the execution and click on the output of the cell.
You can scroll horizontally and vertically to view the complete output. Additionally, you have the option to download the cell output for further analysis.
You can also navigate to the Reports section and view the tabular output by clicking on the status bar. This includes both the expected firmware version and the current firmware version.
Resource Dashboard#
NVIDIA Mission Control autonomous hardware recovery dashboard provides a comprehensive view of the status of all resources in the cluster, displaying the progress of testing at various stages for each node (control, compute and switch nodes). It shows which tests are completed, which ones have passed, and which have failed. This allows users to easily track the overall health and status of the cluster, identify any issues, and assess the readiness of each resource.
Navigating to the Resource Dashboard#
Visit the NVIDIA Mission Control autonomous hardware recovery homepage, navigate to the ‘Resources’ menu, and click on ‘Dashboards’ to access the dashboard page.
The Landing page contains two tabs: Dashboards and Dashboard Views.
The Dashboards lists all the Dashboards available. All these dashboards reflect the current status of the cluster and the test status.
A Dashboard View is a snapshot of the Dashboard that captures the data at a specific point in time. This snapshot remains static, preserving the exact state and data of the Dashboard as it appeared at that moment, regardless of any future changes or updates to the live data.
DGX_SUPERPOD_BASELINE_TESTING_DASHBOARD#
The DGX_SUPERPOD_BASELINE_TESTING_DASHBOARD provides a detailed view of the cluster’s resources and the status of the baseline tests. Specifically, it tracks the progress of two key testing phases for each resource: SRT and MRT.
Resource Status: The dashboard displays all resources within the cluster, such as compute nodes, control nodes, and switch nodes, along with their associated status.
Hostname & Rack Information: For each resource, you will see the hostname and rack name, along with a Tag sequence that indicates the stage of both the SRT and MRT tests.
Test Stage Progress: The rows in the dashboard reflect the current status of each test stage. Each stage (SRT and MRT) has a corresponding tag name that visually represents its test progress, showing whether the stage has been successfully completed, is in progress, or has failed.
Snapshot of Cluster Health: The dashboard offers a comprehensive snapshot of the cluster’s readiness. It allows users to identify potential issues early, track the completion status of tests, and quickly assess which resources are ready and which ones may require attention.
The dashboard allows you to sort the resources by Name, Rack, or Progress Bar, making it easier to organize and view the status of your cluster based on your preferred criteria.
Name: Sort resources alphabetically by their hostname for quick access.
Rack: Sort resources based on their rack assignment, ideal for organizing by physical location.
Progress Bar: Sort by test progress to focus on resources at different stages of testing or to identify incomplete tasks.
Creating a View / Snapshot#
To create a snapshot of the dashboard, follow these steps.
Click on the “Create View” button located at the top right corner of your screen.
Retain the auto-generated name for the dashboard which includes the timestamp or provide your own name.
Once the Dashboard View is created, a pop-up notification will appear with a hyperlink to access the Dashboard View.
The Dashboard View created can be downloaded as a CSV to further manipulate the data to generate reports.
Automated Health Checks with NVIDIA Mission Control autonomous hardware recovery#
Introduction#
NVIDIA Mission Control autonomous hardware recovery provides a full suite of automated health checks to detect failures at the tray, rack, and system levels. In addition, system wide health checks are performed by integrating with the UFM and NMX-M network control planes. Health check data is reported back to BCM’s BaseView and/or the in-cluster LGTM stack. These health checks are performed at two layers: BCM job invocation, and as periodic health checks via NVIDIA Mission Control autonomous hardware recovery.
Alarms Dashboard#
The alarms dashboard is an overview of all alarms and the state of your system. In this view, alarms are summarized by counts of alarms firing, alarms firing most frequently, and a configurable list of most frequently firing, canceled, or resolved alarms. This is meant to be a starting point for any investigations of possible issues with your systems, and you may click any alarm for further details.
BCM Slurm Job Lifecycle Checks (Prolog and Epilog)#
When a Slurm job is submitted, the Autonomous Hardware Recovery Agent automatically runs a set of checks at the start and end of the job to validate node health and stability. These are known as Prolog and Epilog checks.
Prolog Checks (run before the job starts):
If a check fails, the node is marked as DRAIN, and the job is re-queued.
If it passes, the job proceeds normally.
Epilog Checks (run after the job finishes):
If a check fails, the node is also marked as DRAIN.
These scripts are automatically pushed to each node when the job runs, but they are not visible or configurable through the NVIDIA Autonomous Hardware Recovery UI. To review them, navigate to Shoreline_files/scripts/slurm in the NVIDIA Mission Control package.
Note: Prolog and Epilog checks are disabled by default and should only be enabled after the nodes are confirmed to be healthy. Use the following runbooks to manage them:
SLURM_CHECKS_ENABLE– enables the checksSLURM_CHECKS_DISABLE– disables the checks
Unlike the Prolog and Epilog checks, Periodic Checks are defined within the NVIDIA Mission Control autonomous hardware recovery interface as Alarms, and are detailed in the next section. They will be automatically enabled for racks that pass Single Rack Testing but may also be manually enabled or disabled for specific racks by running the “ALARMS_ENABLE” AND “ALARMS_DISABLE” runbooks.
Periodic Health Checks (Alarms)#
Periodic Checks are separate from Prolog and Epilog and run at regular intervals to monitor system health. These are managed as Alarms in the NVIDIA Autonomous Hardware Recovery UI.
Automatically enabled for racks that pass Single Rack Testing
Automatically disabled during firmware upgrade and Break/fix
Can be manually enabled or disabled at any time
The alarm_base is the Resource Query they run against. To control them manually, use the following runbooks:
ALARMS_ENABLE– enables periodic alarms for selected racks. Note that a node having themaintenancetag will override these settings.ALARMS_DISABLE– disables them
Periodic Checks are fully visible and configurable in the UI through the alarm section. The following is a list of the configured Alarms, grouped by their check interval:
Frequent Checks (5m)#
bmc_sensors#
Checks the sensors from the Baseboard Management Controller (BMC) to ensure the proper data is returned.
sysmem#
Checks that all expected memory DIMMs are present.
dns_host#
Checks the DNS configuration and resolution for the host.
eth_state#
Checks that the ConnectX devices are present, active, and in the physical LinkUp state via ibstat, and also matching the expected transfer rate
raid_count#
Checks that the raid configuration matches the expected mdstat configuration.
gpu_temp_history#
Checks System Event Log (SEL) history looking for GPU temperature issues.
gpu_alloc_temp#
Checks if the GPU temperatures are above a threshold.
periodic_bmc_host_checks#
The following groups of periodic functional checks are a subset of the BCM Prolog checks that run at predefined intervals as NVIDIA Mission Control autonomous hardware recovery Alarms.
check_bmc_ipmi_version - Checks BMC IPMI version against an expected value
check_nvidia_module_loaded - Verifies the NVIDIA module is loaded in the host OS
check_host_os_version - Verifies the DGX OS version matches the expected value
check_nvsm_status - Verify the NVSM service is currently active
periodic_cpu_mem_checks#
check_cpu_health - Verifies CPU sockets and cores are present and online
check_dimm_count - Checks that all expected memory DIMMs are present
check_dimm_size - Checks that the size of each memory DIMM matches the expected values
check_memory_swap_size - Checks that the memory swap size matches the expected value
periodic_gpu_nvlink_checks#
check_gpu_pci - Checks that all GPUs are present on the lspci interface and with the correct link width and speed
check_gpu_error - Checks GPUs for ECC errors, retired pages, and throttles present
check_gpu_powerstate - Checks the powerstate for each GPU and compares against an expected value
check_gpu_param - Checks that specified GPU parameters are present and correct for the host
check_nvlink_health - Checks that links are active for each GPU, the speed is correct, fabric registration has been completed, are running at full bandwidth, and belong to the same NVLink domain and partition.
check_gpu_topology - Checks that there are no issues with the p2p topology within the node
check_gpu_telemetry - Checks that various sensors can be successfully read from the GPU via nvidia-smi
check_gpu_power_limit - Checks that the power limit is correct for each GPU
check_nvidia_inforom_ver - Checks that the inforom version is correct for each GPU
check_gpu_clock_info - Checks that the maximum clock speed is correct for each GPU
check_remapped_row - Checks if any remapped row events have occurred
periodic_network_checks#
check_ib_ber_and_ro - Checks if the PCI_WR_ORDERING field is set to relaxed and also the bit error rate of the ConnectX using mlxlink
check_ib_port_rcv_errors - Check Infiniband devices port RCV errors
check_ib_cables - Checks the cable info using mlxcables
check_bf3_speed - Validates that the BlueField devices are operating at the correct speed and that the proper number of devices are in the “Up” state. This check will run, but never fail
periodic_storage_checks#
check_pex_switch_health - Checks that the PEX switches are present, have the correct PCIe link speed and width, and the downstream devices have enumerated to lspci
check_cx_config - Checks that the ConnectX devices have the correct PCIe link speed and width via lspci and ACS config via setpci
check_nvme_health - Checks that the PCIe link speed and width of each NMVe device matches the expected value
check_storage_dir - Checks that the host has functional access to the home storage
check_storage_util - Checks that the used local storage on the host is below a given threshold
periodic_error_checks#
Checks journald for machine check events, Xid, AER, CPER, I/O, GPU fell off the bus, and other generic errors.
Hourly Checks#
nfs_mounts#
Verifies required mount points.
daily_informational#
Checks for which the severity and remediation may not be critical. This alarm will only be triggered once per day, and results may be viewed in the resulting runbook run.
check_sel_event - Read the SEL events from the BMC and ensure none are asserted
check_dgx_os_version - Verifies the DGX OS version matches the expected value
check_gpu_vbios_ver - Checks the VBIOS version of the GPUs and compares against an expected value
check_nvme_fw_ver - Checks that the FW version for each NVMe matches an expected value
check_kernel_commandline_opt - Verifies the specified kernel option(s) is present in the current kernel’s boot parameters
check_host_bios_ver - Verifies the system’s BIOS version
check_kernel_ver - Verifies the current version of the Linux kernel
check_host_package_versions - Queries the installed packages on the host
nv_container_cli_info - Retrieves information about the NVIDIA container CLI (driver and devices)
Daily Checks#
cpu_stepping#
Checks that the CPU stepping parameter is correct for each CPU.
numa_node_count#
Checks that the correct count of Non-uniform memory access (NUMA) nodes are configured with the CPU cores.
NVIDIA Mission Control autonomous hardware recovery Alarm Configuration#
There are several components to an alarm, with the key pieces being the Resource Query, Fire Query, Resolve Query, Check Interval and Automation. An example configuration is shown in the following figure.
Resource Query#
The resource query allows you to customize the resources (hosts, pods, gpus) on which the checks will be performed. In the preceding example, the `hosts | rack_name =~ “.*”` will only check alarms on hosts which have a value set for the “rack_name” tag.
Fire Query#
The fire query is a condition that, when true, will cause the alarm to begin firing. It will be run at each interval.
Resolve Query#
Similar to the fire query, the Resolve query is a condition that will resolve the alarm when true. Resolving an alarm will cause firing to cease and the state to change to Resolved.
Check Interval#
The interval at which the fire and resolve queries are checked.
Automation#
You may use the Automation settings to have Runbooks triggered when an alarm fires, and you may also customize the informational messages that are displayed in the Alarm’s logs.
Alarm States#
If an Alarm has triggered, it will be in one of the following three states:
Triggered#
This state means the alarm is currently firing. Any automation (break/fix) will subsequently be invoked to remediate any issues, potentially resolving the alarm. Alternatively, the user could cancel the alarm by clicking the “Cancel alarm.”
Clicking into the triggering alarm will give you more details on what caused the alarm, metadata and resources relating to the alarm, and will also allow you to view log output from the check itself.
Resolved#
When the clear query of an alarm evaluates to true for a firing alarm, the status will be changed to Resolved. Automation triggered runbooks will invoke break/fix operations that should be configured to result in a resolved alarm.
Canceled#
When a user cancels an alarm from the dashboard, or from the triggered alarm itself, its state will become Canceled. Also, if an alarm configuration is changed for an alarm in the Triggered state, it will be canceled since it was triggered against a defunct configuration.
Firmware Upgrades with NVIDIA Mission Control autonomous hardware recovery#
Overview#
NVIDIA Mission Control autonomous hardware recovery provides functionality for upgrading, cycling, and verifying firmware and the corresponding OS within your GB200 racks. The four distinct components for which firmware can be upgraded using this process are:
Compute trays
Switches
Mellanox
NVOS
Asynchronous component workflows: Firmware upgrade workflows for different component types (compute tray, switch, Mellanox, and NVOS) run asynchronously; powershelf firmware upgrades are not included in asynchronous execution yet. You can schedule, run, and monitor each component workflow independently, and multiple firmware runs may be in progress for different components at the same time. The subsections below describe each workflow; use run history and Firmware Reports to track status across concurrent upgrades.
The workflow invocation is performed via autonomous hardware recovery’s Runbooks. To view all Firmware upgrade related runbooks, you may search by the FIRMWARE_UPGRADE label as shown below.
Using the filter will reduce the runbooks displayed to a list. In general, you will use these runbooks to upgrade the compute trays, switches, or switch NVOSes by following the steps in the next section.
Preparing the Upgrade#
In the firmware upgrade runbook, nvfwupd and nv action are used with the upgrade package file to determine the versions needing upgrade. You will need to obtain the firmware package and the the Source of Truth (SOT) JSON file, the latter of which defines the referenced settings used for validation.
The SOT JSON may be obtained from the NVIS team, whereas the firmware packages may be downloaded from the NVIDIA Application Hub.
Source of Truth Snippet (truncated)#
{
    "ProductName": "DGXGB200",
    "SOTUniqueID": "1",
    "SOTType": "Release",
    "Milestones": [
        {
            "TemplateVersion": "0.4",
            "Id": "272d4781-ed44-4579-b390-100aefcebcde",
            "Name": "1.0.00GA",
            "State": "Onboarded",
            "ReleaseDate": "2025-04-17T13:29:24.682615",
            "ReleaseCustomers": [],
            "Packages": [
                {
                    "Name": "GB200NVL72_Compute_Firmware",
                    "Type": "Tarball",
                    "Title": "Compute Firmware",
                    "Description": "Compute Firmware Package"
                },
                {
                    "Name": "GB200NVL72_Switch_Firmware",
                    "Type": "Tarball",
                    "Title": "Switch Tray Firmware",
                    "Description": "Switch Tray Firmware Package"
                },
                {
                    "Name": "GB200NVL72_drivers_cuda",
                    "Type": "Tarball",
                    "Title": "Drivers",
                    "Description": "Drivers Package"
                },
Ordering Constraints#
The runbooks used to perform upgrades automatically determine the ordering of applicable packages and will AUX cycle nodes when appropriate. The following paragraph describes this ordering, but is for informational purposes only, as there is no requirement for the user.
For the compute tray, much older firmware packages require the BMC to be upgraded prior to HMC, but this is no longer the case with modern firmware. Both BMC and HMC can be upgraded within a single AC cycle.
For the switch tray, the BMC firmware should be updated first. SBIOS and CPLD packages may be upgraded within the same AC cycle. Our runbooks take care of this ordering for you.
Coordination with other jobs#
To prevent other tasks from utilizing the nodes undergoing the upgrade process, AHR will do two things:
It will tag the nodes with a special
maintenancetag.Subsequently, it will drain the node via Slurm on BCM.
In particular, this will prevent other upgrade processes from interfering, and will also bypass AHR’s breakfix workflow. This tag will be automatically removed upon successful completion of the upgrade, and the node will be undrained. If there’s an issue during the upgrade process, this tag and drain state will remain for further investigation. At this point of failure, the user should review the failures, and return the nodes to undrained and remove the maintenance tag once the nodes are deemed healthy.
If you need to remove the maintenance tags after the firmware upgrade process encounters an issue, troubleshooting has completed, or even after unsuccessful breakfix triage, you may do so using the CLEAR_MAINTENANCE_TAGS runbook, specifying resource_tag (e.g. rack_name) and resource_value (e.g. B05) as parameters.
Performing the Upgrade#
Entry-point runbook: FIRMWARE_UPGRADE
The FIRMWARE_UPGRADE runbook is the single entry point for upgrading both compute and switch firmware (and optionally Mellanox/NVOS when the corresponding paths are provided). It performs resource scoping, maintenance tagging, drain, and then invokes the appropriate child runbooks: FIRMWARE_UPGRADE_COMPUTE when compute packages are specified, and FIRMWARE_UPGRADE_SWITCH when switch packages are specified. After upgrades, it runs AUX cycle (if enabled), undrains nodes, removes the maintenance tag, and runs firmware validation. Use this runbook for combined compute-and-switch upgrades or for compute-only or switch-only upgrades by setting only the relevant package path(s).
This section details the steps and parameters for each component. The runbooks take care of invoking the process, performing the upgrade, calling any ancillary runbooks, and ultimately performing validation of the upgraded component once complete.
Figure: Firmware Upgrade (high-level). Detailed flows: Compute Tray (fw_image01), Switch Tray (fw_image02), Switch NVOS (fw_image03), Mellanox (mellanox_fw_upgrade_flowchart).
Compute Tray#
Prerequisites#
Download the firmware upgrade packages.
Obtain the golden configuration JSON file from the NVIS team.
On the headnode, place the JSON and packages in a subdirectory of
/cm/shared/apps/autonomous-hardware-recovery/var/firmware/, which is accessible to theshorelineuser.Upgrade packages use the following naming convention:
nvfw_dgx*
nvfw_hgx*
Upgrading#
From the Runbooks view, select “Create Run” for the FIRMWARE_UPGRADE runbook (entry point for compute and switch). To upgrade compute firmware, provide the following parameters. The parent runbook invokes FIRMWARE_UPGRADE_COMPUTE when FWPKG_DIR_PATH_COMPUTE is set.
Required parameters:
resource_tag – Tag for flex resource query (use
rack_namefor rack filtering).resource_value – Value for flex resource query (e.g., rack name or regex: A01, m06|m07).
FW_SOURCE_JSON_PATH – Path to the golden configuration JSON file included in the firmware package. This file defines the reference settings used for validation. If the file is not available, set this parameter to NA.
FWPKG_DIR_PATH_COMPUTE – Directory containing the compute firmware upgrade packages (nvfw_DGX*, nvfw_HGX*). Set to empty if you are only upgrading switch.
Optional parameters (commonly used):
FWPKG_DIR_PATH_SWITCH – Directory of the switch firmware packages. Set if you also want to upgrade switch in the same run; leave empty for compute-only.
NVOS_FILE_PATH – Full path to the NVOS bin file (if upgrading switch NVOS).
FWPKG_CX_FILE_PATH – Full path to the ConnectX firmware package. Set this (and FWPKG_BF_FILE_PATH) if you also need to upgrade Mellanox (ConnectX/BlueField) in the same run as compute.
FWPKG_BF_FILE_PATH – Full path to the BlueField firmware package. Set this (and FWPKG_CX_FILE_PATH) if you also need to upgrade Mellanox in the same run as compute.
FORCE_UPGRADE – When set to true, forces the firmware upgrade to proceed regardless of version checks; false follows standard upgrade rules.
IGNORE_LIST – List of nodes to exclude from scope (e.g., node01, or “none”).
AUX_CYCLE – When true (default), performs an AUX power cycle after upgrade; set to false to skip.
When you need to upgrade compute and Mellanox together, run FIRMWARE_UPGRADE with FWPKG_DIR_PATH_COMPUTE set and FWPKG_CX_FILE_PATH and FWPKG_BF_FILE_PATH set to the ConnectX and BlueField package paths. When you need to upgrade only compute firmware, run FIRMWARE_UPGRADE with FWPKG_DIR_PATH_COMPUTE set and FWPKG_DIR_PATH_SWITCH left empty. For advanced scenarios you may run the BreakFix_Firmware_Upgrade_Compute_nvfwupd runbook directly (e.g., single rack).
Switch Tray#
Prerequisites#
Download the firmware upgrade packages.
Obtain the golden configuration JSON file from the NVIS team.
On the headnode, place the JSON and packages in a subdirectory of
/cm/shared/apps/autonomous-hardware-recovery/var/firmware/, which is accessible to theshorelineuser.Upgrade packages use the following naming convention:
*nvfw*_0004_*
*nvfw*_0006_*
*nvfw*_0007_*
Upgrading#
When performing this upgrade, it should be noted that all of the rack’s 18 nodes will be drained from the Slurm pool, tagged with our maintenance tag, and subsequently AUX cycled.
To begin, from the Runbooks view, select “Create Run” for the FIRMWARE_UPGRADE runbook (entry point). To upgrade switch firmware, set FWPKG_DIR_PATH_SWITCH (and optionally NVOS_FILE_PATH for NVOS). The parent runbook invokes FIRMWARE_UPGRADE_SWITCH when FWPKG_DIR_PATH_SWITCH is set. Provide the same resource_tag, resource_value, and FW_SOURCE_JSON_PATH as for compute.
Required parameters (when upgrading switch):
resource_tag – Tag for flex resource query (use
rack_namefor rack filtering).resource_value – Value for flex resource query (e.g., A01).
FW_SOURCE_JSON_PATH – Path to the golden configuration JSON file provided within the firmware package. If the file is not available, set this parameter to NA.
FWPKG_DIR_PATH_SWITCH – Directory of the switch firmware upgrade packages. Set to empty if you are only upgrading compute.
Optional: NVOS_FILE_PATH – Full path to the NVOS bin file if upgrading switch NVOS. FORCE_UPGRADE, AUX_CYCLE – same as for compute.
When you need to upgrade only switch firmware, run FIRMWARE_UPGRADE with FWPKG_DIR_PATH_SWITCH set and FWPKG_DIR_PATH_COMPUTE left empty. The FIRMWARE_UPGRADE_SWITCH child runbook is invoked by the parent and is not intended to be run directly. For advanced scenarios you may run the BreakFix_Switch_BMC_Upgrade_Nvfwupd runbook directly.
Switch NVOS#
Prerequisites#
Download the NVOS upgrade package bin file.
Obtain the golden configuration JSON file from the NVIS team.
On the headnode, place the JSON and packages in a subdirectory of
/cm/shared/apps/autonomous-hardware-recovery/var/firmware/, which is accessible to theshorelineuser.
Upgrading#
Use the FIRMWARE_UPGRADE runbook (entry point), same as for Switch Tray and Compute. To upgrade switch NVOS, set NVOS_FILE_PATH and optionally FWPKG_DIR_PATH_SWITCH (if also upgrading switch tray firmware). The parent runbook invokes FIRMWARE_UPGRADE_SWITCH, which performs both switch tray firmware and NVOS upgrade when NVOS_FILE_PATH is provided.
Required parameters:
resource_tag – Tag for flex resource query (use
rack_namefor rack filtering).resource_value – Value for flex resource query (e.g., A01).
FW_SOURCE_JSON_PATH – Path to the golden configuration JSON file provided within the firmware package. If the file is not available, set this parameter to NA.
NVOS_FILE_PATH – Full path to the NVOS bin file including the file itself.
Optional: FWPKG_DIR_PATH_SWITCH – Set if you are also upgrading switch tray firmware in the same run; leave empty if only upgrading NVOS.
Alternatively, run BreakFix_NVOS_Upgrade directly with resource_value, NVOS_FILE_PATH, FW_SOURCE_JSON_PATH, and INPUT_SWITCH (from flex query or parent context).
Mellanox#
Figure: Mellanox FW Upgrade (ConnectX and BlueField) — from BreakFix_Firmware_Upgrade_Mellanox runbook.
Prerequisites#
Download the BlueField and ConnectX upgrade packages.
Obtain the golden configuration JSON file from the NVIS team.
On the headnode, place the JSON and packages in a subdirectory of
/cm/shared/apps/autonomous-hardware-recovery/var/firmware/, which is accessible to theshorelineuser.
Upgrading#
Use the FIRMWARE_UPGRADE runbook (entry point), same as for Compute and Switch. To upgrade Mellanox (ConnectX and BlueField) firmware, set FWPKG_CX_FILE_PATH and FWPKG_BF_FILE_PATH; you can set FWPKG_DIR_PATH_COMPUTE to a directory (or leave empty if only Mellanox). The parent runbook invokes FIRMWARE_UPGRADE_COMPUTE, which performs ConnectX and BlueField firmware upgrade when these paths are provided.
Required parameters:
resource_tag – Tag for flex resource query (use
rack_namefor rack filtering).resource_value – Value for flex resource query (e.g., A01, or regex).
FW_SOURCE_JSON_PATH – Path to the golden configuration JSON file provided within the firmware package. If the file is not available, set this parameter to NA.
FWPKG_CX_FILE_PATH – Full path to the ConnectX firmware package file.
FWPKG_BF_FILE_PATH – Full path to the BlueField firmware package file (either .bin or .bfb package).
Optional: FWPKG_DIR_PATH_COMPUTE – Directory of compute firmware packages if you are also upgrading compute tray in the same run; leave empty for Mellanox-only.
Alternatively, run BreakFix_Firmware_Upgrade_Mellanox directly with FWPKG_CX_FILE_PATH, FWPKG_BF_FILE_PATH, FW_SOURCE_JSON_PATH, and INPUT_COMPUTE (from flex query or parent context).
BF Firmware Bundle Extraction Guide#
This guide explains how to extract a BF firmware package provided as a BF Bundle (.bfb).
Important:
These steps must be performed on the compute node, as it already has thebfb-toolutility installed.
Prerequisites#
Ensure the following dependency is installed:
sudo apt install -y qemu-user-static
Extracting the BF Bundle
Note: The --bfb argument must use the complete (absolute) path to the .bfb file.
Relative paths may cause the extraction to fail.
bfb-tool extract \
  --bfb /path/to/bf-fwbundle-<version>-prod.bfb \
  --opn 900-9D3B6-00CN-P_Ax
Using the Extracted Firmware
After extraction, go to the folder created in /tmp (named after the .bfb file). Inside this folder, open the subfolder corresponding to your OPN (e.g., 900-9D3B6-00CN-P_Ax). In that subfolder, locate the .bin firmware file, which should be used as the input to the runbook.
Powershelf#
GB200 supports firmware upgrades for power shelves (LiteOn and Delta). Use the FIRMWARE_UPGRADE_POWERSHELF runbook. It upgrades PMC (Power Management Controller) first, then PSU, and finally runs SINGLENODE_HEALTHCHECK_FIRMWARE_POWERSHELF for validation.
Prerequisites#
Obtain the PSU and PMC firmware packages and the golden configuration JSON file (from the NVIS team or firmware package).
On the headnode, place the JSON and packages in a subdirectory of
/cm/shared/apps/autonomous-hardware-recovery/var/firmware/, which is accessible to theshorelineuser.
Upgrading#
From the Runbooks view, select “Create Run” for the FIRMWARE_UPGRADE_POWERSHELF runbook. Required parameters (per runbook):
resource_tag – Tag for flex resource query (use rack_name for rack filtering).
resource_value – Value for flex resource query (e.g., A01, or regex).
IGNORE_LIST – List of nodes to ignore for baseline tests. Accepted formats: single node (e.g. node01), list (e.g. [“node01”, “node02”]), pipe-delimited (e.g. node01|node02), or “none” if no nodes should be ignored.
PSU_FILE_FULL_PATH – Full path to the directory and file name of the PSU firmware package.
PMC_FILE_FULL_PATH – Full path to the directory and file name of the PMC firmware package.
FW_SOURCE_JSON_PATH – Path to the golden configuration JSON file provided within the firmware package. This file defines the reference settings used for validation.
FORCE_UPGRADE – When set to true, forces the firmware upgrade to proceed regardless of version checks or validation; false follows standard upgrade rules.
The runbook invokes POWERSHELF_COMPONENT_UPGRADE for PMC first, then PSU, and finally SINGLENODE_HEALTHCHECK_FIRMWARE_POWERSHELF to verify the upgrade.
Figure: Powershelf Firmware Upgrade Workflow – This diagram illustrates the end-to-end Powershelf firmware upgrade process. FIRMWARE_UPGRADE_POWERSHELF obtains the target powershelves via flex query, then invokes POWERSHELF_COMPONENT_UPGRADE for PMC (Power Management Controller) first and PSU next, each with optional exit on failure. The workflow concludes with SINGLENODE_HEALTHCHECK_FIRMWARE_POWERSHELF to validate the upgrade against the golden configuration JSON.
Troubleshooting#
1. Excluding a node from upgrade or runbook cells#
To exclude a particular node, you can add a cell near the start of your runbook (after INPUT_SWITCH is exported) with something like the following:
INPUT_SWITCH | name != "<node_name>" | export(“INPUT_SWITCH")
This will export all the resources except <node_name> back into the INPUT_SWITCH variable.
Firmware upgrade includes a series of steps to ensure the nodes are removed from jobs being scheduled, complete the upgrade, and place the nodes back in service. Below are some common issues you may encounter during the firmware upgrade:
2. Nodes not reachable from headnode#
To upgrade firmware, the BMC IP must be accessible from the headnode. The runbook verifies node accessibility and automatically skips unreachable nodes.
Action: Ensure the node is online and accessible from the headnode, then rerun the firmware upgrade runbook.
3. Failed firmware upgrade#
The firmware upgrade failed to complete successfully. Possible causes include failures in the nvfwupd command, NV OS, or the flint command, depending on the package.
Action: Verify logs by clicking on the Output, which includes the command’s stdout and stderr.
Note that the runbook does not automatically undrain or untag maintenance when the firmware upgrade fails. After verifying that the failures are safe to ignore and the nodes are ready to return to the pool, undrain, and untag the nodes using the UNDRAIN_AND_UNTAG_RACKS runbook. Provide resource_tag (e.g. rack_name) and resource_value (e.g. B05 or m06|m07) when prompted.
4. SSH failures for Switch Upgrade runbooks.#
The switch firmware upgrade runs commands via SSH. The runbook dynamically retrieves the user and password from BCM using cmsh commands, which are then used to run the SSH commands.
Action: Verify SSH access to the switch from the headnode using the credentials stored in BCM.
5. Failed validation stage#
The last step in every firmware upgrade is validation. The runbook selects a subset of tests to verify upgrade success. Failures may result from upgrade issues, incorrect SOT JSON, or command failures when fetching component versions.
Action: Compare the expected and actual versions in the logs and check for any other errors.
Notes#
Netcat is used to check if nodes are back online after a reboot.
The runbook cannot exclude a subset of nodes. This means if any nodes are down, the runbook will ignore the node and upgrade others.
Multiple racks cannot be upgraded simultaneously.
If
nvfwupddoes not upgrade, (due to already being at the specific version, for example) and FORCE_UPGRADE is not specified as true, the runbook will exit after untagging frommaintenance.
Links#
Please see Firmware Reports for more information on Firmware related reports.
NVIDIA Mission Control autonomous hardware recovery Break/Fix Workflow#
Break/Fix Introduction#
NVIDIA Mission Control autonomous hardware recovery provides automated break/fix workflows to handle tray failures for GB200. These workflows execute a series of diagnostic steps to determine the cause of the failure and take necessary repair steps and create Support tickets for the issues that cannot be auto resolved.
The automated break/fix workflow is designed to efficiently diagnose and remediate issues, with clear paths for different failure scenarios and comprehensive validation to ensure systems are properly restored to service.
Figure: Compute Break/Fix Workflow (high-level) — Trigger, Triage, Validation, then Return to service or Run diag / Support ticket.
Figure: Compute Break/Fix Workflow (detailed) — Explains each phase: 1. Triage (connectivity check, SRAM UC check, leak detection, power cycle, GPU recovery), 2. Verification (BREAKFIX_COMPUTE_TRAY_VALIDATION, tests passed?), 3. Run diag (BREAKFIX_DIAG_DUMP, support ticket creation). All paths from triage converge on validation; failed validation leads to diagnostic dump and support ticket; success leads to return to service.
Key Features#
Automatic Detection: Identifies drained nodes without manual intervention
Intelligent Triage: Routes to appropriate diagnostic workflows based on failure symptoms
Comprehensive Diagnostics: Performs thorough hardware and software checks
Automated Remediation: Attempts to resolve issues without human intervention when possible
Detailed Reporting: Provides comprehensive logs for RMA or further troubleshooting
Entrypoint of Break/Fix Workflow#
A centralized automated break/fix interface has been established to facilitate streamlined diagnostics and remediation. This unified entry point provides comprehensive access to the break/fix framework, enabling efficient navigation and implementation of all remediation procedures.
To access the break/fix interface:
Access the NVIDIA Mission Control autonomous hardware recovery portal using your credentials and navigate to the Runbooks section.
Locate the “BREAKFIX_TRIGGER” runbook through the search functionality
Upon selecting the “BREAKFIX_TRIGGER” runbook, you will be presented with the interface showing the workflow for automated break/fix.
Run Break/Fix Workflow#
The BREAKFIX_TRIGGER is a time-triggered runbook that automatically runs every 5 minutes. When executed, it:
Gets drained nodes from BCM and proceeds only if the drain reason is one of the allowed reasons. Otherwise the runbook exits with no action.
Allowed drain reasons (runbook exits if no nodes have these reasons): Excluded by ARE, Prolog/Epilog error, Kill task failed, Duplicate jobid, Low RealMemory, Drained by CMDaemon, Test breakfix flow, or Not responding.
Processes one node per execution cycle from the drained node pool; applies a maintenance tag in AHR to prevent duplicate processing, and ensures drained nodes are handled sequentially across multiple runs.
Verifies the AHR agent is connected and accepts commands before proceeding; exits if the agent does not accept commands.
Gets the drain reason from BCM, updates it with “(AHR in-progress)”, and re-drains the node via BCM with the updated reason.
Invokes BREAKFIX_COMPUTE_TRAY_TRIAGE(INPUT, DRAIN_REASON) asynchronously to perform triage on the selected compute node.
No manual intervention is required to start the process.
The BREAKFIX_TRIGGER runbook is shared across GB300, GB200, and B200. It has no user-configurable scope parameters; it discovers drained nodes from BCM automatically.
One can see the time trigger settings on the right side of the Runbook under Triggers, where it shows that it is currently enabled and runs every 5 minutes.
You can also manually trigger the workflow:
Navigate to the “BREAKFIX_TRIGGER” runbook in the Runbooks section
Select the “Create Run” button positioned in the top right corner of the interface
After initiating the process, a confirmation dialog will appear with a “View Run” link
Selecting this link will redirect you to a page displaying comprehensive job status and details
The automated nature of this workflow ensures that system issues are addressed promptly without requiring constant monitoring or manual intervention.
Break/Fix Workflow Components#
The break/fix system consists of several key components that work together to diagnose and remediate issues with compute trays. The following is a detailed explanation of each component:
BREAKFIX_TRIGGER#
The entry-point runbook (shared for GB300, GB200, and B200 compute break/fix) that:
Runs automatically every 5 minutes via time trigger.
Gets drained nodes from BCM and only proceeds if the drain reason is one of the allowed reasons: Excluded by ARE, Prolog/Epilog error, Kill task failed, Duplicate jobid, Low RealMemory, Drained by CMDaemon, Test breakfix flow, or Not responding.
Processes one node per run: selects a drained node not already in maintenance, verifies AHR agent accepts commands, sets the maintenance tag, gets and updates the drain reason with “(AHR in-progress)”, re-drains via BCM, then invokes BREAKFIX_COMPUTE_TRAY_TRIAGE(INPUT, DRAIN_REASON) asynchronously.
Has no user-facing parameters; node discovery and scope are driven by BCM drained state.
BREAKFIX_COMPUTE_TRAY_TRIAGE#
This runbook is automatically triggered by BREAKFIX_TRIGGER and performs comprehensive triage on drained compute trays.
This runbook performs comprehensive triage on drained compute trays with two main workflows:
Workflow for Unresponsive Compute Nodes#
Initial Assessment
Tests connectivity using ping to check if compute nodes are responsive or unresponsive
Identifies nodes that are already unresponsive and require recovery
Leak Detection
Checks if any leaking is reported through BCM
Creates Support ticket immediately for any nodes with detected leaking (if opted in to support ticket service)
Recovery Process for Non-Leaking Nodes
Initiates power cycle for nodes without leaking issues
Waits and checks if hosts come back online
Waits until the AHR agent is connected to confirm successful recovery
Failure Handling
Creates Support ticket for hosts that fail to start up (if opted in to support ticket service)
Validation
For recovered nodes, automatically runs BREAKFIX_COMPUTE_TRAY_VALIDATION to verify functionality
Workflow for Responsive Compute Nodes#
GPU Recovery Assessment
Checks if any GPU recovery action is present
Routes to GPU_RECOVERY runbook if GPU issues are detected
Automatically runs BREAKFIX_COMPUTE_TRAY_VALIDATION for nodes without specific issues
GPU_RECOVERY#
This specialized diagnostic runbook is automatically invoked by BREAKFIX_COMPUTE_TRAY_TRIAGE when GPU-related issues are detected.
This specialized diagnostic runbook focuses on GPU-related issues:
Verification and Assessment
Verifies the node is still drained from BCM
Categorizes recovery actions (Reboot, Reset, or None)
Recovery Actions Based on Type
For Reboot Action:
Reboots the node requiring GPU reboot
Waits for host to come back online
Automatically runs BREAKFIX_COMPUTE_TRAY_VALIDATION if host is up
Creates Support ticket for host that fail to start up (if opted in to support ticket service)
For Reset Action:
Resets the GPU
Automatically runs BREAKFIX_COMPUTE_TRAY_VALIDATION to verify on successful GPU reset
If reset fails, automatically runs BREAKFIX_DIAG_DUMP and creates a Support Ticket (if opted in to support ticket service)
For No Action Required:
Automatically runs BREAKFIX_COMPUTE_TRAY_VALIDATION directly
BREAKFIX_COMPUTE_TRAY_VALIDATION#
This runbook is automatically executed after remediation actions to validate system health as part of the automated workflow following triage and recovery operations.
After remediation actions, this runbook validates the system health:
Comprehensive Testing
Runs testing suites to validate the compute tray
Executes HPL test (HPL use mpirun for single-node execution instead of Slurm for break/fix scenarios)
Runs AHR prolog script to prevent undraining of nodes that are still failing prolog checks, since undraining will result in them being drained again at the next Slurm invocation
Result Handling
For failed tests, automatically runs BREAKFIX_DIAG_DUMP for detailed diagnostics
For passed tests, undrains/untags the host to return it to service
BREAKFIX_DIAG_DUMP#
This runbook is automatically triggered when validation tests fail, collecting comprehensive diagnostic information for support ticket creation.
This runbook collects comprehensive diagnostic information:
Runs NVSSVT (NVIDIA System Software Validation Toolkit)
Collects NVSM (NVIDIA System Management) health dumps
Executes EUD (End User Diagnostics)
Runs Partnerdiag if necessary
Creates a consolidated diagnostic log dump package
Generates a Support ticket with diagnostic log for support (if opted in to support ticket service)
Prerequisites for EUD and Partnerdiag:
EUD: Binary must be installed on every compute node for execution
Partnerdiag: Binary must be installed on the head node under path
/cm/shared/partnerdiagIf these binaries are not properly installed, EUD and Partnerdiag will be skipped during diagnostic collection
View Break/Fix Result#
Users can monitor break/fix operations and determine outcomes through multiple methods:
Accessing Break/Fix Results#
Via Runbook Execution View:
Click “Runs” in the upper left corner
Filter by “BREAKFIX_TRIGGER” to see all break/fix executions
Select a specific run to view detailed execution flow
Via Resource Run History:
Navigate to “Resources” in the left panel and search for the resource (e.g., “b06-p1-dgx-06-c05”)
Click on the resource name
View the “Run History” page which displays all runbooks the resource participated in, with execution timestamps and status
Filter or search for BREAKFIX related runbooks to see the complete history of remediation attempts for that specific node
Understanding Break/Fix Outcomes#
Successful Recovery Indicators:
Node status changes from “DRAINED” to “IDLE” or “ALLOCATED” in BCM
Maintenance tag is removed from the node
BREAKFIX_COMPUTE_TRAY_VALIDATION shows “PASSED” status
Node is automatically returned to service
Failed Recovery Indicators:
Node remains in “DRAINED” state
Support ticket is automatically created (if opted in to support ticket service)
BREAKFIX_DIAG_DUMP execution indicates diagnostic collection
Maintenance tag remains on the node
Drain reason is updated to add “(AHR complete)” to indicate AHR processing has finished. Note that “(AHR in-progress)” indicates Break/Fix is still processing the node.
Determining Recovery Path#
GPU Recovery Path:
Look for GPU_RECOVERY runbook execution in the workflow
Check if GPU reboot or reset actions were performed
Validation results indicate GPU functionality restoration
Power Cycle Recovery Path:
BREAKFIX_COMPUTE_TRAY_TRIAGE shows auxiliary power cycle execution
Node connectivity tests show successful recovery
Monitoring Ongoing Operations#
Break/fix operations run every 5 minutes automatically
Check the “maintenance” tag to see which nodes are currently being processed
Review recent BREAKFIX_TRIGGER executions to track system-wide break/fix operations
NVIDIA Mission Control autonomous hardware recovery Break/Fix Post RMA#
Break/Fix Post RMA Introduction#
The NVIDIA Mission Control autonomous hardware recovery Break/Fix Post RMA workflow automates the process of bringing hardware components back into service after a Return Merchandise Authorization (RMA) replacement. This workflow ensures that replaced hardware is properly configured, firmware is updated to the correct versions, and the component is thoroughly validated before returning to production.
Figure: Break/Fix Post RMA Workflow - This diagram illustrates the comprehensive post-RMA process for compute tray replacement, starting with BCM inventory updates for new MAC addresses, followed by BMC credential management, OPROM configuration, and boot order correction. The workflow then proceeds through firmware updates to ensure correct versions, concludes with system validation including agent connectivity verification and comprehensive testing via BREAKFIX_COMPUTE_TRAY_VALIDATION, and automatically returns validated hardware to service.
Key Features#
Automated Configuration: Configures replaced hardware components with proper settings
Firmware Updates: Updates firmware to match the required versions for the environment
Boot Order Correction: Ensures proper boot sequence for reliable operation
Comprehensive Validation: Performs thorough testing to verify hardware functionality
Seamless Integration: Automatically returns validated hardware to service
Post RMA Workflow Components#
The Post RMA workflow consists of several key steps that ensure replaced hardware is properly configured and validated:
Physical Replacement Procedures#
Compute Tray Removal: Detailed step-by-step instructions for safely removing failed compute trays, including power down procedures, cable disconnection, and proper handling
Compute Tray Installation: Comprehensive installation guide covering component migration (M.2 boot drive, E1.S cache drives, HMC, BMC, TPM), rail installation, and cable reconnection
Component Migration: Transfer of critical components from old tray to new tray while maintaining proper slot assignments and ESD protection
BCM Inventory Update#
ONLY REQUIRED FOR NEW HARDWARE: Updates BCM inventory information using the BREAKFIX_POST_RMA_UPDATE_BCM_INVENTORY runbook when a new compute tray is installed
Skip this step for repaired trays as MAC addresses remain unchanged
Ensures MAC addresses and other hardware identifiers are correctly registered in BCM (new MAC addresses are provided by the Enterprise Support team who manage serial numbers and asset inventory for customer deployments)
Enables proper management and monitoring of the replaced hardware
BMC Credential Management#
Creates necessary BMC credential files for secure access to hardware components
Establishes secure communication channels for configuration operations
BlueField Configuration#
Checks if BlueField devices are in NIC mode
Enables OPROM on BlueField devices to ensure proper initialization
Configures hardware components for optimal operation
Boot Order Correction#
Ensures the boot sequence is properly configured
Prevents boot failures and improves system reliability
Performs power reset through BMC after configuration changes
Connectivity Verification#
Verifies SSH connectivity to compute nodes
Checks BCM device status to ensure proper registration
Confirms network accessibility before proceeding with firmware updates
Firmware Updates#
Upgrades compute firmware to the version in the specified package directory
Upgrades Mellanox BlueField and ConnectX firmware using the provided package file paths
Uses the golden configuration JSON (FW_SOURCE_JSON_PATH) for validation; all components are updated in a single run
System Validation#
Waits for hosts to come back online after each firmware update cycle
Verifies agent connectivity to ensure management capabilities
Runs comprehensive validation tests using BREAKFIX_COMPUTE_TRAY_VALIDATION
Opens nodes in BCM and validates Slurm readiness for successful nodes
Running the Post RMA Workflow#
Step 1: Update BCM Inventory (ONLY FOR NEW HARDWARE)#
Note: This step is ONLY required when installing a new compute tray. Skip this step for repaired trays as MAC addresses remain unchanged.
For new hardware replacement, update the BCM inventory with new MAC addresses and hardware identifiers:
Navigate to the “BREAKFIX_POST_RMA_UPDATE_BCM_INVENTORY” runbook in the Runbooks section
Configure the required parameters (MAC addresses and serial numbers are provided by the Enterprise Support team):
HOST_NAME: The hostname of the replaced hardware component (e.g., a07-p1-dgx-03-c08)
BMC_MAC: MAC Address of the BMC
BF3_0_MAC: MAC Address of Predictable Network Interface Name enP6p3s0f0np0
BF3_1_MAC: MAC Address of Predictable Network Interface Name enP22p3s0f0np0
BF3_0_STORAGE: MAC Address of Predictable Network Interface Name enP6p3s0f1np1
BF3_1_STORAGE: MAC Address of Predictable Network Interface Name enP22p3s0f1np1
BF3_0_BMC: MAC Address of Interface Name ethX
BF3_1_BMC: MAC Address of Interface Name ethY
TRAY_SERIAL_NUMBER: Serial Number of the Tray
Select “Create Run” to initiate the BCM inventory update
Monitor the execution progress to ensure successful completion
Step 2: Execute Main Post RMA Workflow#
After successfully updating the BCM inventory (if required for new hardware), proceed with the main Post RMA workflow:
To execute the Post RMA workflow:
Navigate to the “BREAKFIX_POST_RMA” runbook in the Runbooks section
Configure the required parameters:
HOST_NAME (required): Name of the replaced host (e.g., a07-p1-dgx-03-c08)
FWPKG_DIR_PATH (required): Full path to the directory containing all firmware packages or the individual package (.fwpkg) for compute nodes
FWPKG_BF_FILE_PATH (required): Full path to the BlueField (BF3) firmware package file
FWPKG_CX_FILE_PATH (required): Full path to the ConnectX firmware package file
FW_SOURCE_JSON_PATH (required): Path to the golden configuration JSON from the firmware package; defines reference settings for validation. Set to NA if not available.
resource_tag (optional): Tag for resource query (e.g., rack_name)
resource_value (optional): Value for resource query (e.g., rack identifier)
Configure the required secrets (if not already configured):
AHR_API_ENDPOINT: The API endpoint URL for NVIDIA Mission Control
AHR_TOKEN: Authentication token for API access
To add or update these secrets:
In the Shoreline UI, go to Settings.
Click on the Secrets section.
Use the + Secret button to create:
AHR_API_ENDPOINT— Provide the correct API endpoint.AHR_TOKEN— Provide the secure API token.
If a secret already exists, click its name to update the value.
Click Save to persist the changes.
🔐 These secrets will be securely injected into the action at runtime.
Select “Create Run” to initiate the workflow
Monitor the execution progress and results
Note: The workflow includes detailed physical replacement instructions that must be followed before executing the automated portions. Ensure all physical replacement steps are completed as outlined in the runbook’s markdown sections.
NVIDIA Mission Control autonomous hardware recovery Break/Fix Post RMA Powershelf#
Break/Fix Post RMA Powershelf Introduction#
The Break/Fix Post RMA Powershelf workflow brings a replaced power shelf tray back into service after an RMA. It is available for GB300 and GB200 and consists of two runbooks: updating BCM inventory for the new powershelf node (when applicable), then running the main powershelf post RMA workflow to verify BCM status, identify the PowerShelf manufacturer (LiteOn or Delta), and upgrade PSU and PMC firmware to the provided versions.
Figure: Powershelf Post RMA Workflow — BCM inventory update (if new HW), Check BCM device status, Determine manufacturer (LiteOn or Delta), Upgrade PMC and PSU firmware, Return to service.
Running the Post RMA Powershelf Workflow#
Step 1: Update BCM Inventory (ONLY FOR NEW POWERSHELF HARDWARE)#
Note: This step is ONLY required when installing a new power shelf tray. Skip for repaired trays where the BMC MAC is unchanged.
Use the BREAKFIX_POST_RMA_UPDATE_POWERSHELF_BCM_INVENTORY runbook to register the new powershelf in BCM:
Navigate to the “BREAKFIX_POST_RMA_UPDATE_POWERSHELF_BCM_INVENTORY” runbook in the Runbooks section.
Configure the required parameters:
HOST_NAME (required): Host name to update in BCM inventory (e.g., b06-p01-pwr-01).
BMC_MAC (required): MAC address of the powershelf BMC.
Select “Create Run” and monitor the execution.
Step 2: Execute Main Powershelf Post RMA Workflow#
After updating BCM inventory (if required for new hardware), run the main powershelf post RMA workflow:
Navigate to the “BREAKFIX_POWERSHELF_POST_RMA” runbook in the Runbooks section.
Configure the required parameters:
resource_value (required): Scope value (e.g., rack name) for the workflow.
HOST_NAME (required): Name of the replaced powershelf host (e.g., b06-p01-pwr-01).
PSU_FILE_FULL_PATH (required): Full path to the PSU tar file for powershelf nodes.
PMC_FILE_FULL_PATH (required): Full path to the PMC tar file for powershelf nodes.
FW_SOURCE_JSON_PATH (required): Path to the golden configuration JSON from the firmware package; defines reference settings for validation.
Select “Create Run” to start the workflow. The runbook checks BCM device status, determines the PowerShelf manufacturer (LiteOn or Delta), and upgrades PSU and PMC firmware via the firmware upgrade step. Monitor execution until completion.
B200#
Automated Baseline Testing with NVIDIA Mission Control autonomous hardware recovery#
Introduction#
The NVIDIA Mission Control autonomous hardware recovery portal enables efficient automation of baseline testing procedures for DGX B200 systems. This comprehensive testing framework can be flexibly executed across various scales of infrastructure, from individual compute nodes to multiple node configurations. The system performs extensive validation of critical compute node components, including CPU/GPU/Memory/storage functionality, network connectivity, and firmware versioning. Additionally, it incorporates industry-standard performance benchmarking tools such as HPL, NCCL, and Nemotron (Large Language Model) to assess system capabilities. This streamlined approach significantly enhances both testing efficiency and thoroughness while reducing execution time.
Note: For B200, unit means an individual compute node.
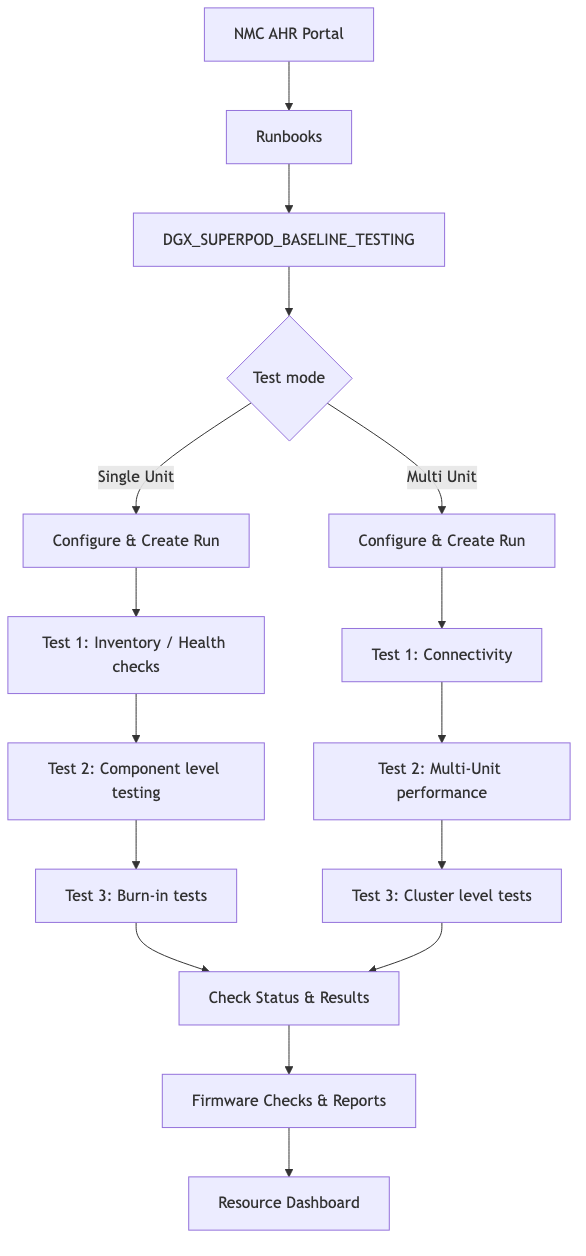
Entrypoint of Automated Testing#
A centralized automated baseline testing interface has been established to facilitate streamlined test execution and management. This unified entry point provides comprehensive access to the testing framework, enabling efficient navigation and one-click implementation of all testing procedures.
To access the baseline testing interface:
Access the NVIDIA Mission Control autonomous hardware recovery portal using your credentials and navigate to the Runbooks section.
Locate the “DGX_SUPERPOD_BASELINE_TESTING” runbook through the search functionality (reference the interface depicted following)
Upon selecting the “DGX_SUPERPOD_BASELINE_TESTING” runbook, you will be presented with the interface shown below. The subsequent sections of this documentation will provide detailed guidance on executing various testing procedures.
Run SUT (Single Unit Testing) Job#
Guide to Initiating Baseline Testing Procedures for Single Unit Configuration when one or multiple nodes are ready for testing.
Navigate to the “DGX_SUPERPOD_BASELINE_TESTING” runbook utilizing the previously outlined navigation protocol.
Ensure the “DGX_SUPERPOD_BASELINE_TESTING_SUT” component is activated by toggling its switch control. This control is located on the right side of its immediate group of interface icons. The switch indicator in its default deactivated state should be visually distinct from the activated state. Note: When activated, the switch indicator displays as a green circle with a play icon.
Verify that the “DGX_SUPERPOD_BASELINE_TESTING_MUT” component is in its deactivated state. This deactivated state is indicated by its corresponding switch control displaying as a grey circular icon containing a muted play symbol, signifying it is ‘Off’.
Select the “Save” button positioned in the top right corner of the interface to preserve your settings.
Upon successful completion of these preliminary steps, your runbook configuration should reflect the specified parameters as illustrated below.
To initiate a run, select the Create Run button located at the top right corner of the interface. A new window will appear as shown below. For detailed information about each parameter, simply hover over the info icon beside it.
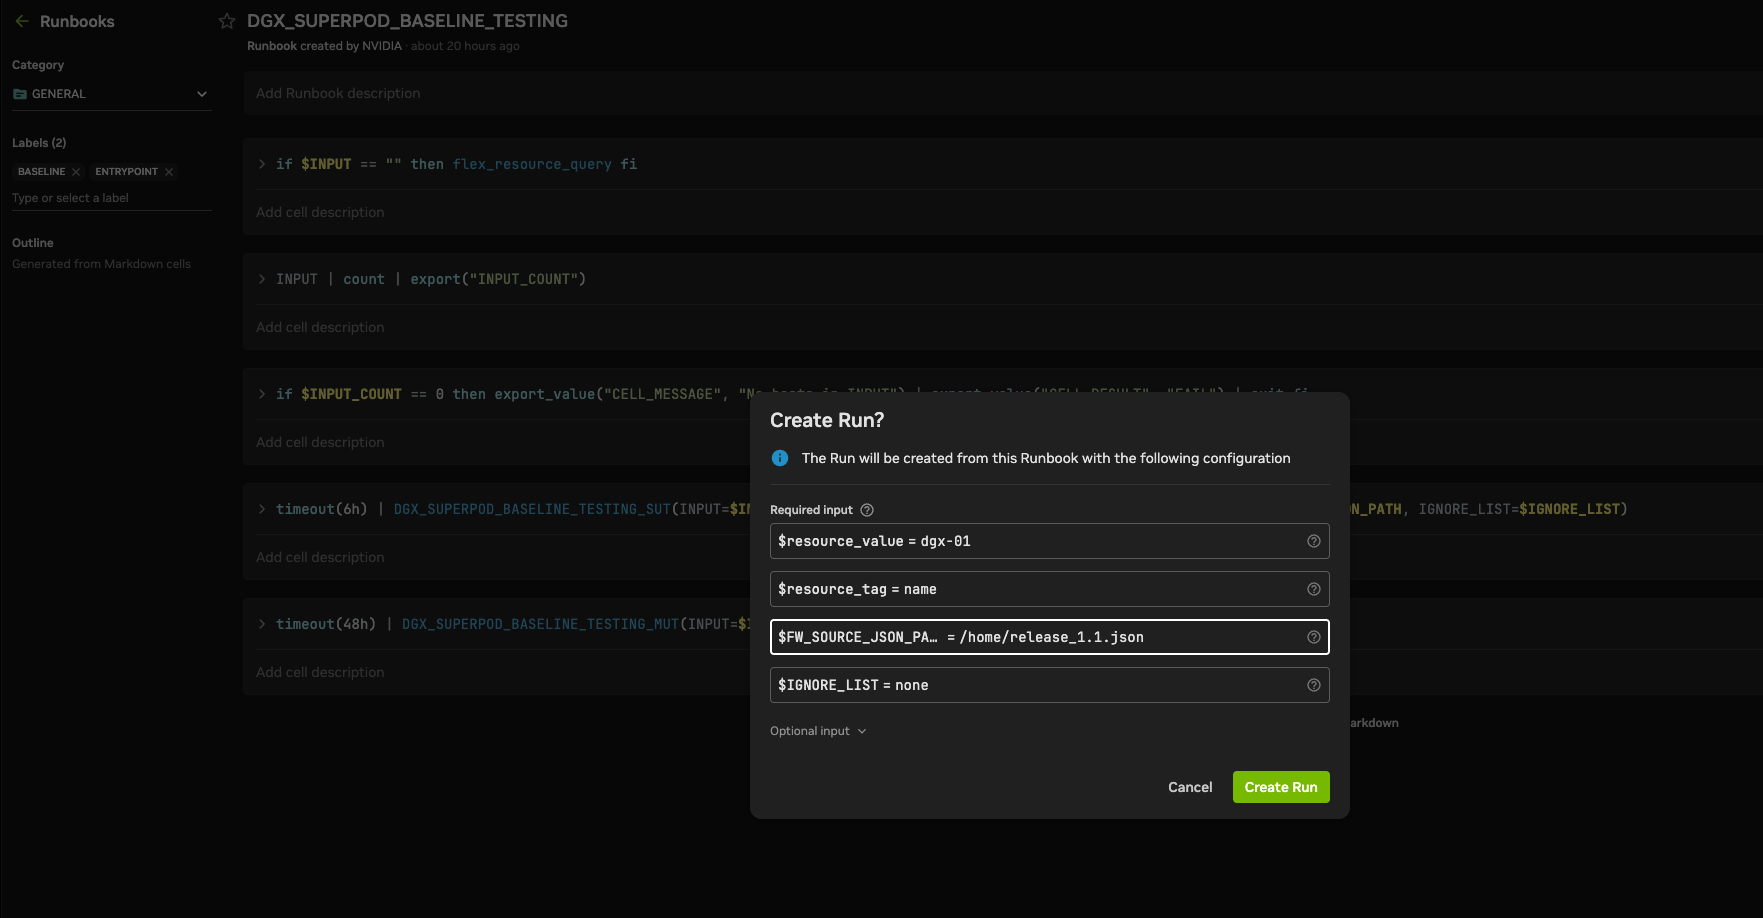
You are required to provide the following inputs for the runbook:
FW_SOURCE_JSON_PATHSpecify the file path to the golden configuration JSON file included in the firmware package. This file defines the reference settings used for validation. If the file is not available, set this parameter to NA.IGNORE_LISTProvide a list of nodes to exclude from the test only if required. Leave the value as “none” if no nodes need to be ignored. This parameter supports regular expressions. Here are some examples:Single node: node01
List format: [“node01”, “node02”]
Pipe-delimited string: node01|node02
After entering the correct value, select the “Create Run” button to initiate the process. A confirmation dialog will appear with a “View Run” link illustrated below. Selecting this link will redirect you to a new page displaying comprehensive job status and details. For additional information regarding job monitoring and results, please refer to the “Check Job Status and Result” section of this documentation.
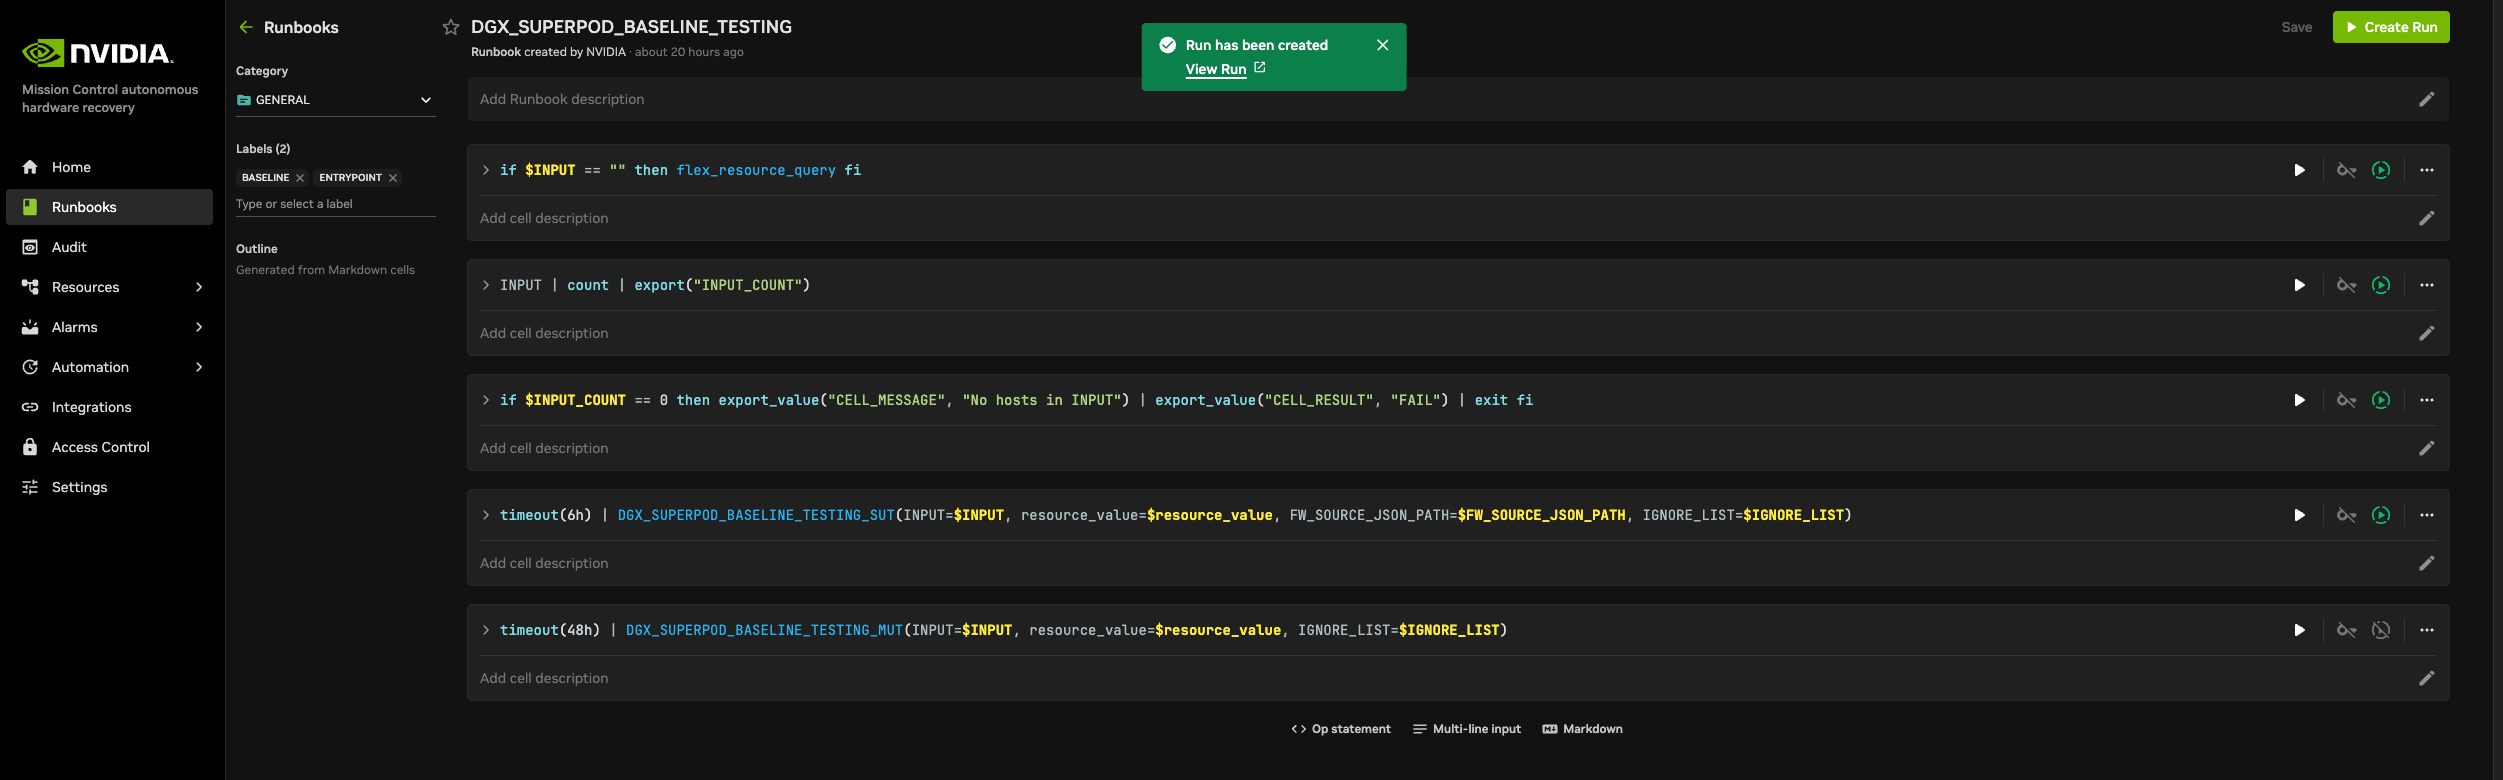
Predefined the timeout for SUT is 6 hours. You can adjust based on your requirements.
Run MUT (Multi Unit Testing) Job#
Guide to Initiating Baseline Testing Procedures for Multi-Unit Configuration.
Navigate to the “DGX_SUPERPOD_BASELINE_TESTING” runbook utilizing the previously outlined navigation protocol.
Ensure the “DGX_SUPERPOD_BASELINE_TESTING_MUT” component is activated by toggling the switch control. This control is located on the right side of its immediate group of interface icons. The switch indicator in its default deactivated state should be visually distinct from the activated state. Note: When activated, the switch indicator displays as a green circle with a play icon.
Verify that the “DGX_SUPERPOD_BASELINE_TESTING_SUT” component is in its deactivated state. This deactivated state is indicated by its corresponding switch control displaying as a grey circular icon containing a muted play symbol, signifying it is ‘Off’.
Select the “Save” button positioned in the top right corner of the interface to preserve your settings.
Upon successful completion of these preliminary steps, your runbook configuration should reflect the specified parameters as illustrated below.
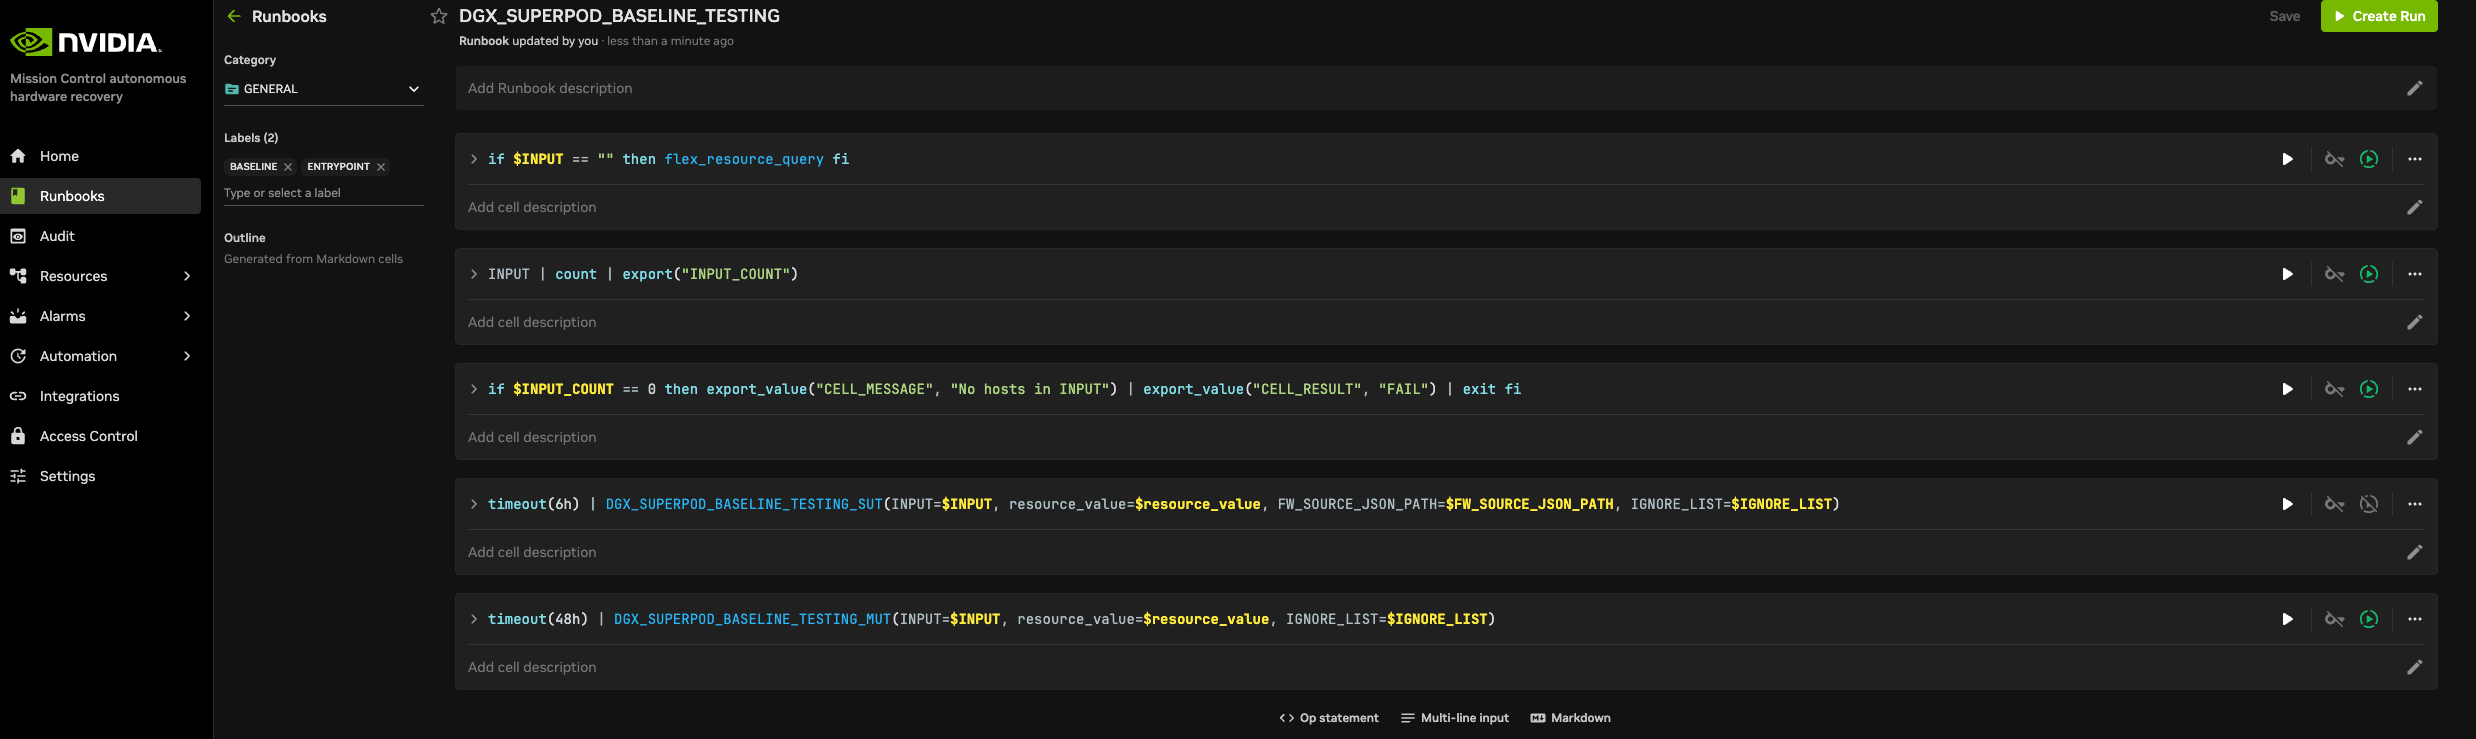
Select the “Create Run” button positioned in the top right corner of the interface, the new window will pop out as illustrated below.
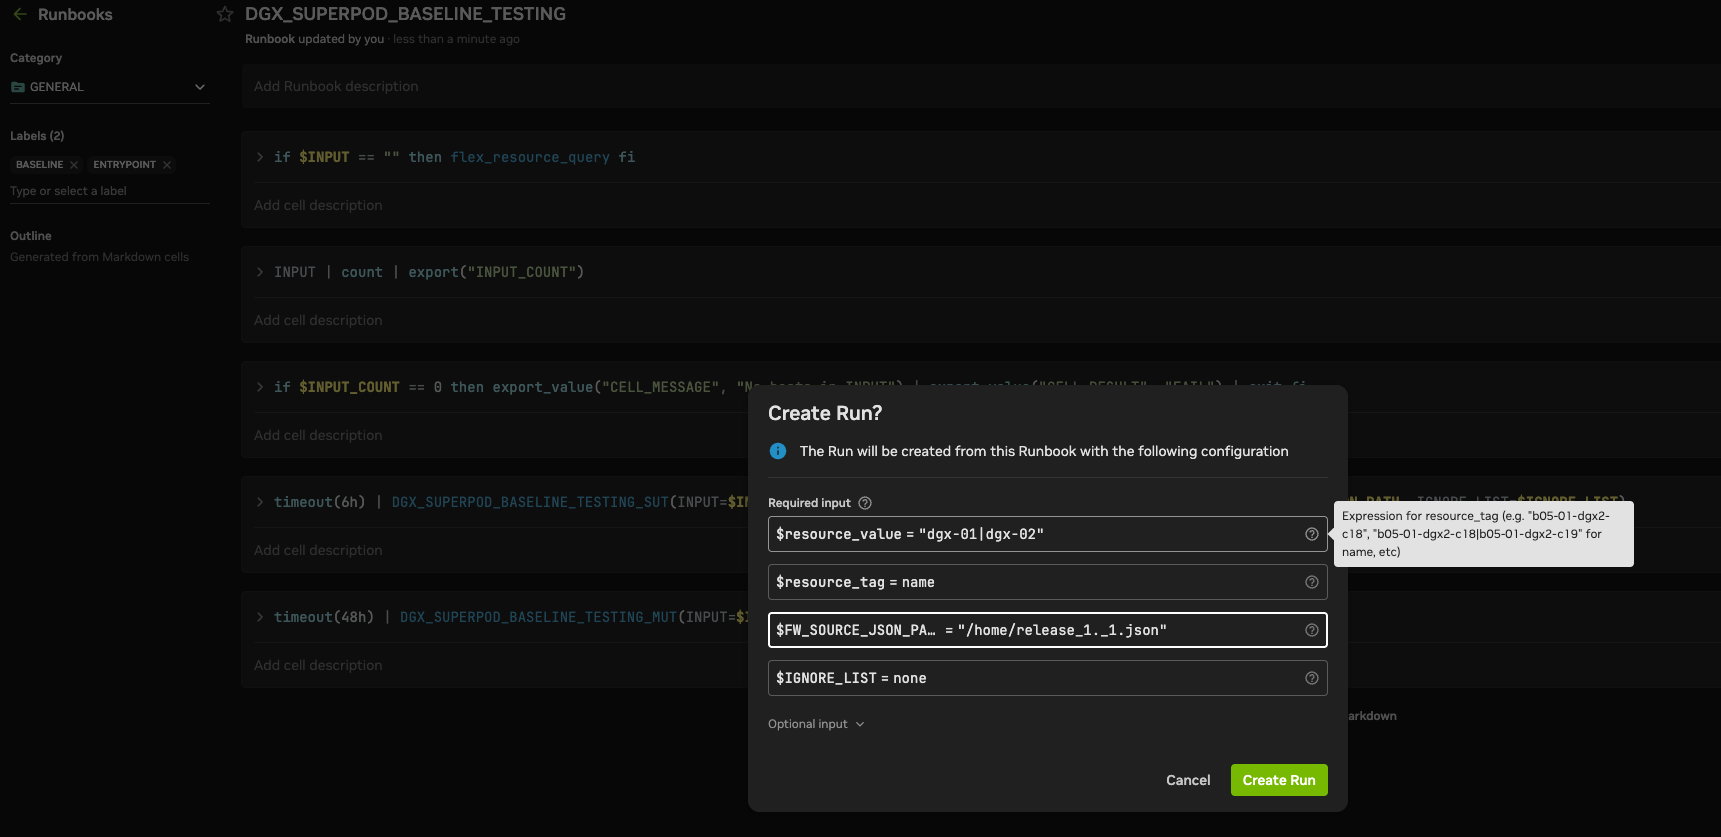
After entering the correct Required parameter values, select the “Create Run” button to initiate the process. A confirmation dialog will appear with a “View Run” link illustrated below. Selecting this link will redirect you to a new page displaying comprehensive job status and details. For additional information regarding job monitoring and results, please refer to the “Check Job Status and Result” section of this documentation.
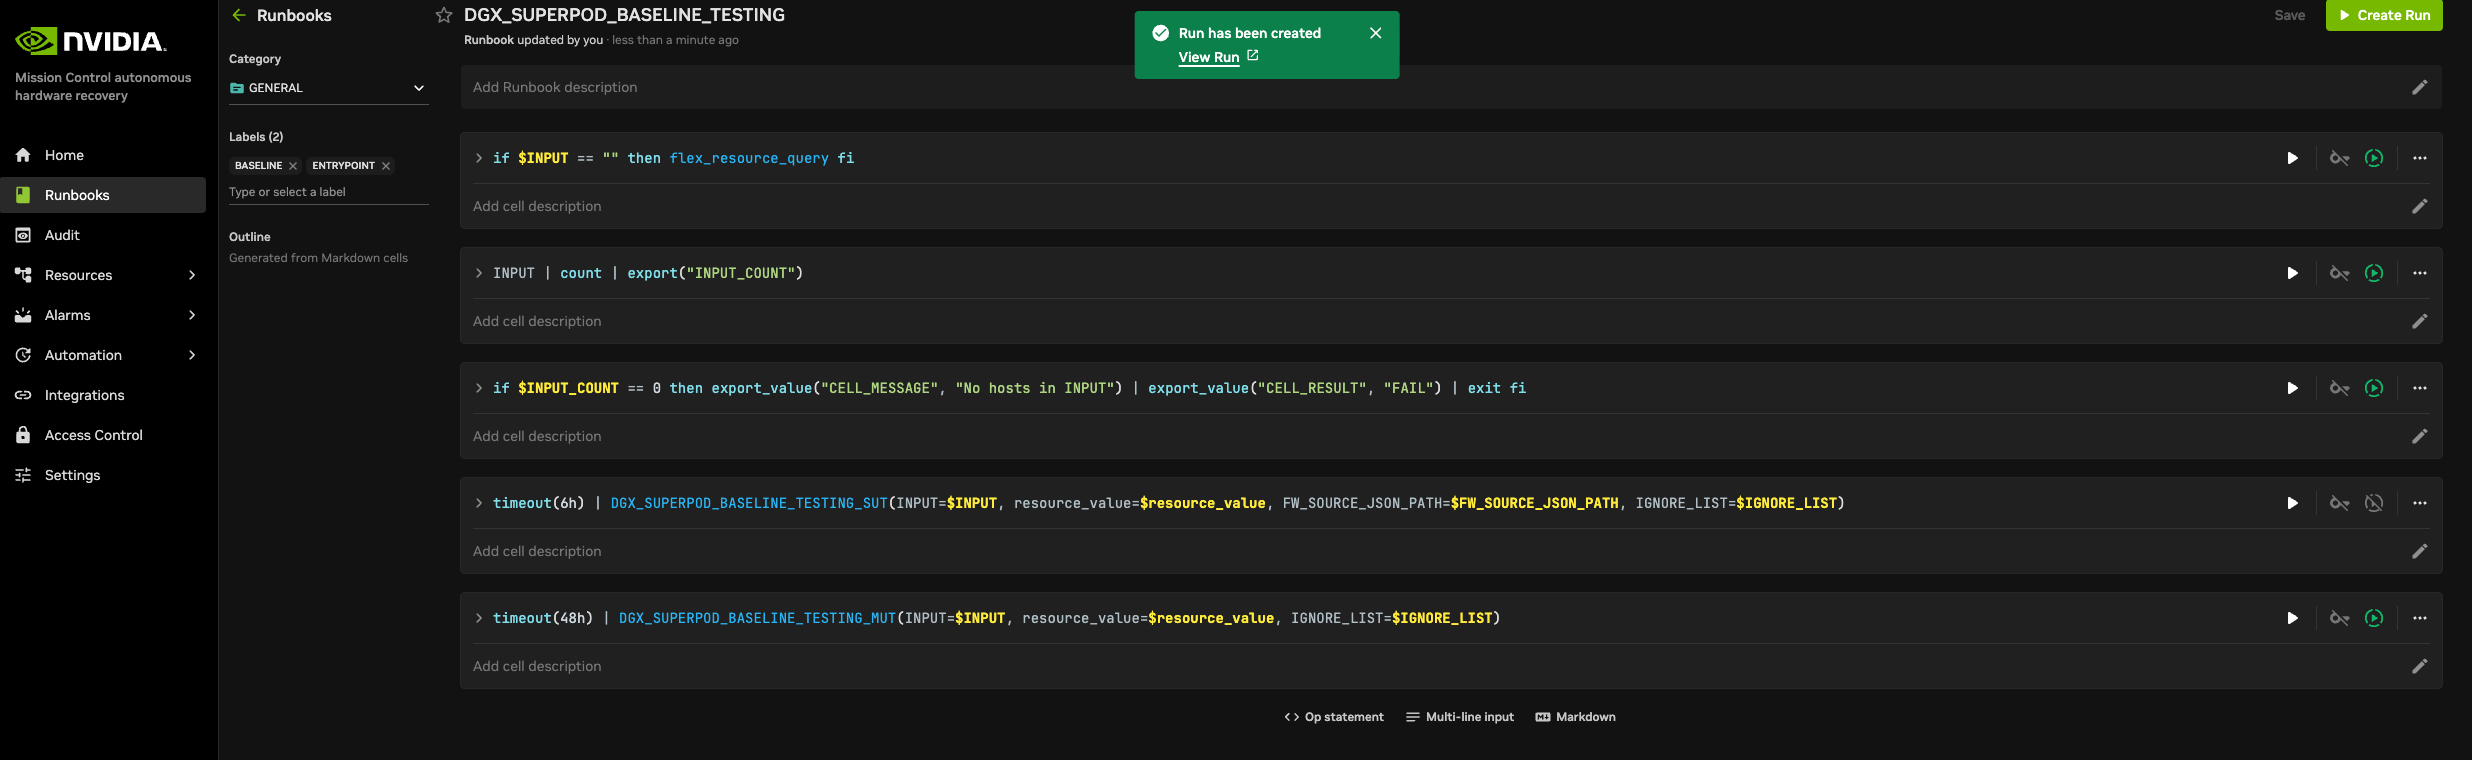
Predefined the timeout for MUT is 48 hours. You can adjust based on your requirements.
Runbook Configurations#
Before you initiate real jobs, we’d like to provide you with a guide on how to check the Runbook Configurations.
Select “Runbook” from the left navigation panel, then use the search field on the right side of the page to find your runbook by name, as shown in the illustration below.
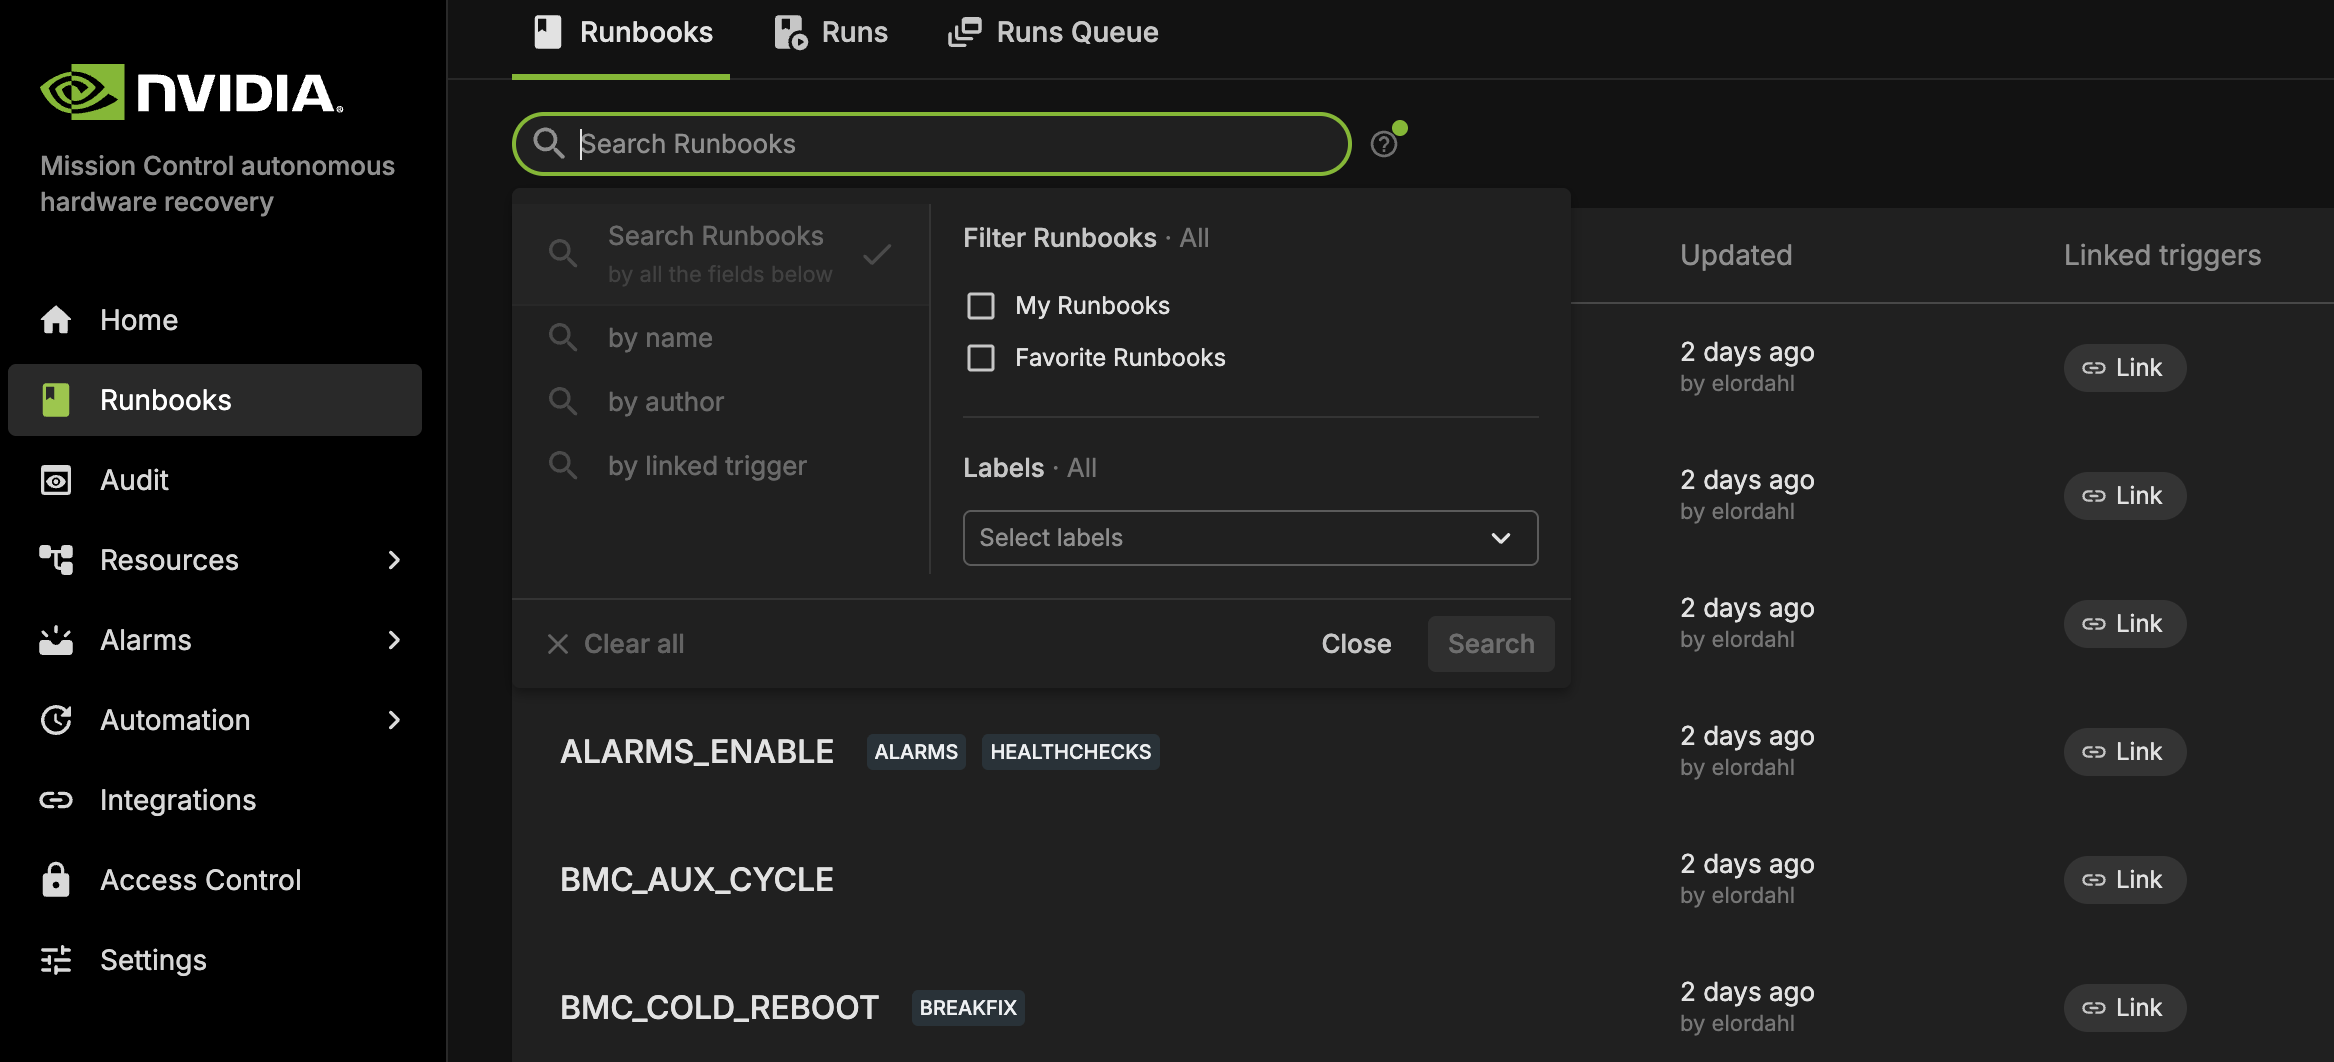
Below is the list of all mission control related runbooks including its name and description for B200 systems.
Category |
Runbook Name |
Description |
|---|---|---|
DGX_SUPERPOD_BASELINE_TESTING |
EntryPoint Runbook |
|
SUT |
DGX_SUPERPOD_BASELINE_TESTING_SUT |
EntryPoint Runbook of SUT (Single Unit Testing) |
SUT1 |
EntryPoint Runbook of all single node health checks |
|
SINGLENODE_HEALTHCHECK_GPU_CPU |
Baseline health checks for GPU and CPU |
|
SINGLENODE_HEALTHCHECK_MEMORY_STORAGE |
Baseline health checks for Memory and Storage |
|
SINGLENODE_HEALTHCHECK_NETWORK |
Baseline health checks for Network |
|
SINGLENODE_HEALTHCHECK_SOFTWARE |
Baseline health checks for installed software |
|
SINGLENODE_HEALTHCHECK_FIRMWARE |
Baseline health checks for firmware |
|
SUT2 |
EntryPoint Runbook of component testing |
|
MEMORY_BENCHPRESS |
Benchmark testing for memory |
|
CUDA_SAMPLES |
Benchmark testing for CUDA |
|
HPL_TEST_SINGLE_NODE_MPIRUN |
HPL testing on single node separately |
|
NVBANDWIDTH_SINGLE_NODE_MPIRUN |
Bandwidth testing running on single node |
|
NCCL_TEST_SINGLE_NODE_MPIRUN |
NCCL testing on single node |
|
SUT3 |
EntryPoint Runbook of burn-in performance testing |
|
HPL_TEST_BURN_IN_SINGLE_NODE_MPIRUN |
HPL testing on the single node with long duration |
|
MUT |
DGX_SUPERPOD_BASELINE_TESTING_MUT |
EntryPoint Runbook of MUT (Multi Unit Testing) |
MUT1 |
EntryPoint Runbook of rack level connectivity testing |
|
INFINIBAND_CHECK |
InfiniBand connectivity validation |
|
MUT2 |
EntryPoint Runbook of multi-rack performance testing |
|
NVBANDWIDTH_MPIRUN |
Bandwidth testing across multiple nodes |
|
P2P_IPERF_MPIRUN |
Point-to-point network performance testing |
|
HPL_TEST_MPIRUN |
HPL testing across multiple nodes |
|
. |
NCCL_TEST_MPIRUN |
NCCL testing across multiple nodes |
HPL_TEST_BURN_IN_MPIRUN |
HPL testing cross multiple nodes with long duration |
|
MUT3 |
EntryPoint Runbook of cluster level testing |
|
Nemotron_15B_MPIRUN |
LLM testing with mocked data |
Runbook Interface Guide#
When accessing the runbook as shown in the example below, please note these important configuration elements:
Central Workspace#
The main content area displays your resource queries, commands, scripts, or nested runbooks.
Each row represents an individual cell
Each cell includes a play button for isolated execution
Toggle switches allow you to enable/disable specific cells
Configuration Panel (Right Side)#
The right panel contains several critical configuration sections:
Parameters Contains all required inputs for runbook execution
Triggers Configure automated execution methods:
Alarm triggers
Time Trigger (cron jobs)
Other integrations like AlertManager
Users Manage permissions for who may run or edit the runbook
Settings General runbook configuration options
… more runbook operations including:
Clone functionality
Export options
Delete runbook
etc.
Check Job Status and Result#
This section provides comprehensive guidance on monitoring runbook execution progress and interpreting results.
Check Job Status#
To monitor the status of a runbook execution:
After creating a run, click the “View Run” link in the confirmation dialog
Alternatively, navigate to “Runs” in the left panel and select your specific execution
The run details page displays:
Overall run status
Start time and duration
Each cell’s execution status
Resource filtering information
Output from each step
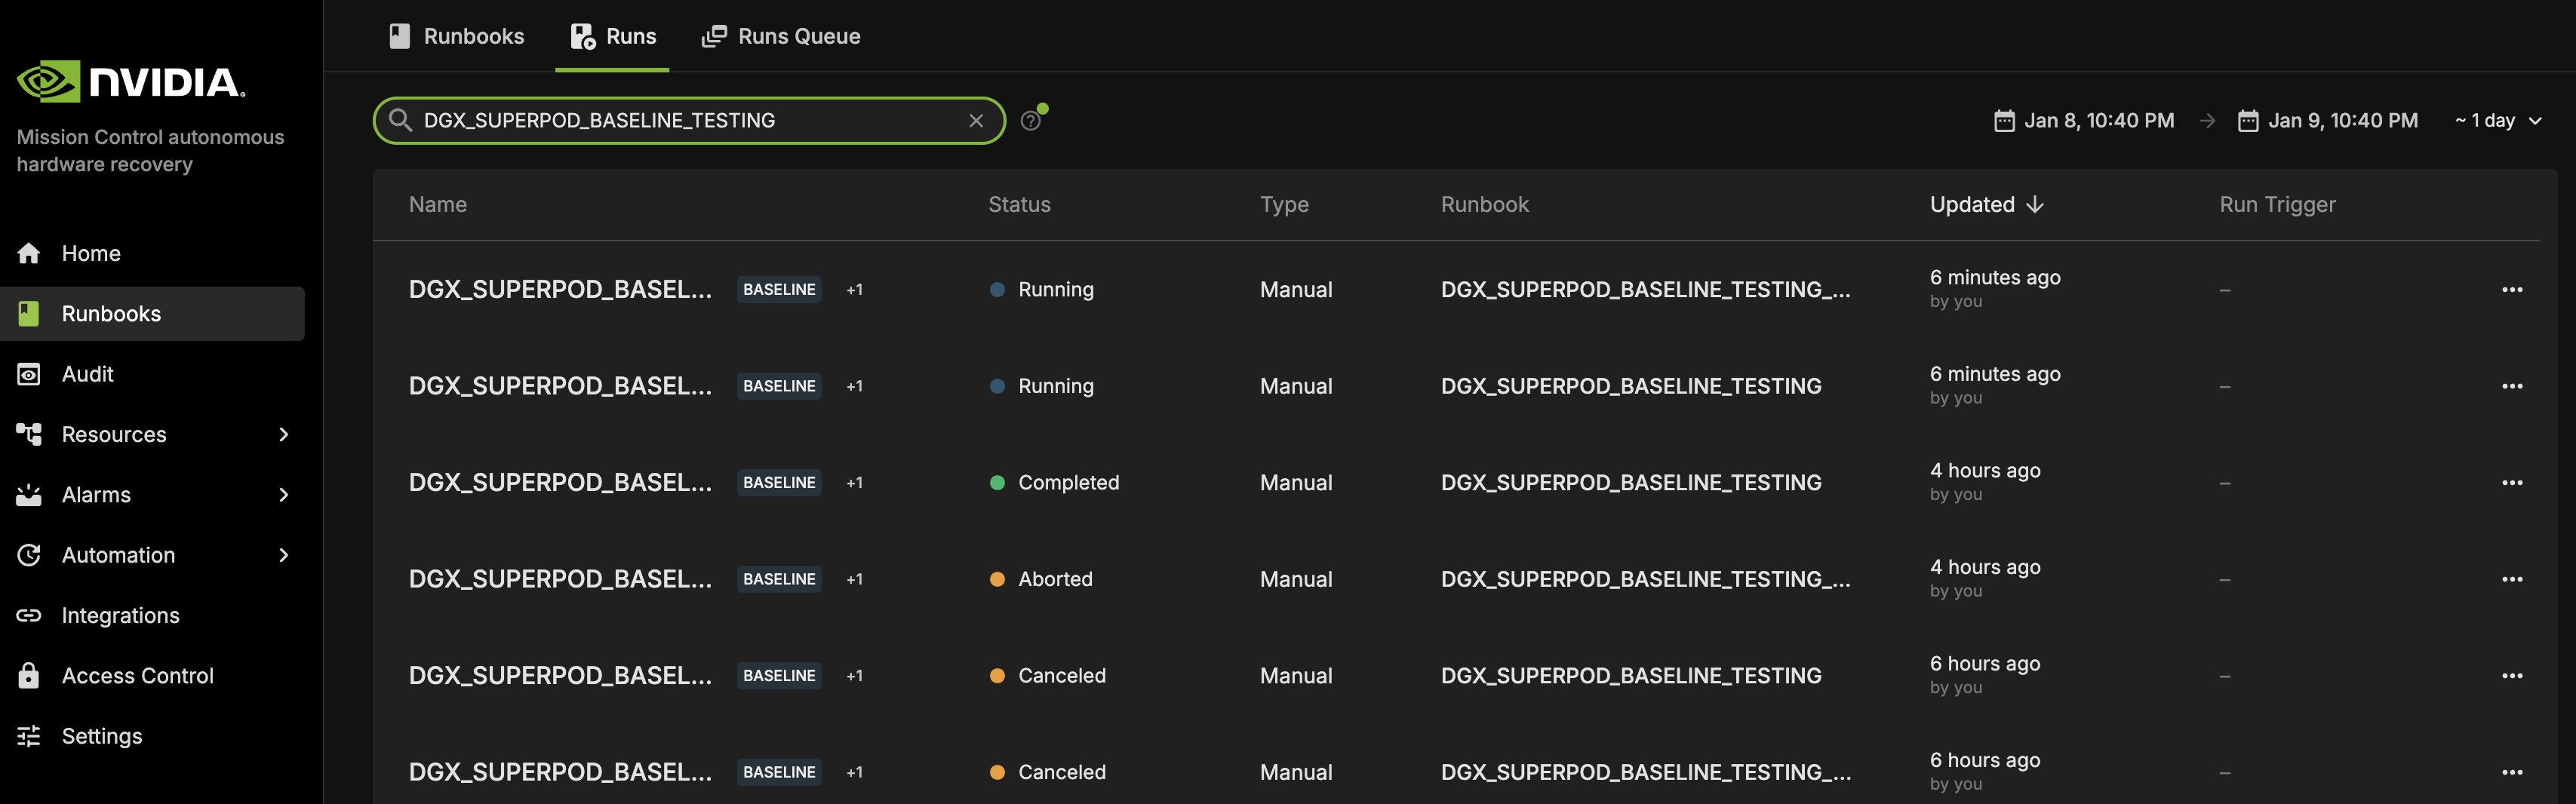
Status Types and Definitions#
Running The job is currently executing. Progress is displayed as a percentage based on completed cells.
Completed The job has finished execution. Note that completion status does not guarantee successful results. Please review the detailed output in the results section.
Aborted The job terminated prematurely due to execution errors, such as cell syntax issues.
Terminated The job was forcibly ended by the system.
Timed Out The job exceeded its maximum allowed execution duration (default timeout is 1 hour for runbook, 1 minute for action)
Canceled The job was manually terminated by a user.
Check Job Results#
When the job status displays “Completed,” you may proceed to review the job results. If the job status shows otherwise, you may click into the job for more details and troubleshooting.
Cell Structure Overview#
Each cell in the runbook contains three primary components:
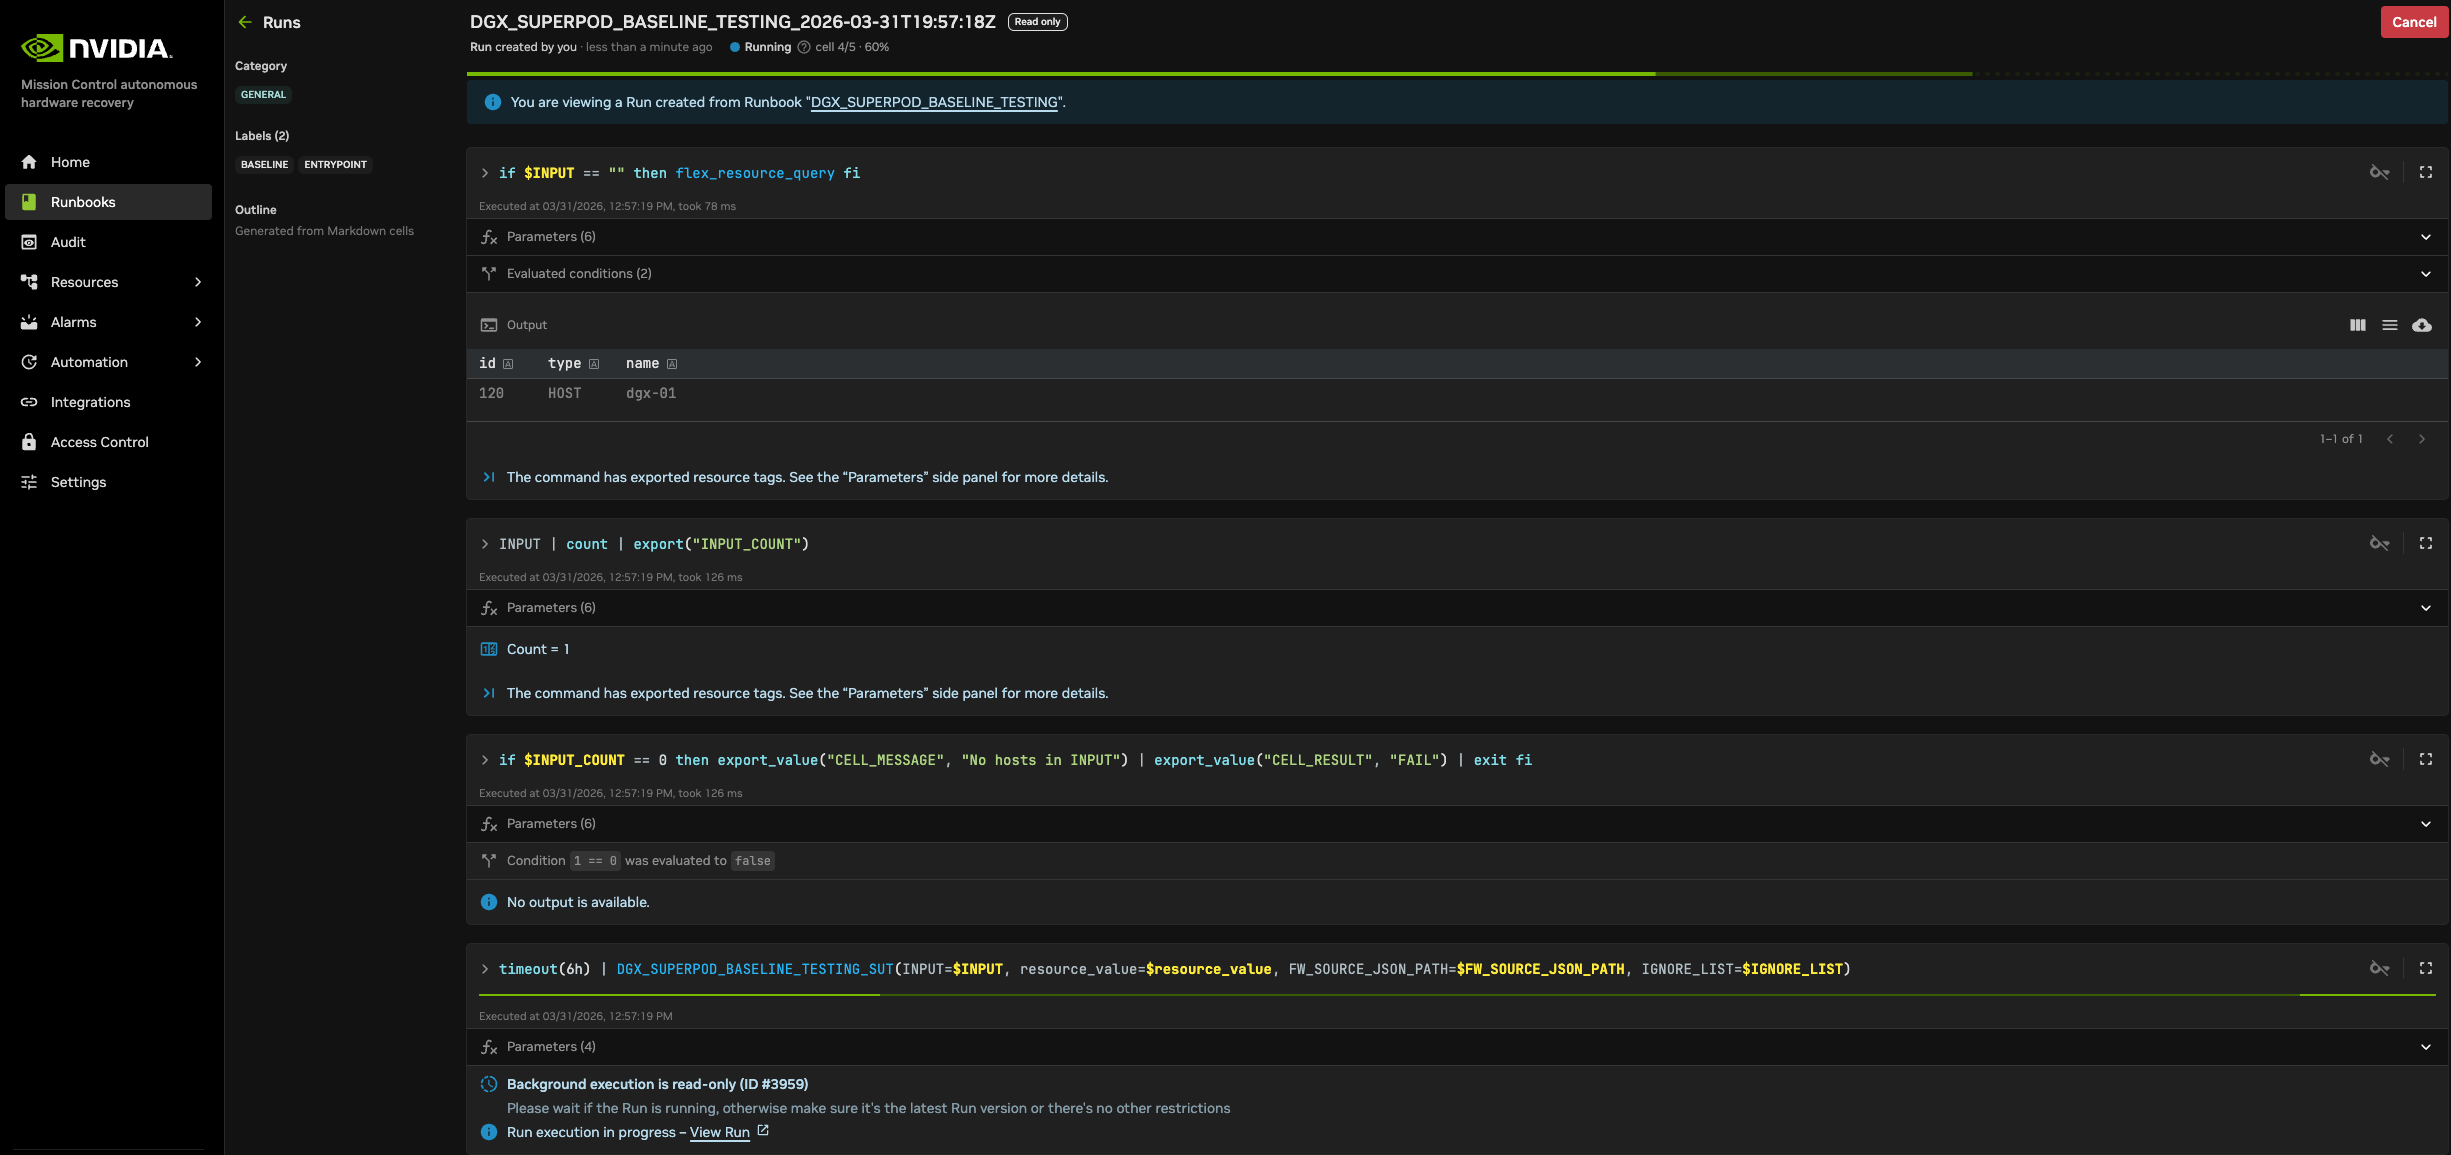
Main Content Area: This section displays the executed script or command. On the right side of the cell, you’ll find several control icons. While most icons were detailed in the previous section, the “fx” icon is particularly valuable as it displays all parameters along with input/output values for the specific cell when hovering over it.
Execution Information Bar: Located in the middle of the cell, this light grey text line indicates the execution start time and duration of the operation.
Results Section: The bottom portion displays:
Exit code status
Execution location information
Complete command output (accessible by clicking the “Output” column contents)
Additional Features:
Configure output display preferences
Toggle the density
Download results in various formats using the download options menu
Streamlined Error Navigation: When a job contains numerous cells, manually checking for failures becomes inefficient. Use the “Error outline” feature in the middle panel to quickly locate problematic cells. Simply click any item in this list to automatically navigate to the corresponding failed cell.
Notes: there are reports available for the major runbooks. Details can be found “Reports of Testings”
Handling Job Failures#
In the event of job or cell execution failures, the following remediation options are available:
Major Issue Resolution: Upon resolution of critical infrastructure issues (e.g., hardware replacement), a complete re-initialization of the SUT or MUT job is recommended.
Targeted Component Resolution: When specific components have been updated (e.g., firmware version upgrades), execute the relevant job or runbook within the existing session by selecting the “Run” button located in the upper-right interface section. This maintains all previously established parameters.
Individual Cell Correction: For isolated cell failures that have been addressed, execute the specific cell independently by activating the execution control (play button) positioned on the right margin of the cell interface. Note: This option might cause the difficulty to locate the job/run from the reports panel (Please refer Reports of Testing section below).
Firmware checks#
NVIDIA Mission Control autonomous hardware recovery includes firmware checks that extract the current firmware versions of the trays and switches, and compare them with the expected versions specified in the Source of Truth (SOT) file. The SOT file includes the expected versions for all components such as OS, HMC, ConnectX, etc., and is prepopulated. The SOT file can be obtained from the NVIS team.
The runbook extracts the expected versions of all firmware components and compares the current versions against them.
Updating the SOT file#
Place the SOT JSON file on the headnode and provide the complete file path as the input FW_SOURCE_JSON_PATH to the DGX_SUPERPOD_BASELINE_TESTING runbook. To update the file, simply replace it with the new file and update the path in the input parameter of the runbook accordingly.
Thresholds and Defaults#
The thresholds and default values for various tests are defined in the Golden Config File. The runbook picks the appropriate values, and compares it against the values on the nodes. This includes defaults such as number of GPUs and expected benchmarks for benchmarking tests (such as SUT2).
Golden Config File#
The Golden Config File (referred to as the defaults.env file on the trays and control nodes) contains the expected values for all benchmark thresholds, and other relevant settings. This file is distributed across all trays and loaded as environment variables, making its contents available during testing.
Updating the Golden Config File#
To update the golden config values, edit config/<CHIP>/defaults.yaml (for example, config/B200/defaults.yaml or config/GB200/defaults.yaml). The chip-specific env files are generated automatically from these YAML files during deployment — do not edit the generated files under Shoreline_files/generated/ directly.
Once the changes are made and saved, use the NVIDIA Mission Control autonomous hardware recovery Runbook Deployment section (from the NVIDIA Mission Control AHR installation documentation) to apply them via OpenTofu. This process will create a File object on NVIDIA Mission Control autonomous hardware recovery, which pushes the updated file automatically to all control and compute trays. Various tests, including firmware checks, prolog, and epilog checks, source the defaults.env file and utilize the expected values, now available as environment variables.
Reports of Testings#
NVIDIA Mission Control autonomous hardware recovery provides reports for baseline testing, reflecting the status of nodes (compute and switches) at each test stage. These reports help identify and troubleshoot root causes.
To access the NVIDIA Mission Control autonomous hardware recovery reports, click on Resources in the side menu, then select Reports.
The Landing page contains two tabs: Report Templates and Published Reports.
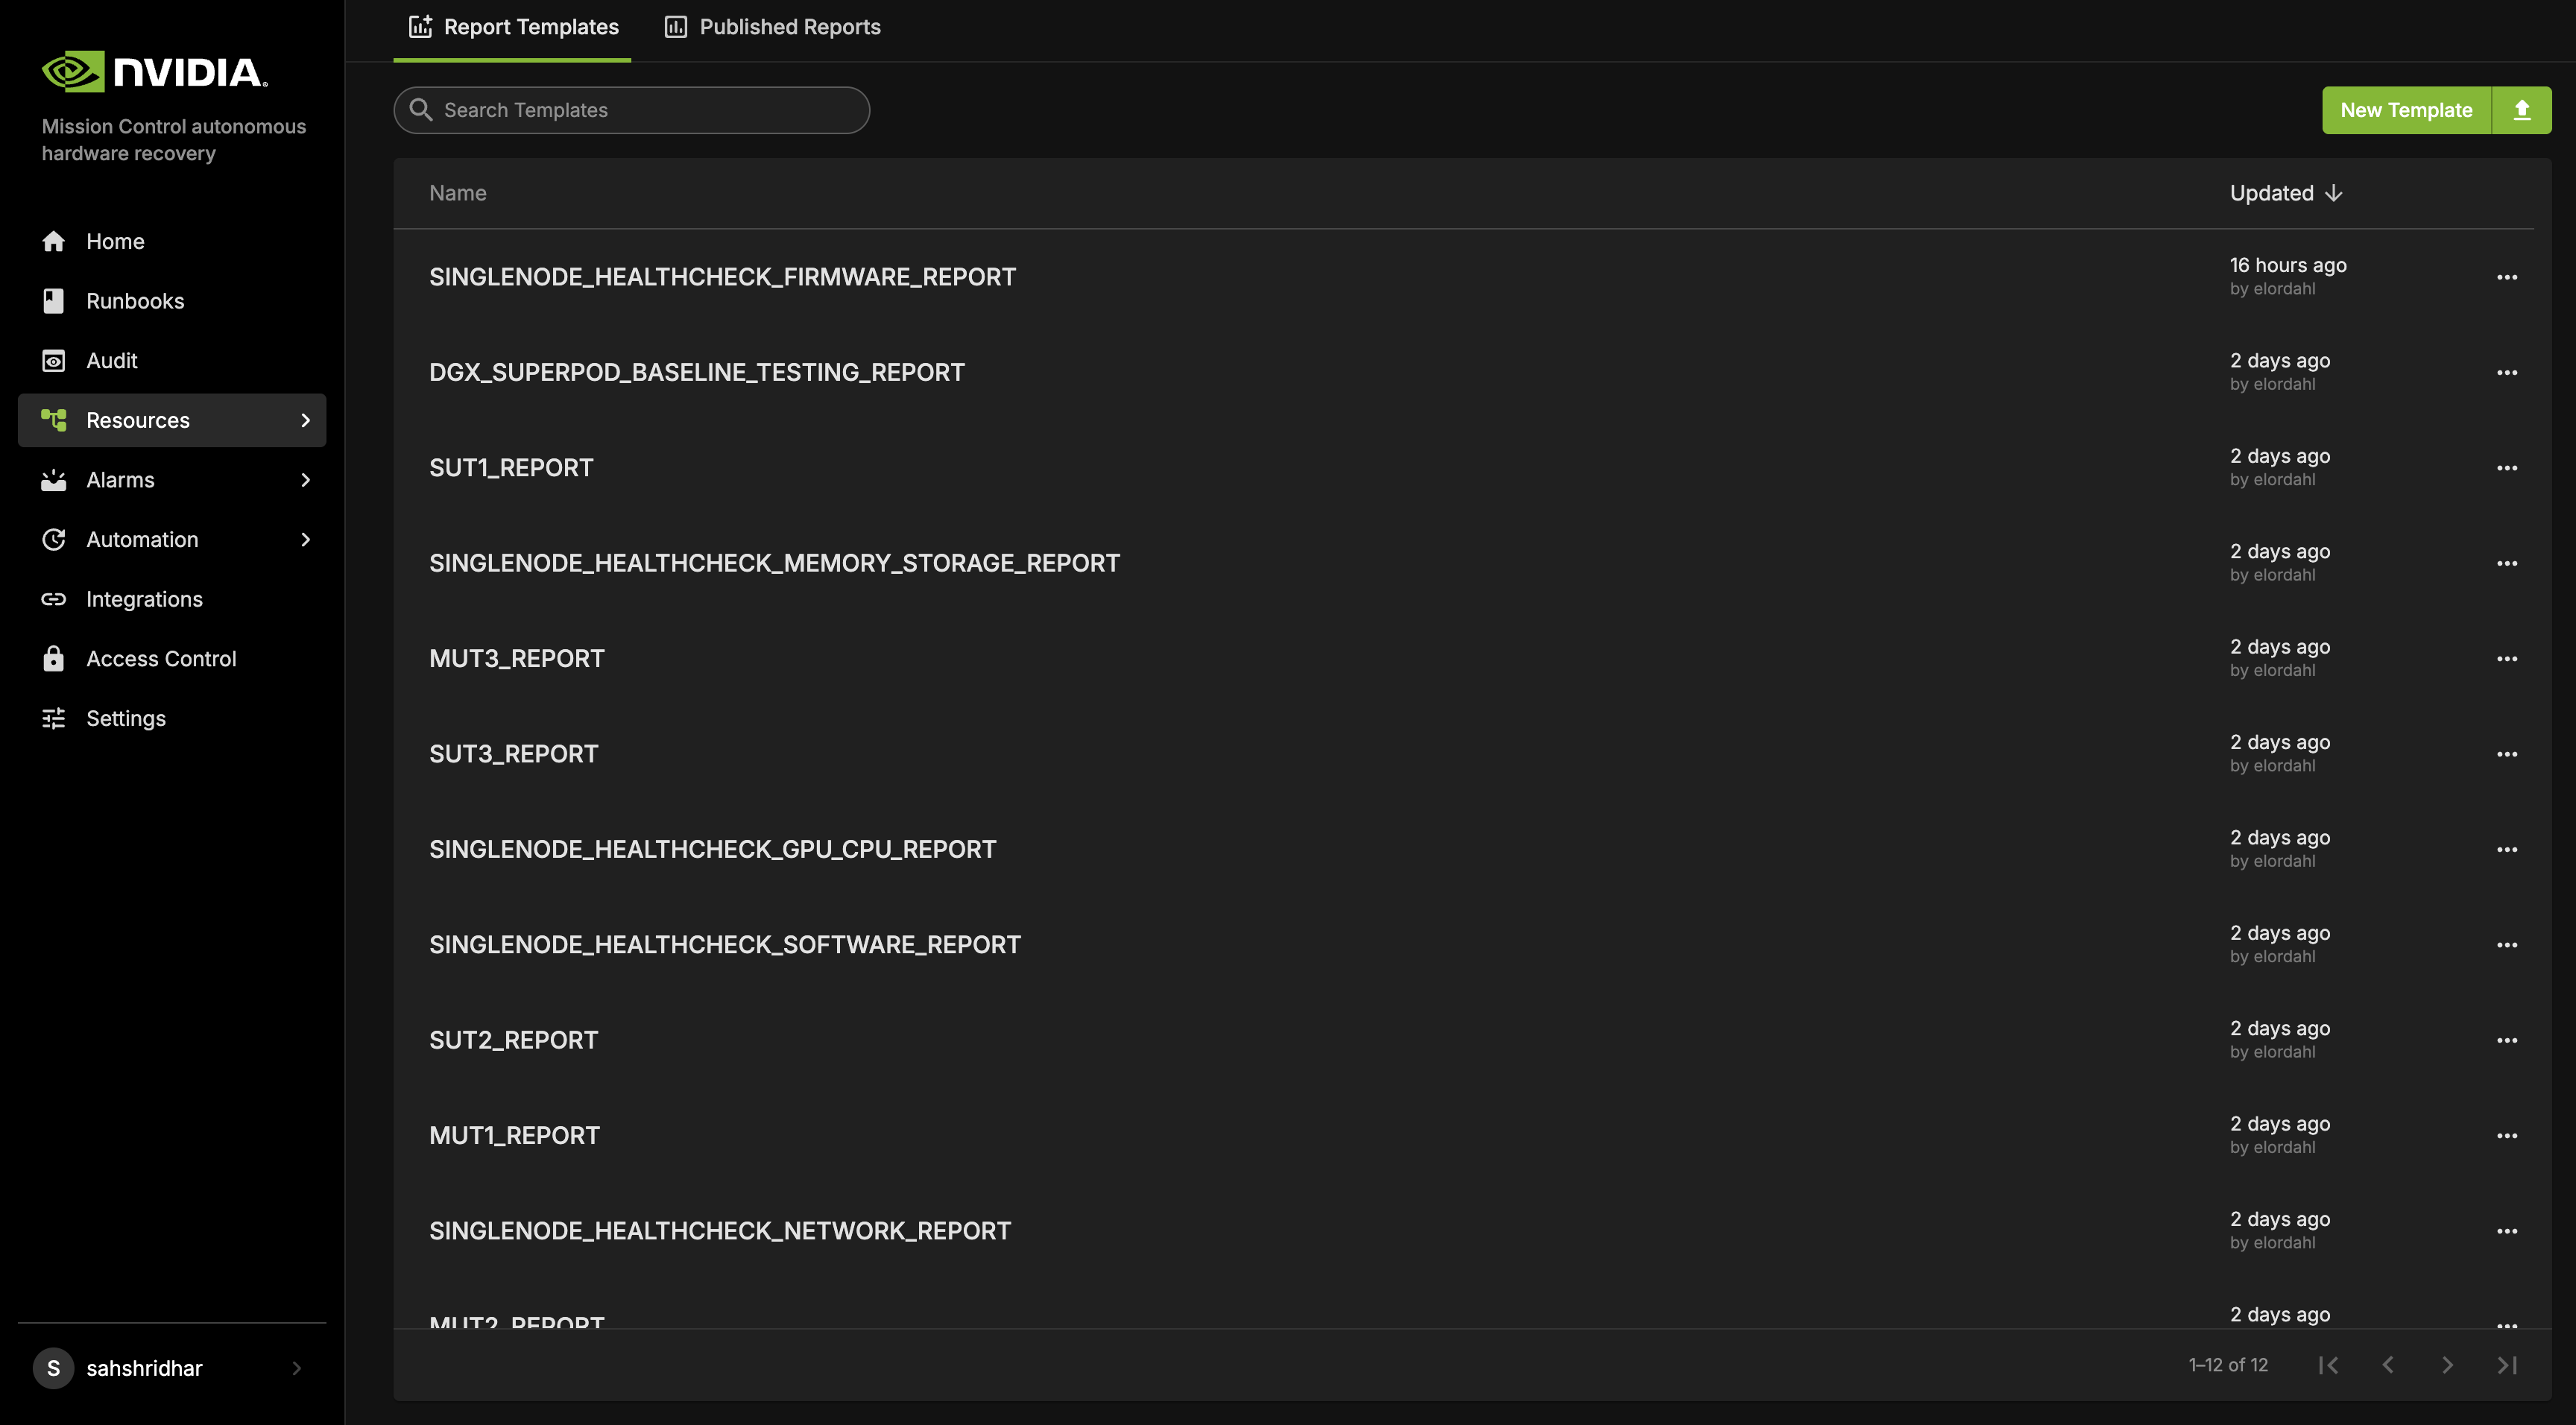
Report Templates provide templates for each stage of Baseline testing. These templates include bar graphs that display the PASS or FAIL status for different nodes during the tests. However, these templates are static and do not store any test data. This means that while you can view the templates, you cannot save or modify the test results within them.
To generate a report that records the test results along with timestamps, click Publish. This action will create a new report based on the template, which will capture the current status of the tests. The report will display PASS for tests that were successful and FAIL for those that did not pass, with each status reflecting the most up-to-date information. The report also includes links to additional reports at the top of the page. These links allow you to access the detailed results of the individual SUT and MUT tests that make up each stage, giving you a deeper insight into the performance and status of each test within the overall baseline testing process.
Note: Reports reflect updated information only after the SUT and MUT tests have been executed.
Guide to initiate Reporting for for Baseline Testing#
Navigate to the “DGX_SUPERPOD_BASELINE_TESTING_REPORT” under the Report Templates.
[Optional] While templates do not reflect the current status of the test suite, you can use it to view the current state before publishing the reports. Clicking the refresh button at the top of the report will load the current data.
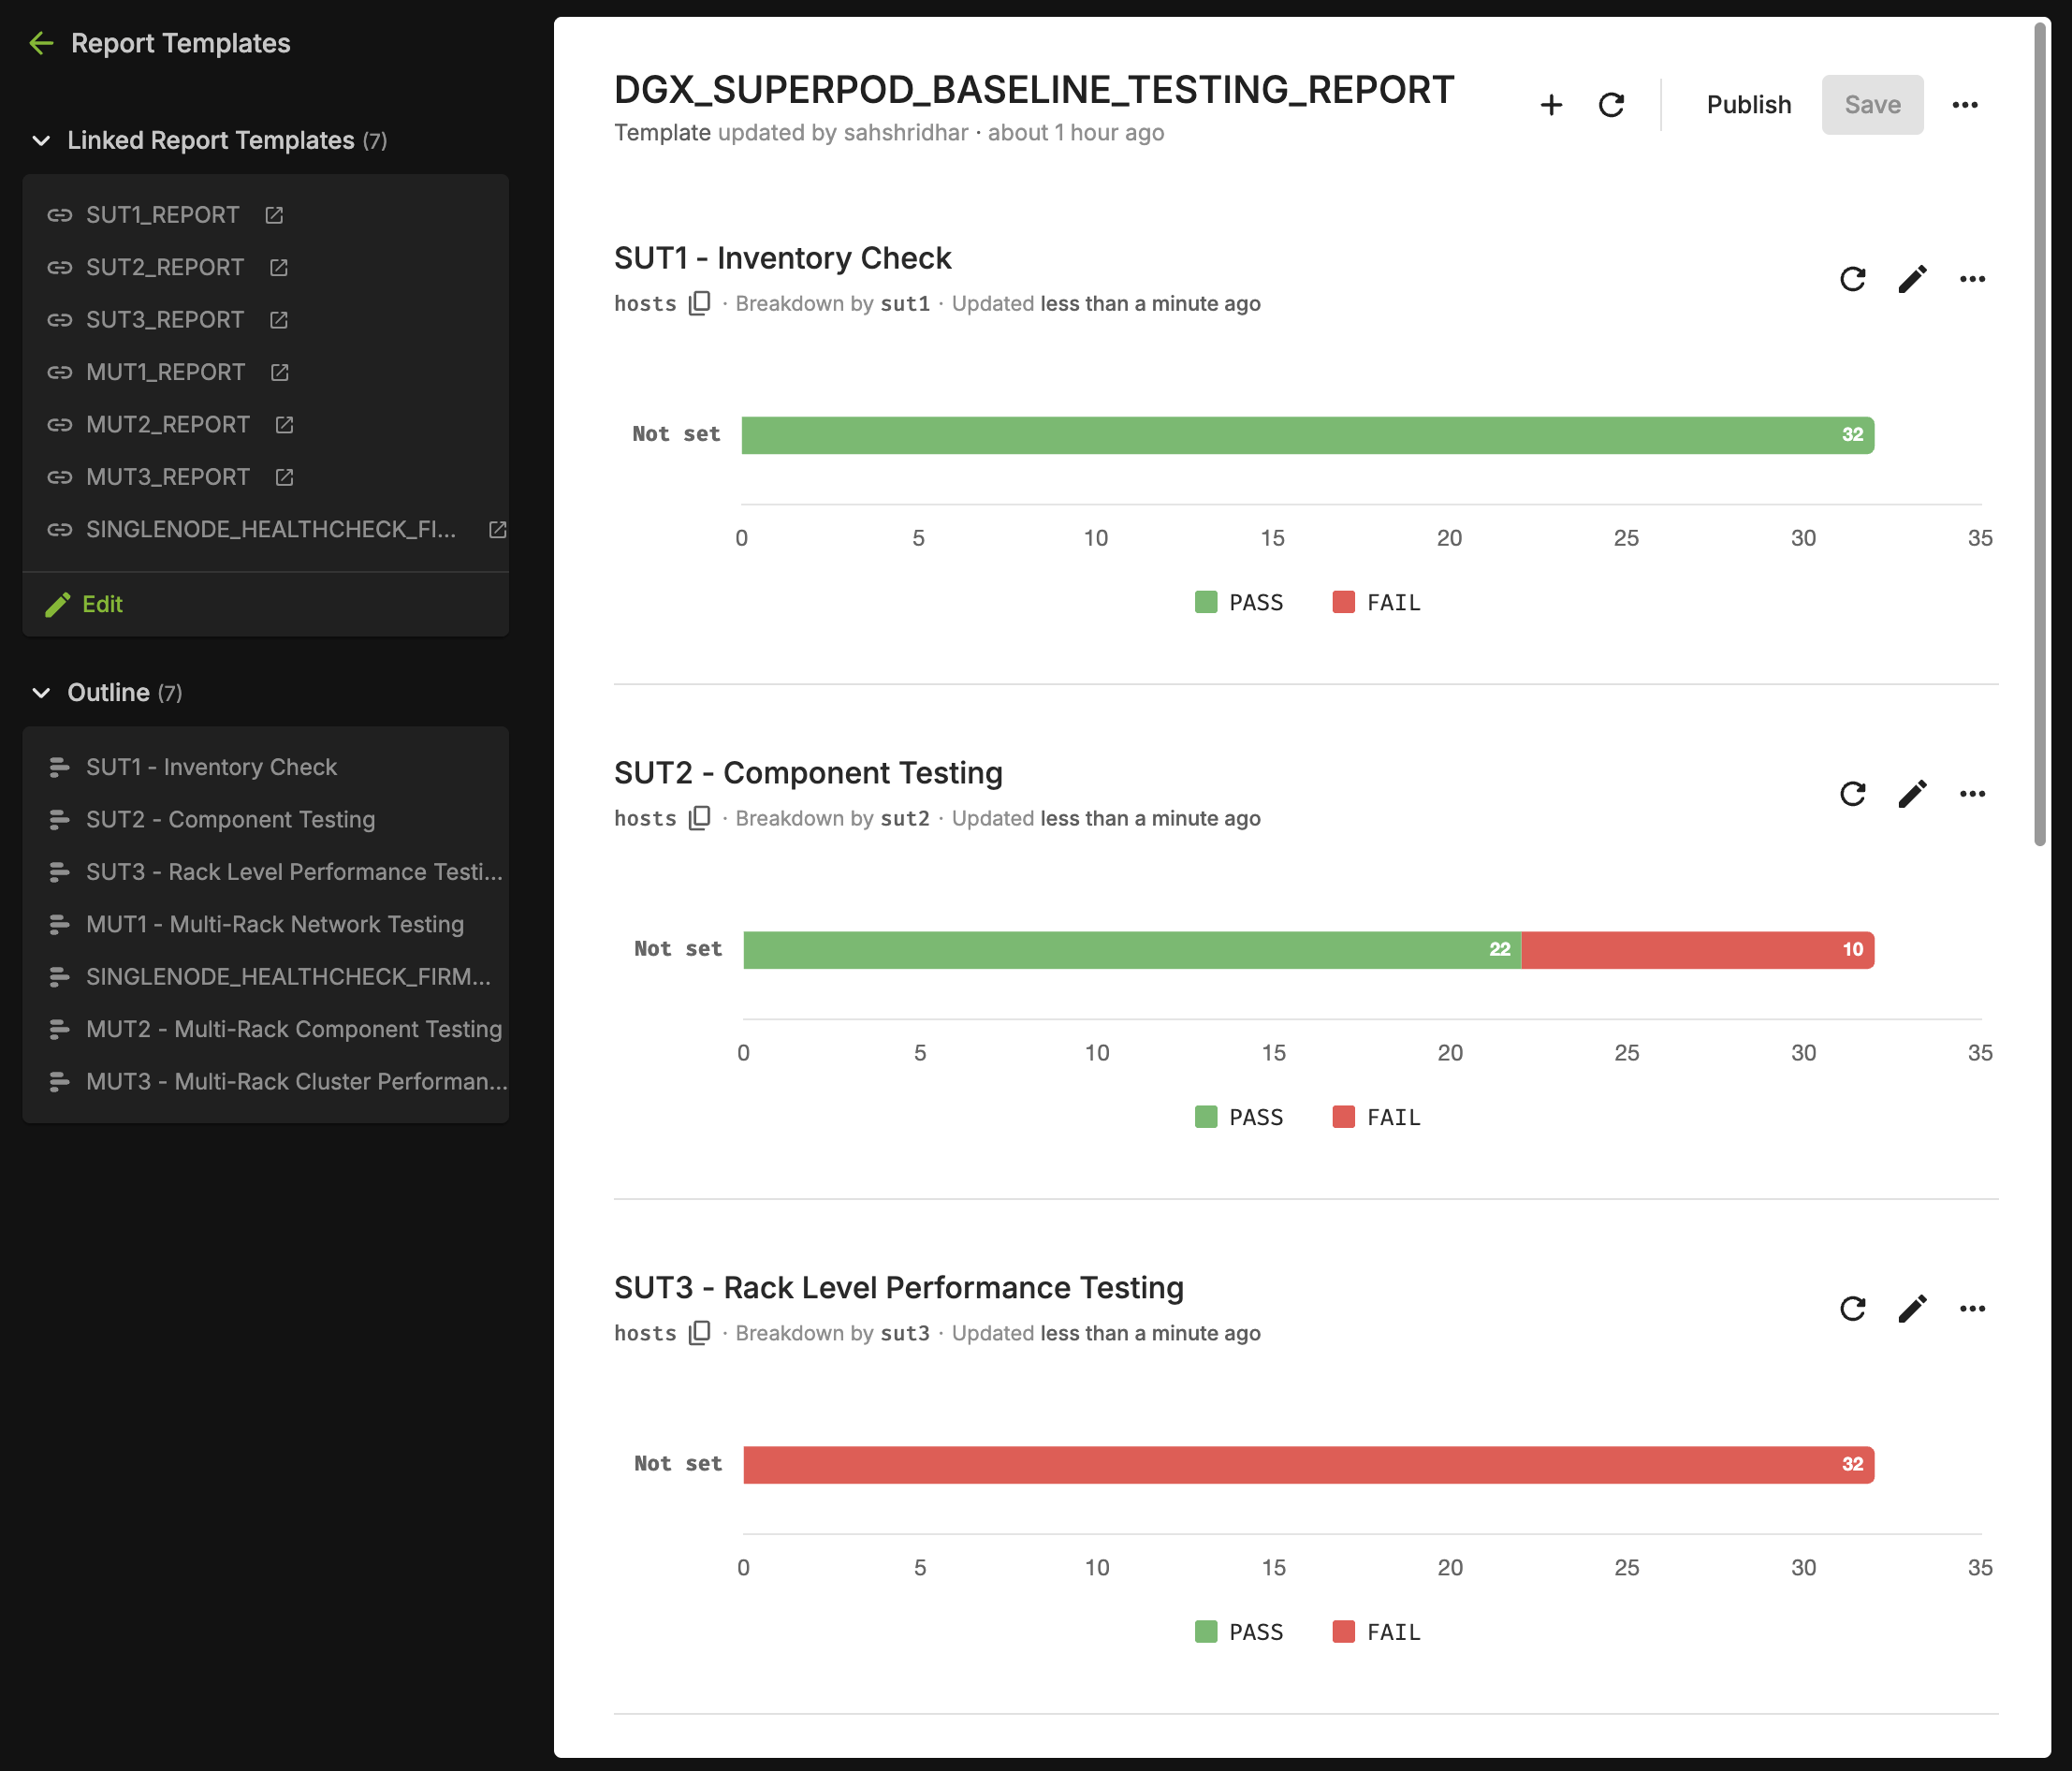
Click on “Publish” to generate a timestamped instance of the template that can be easily viewed and shared. Additionally, it automatically publishes all linked reports at the top of the page, ensuring that all related data is included and accessible.
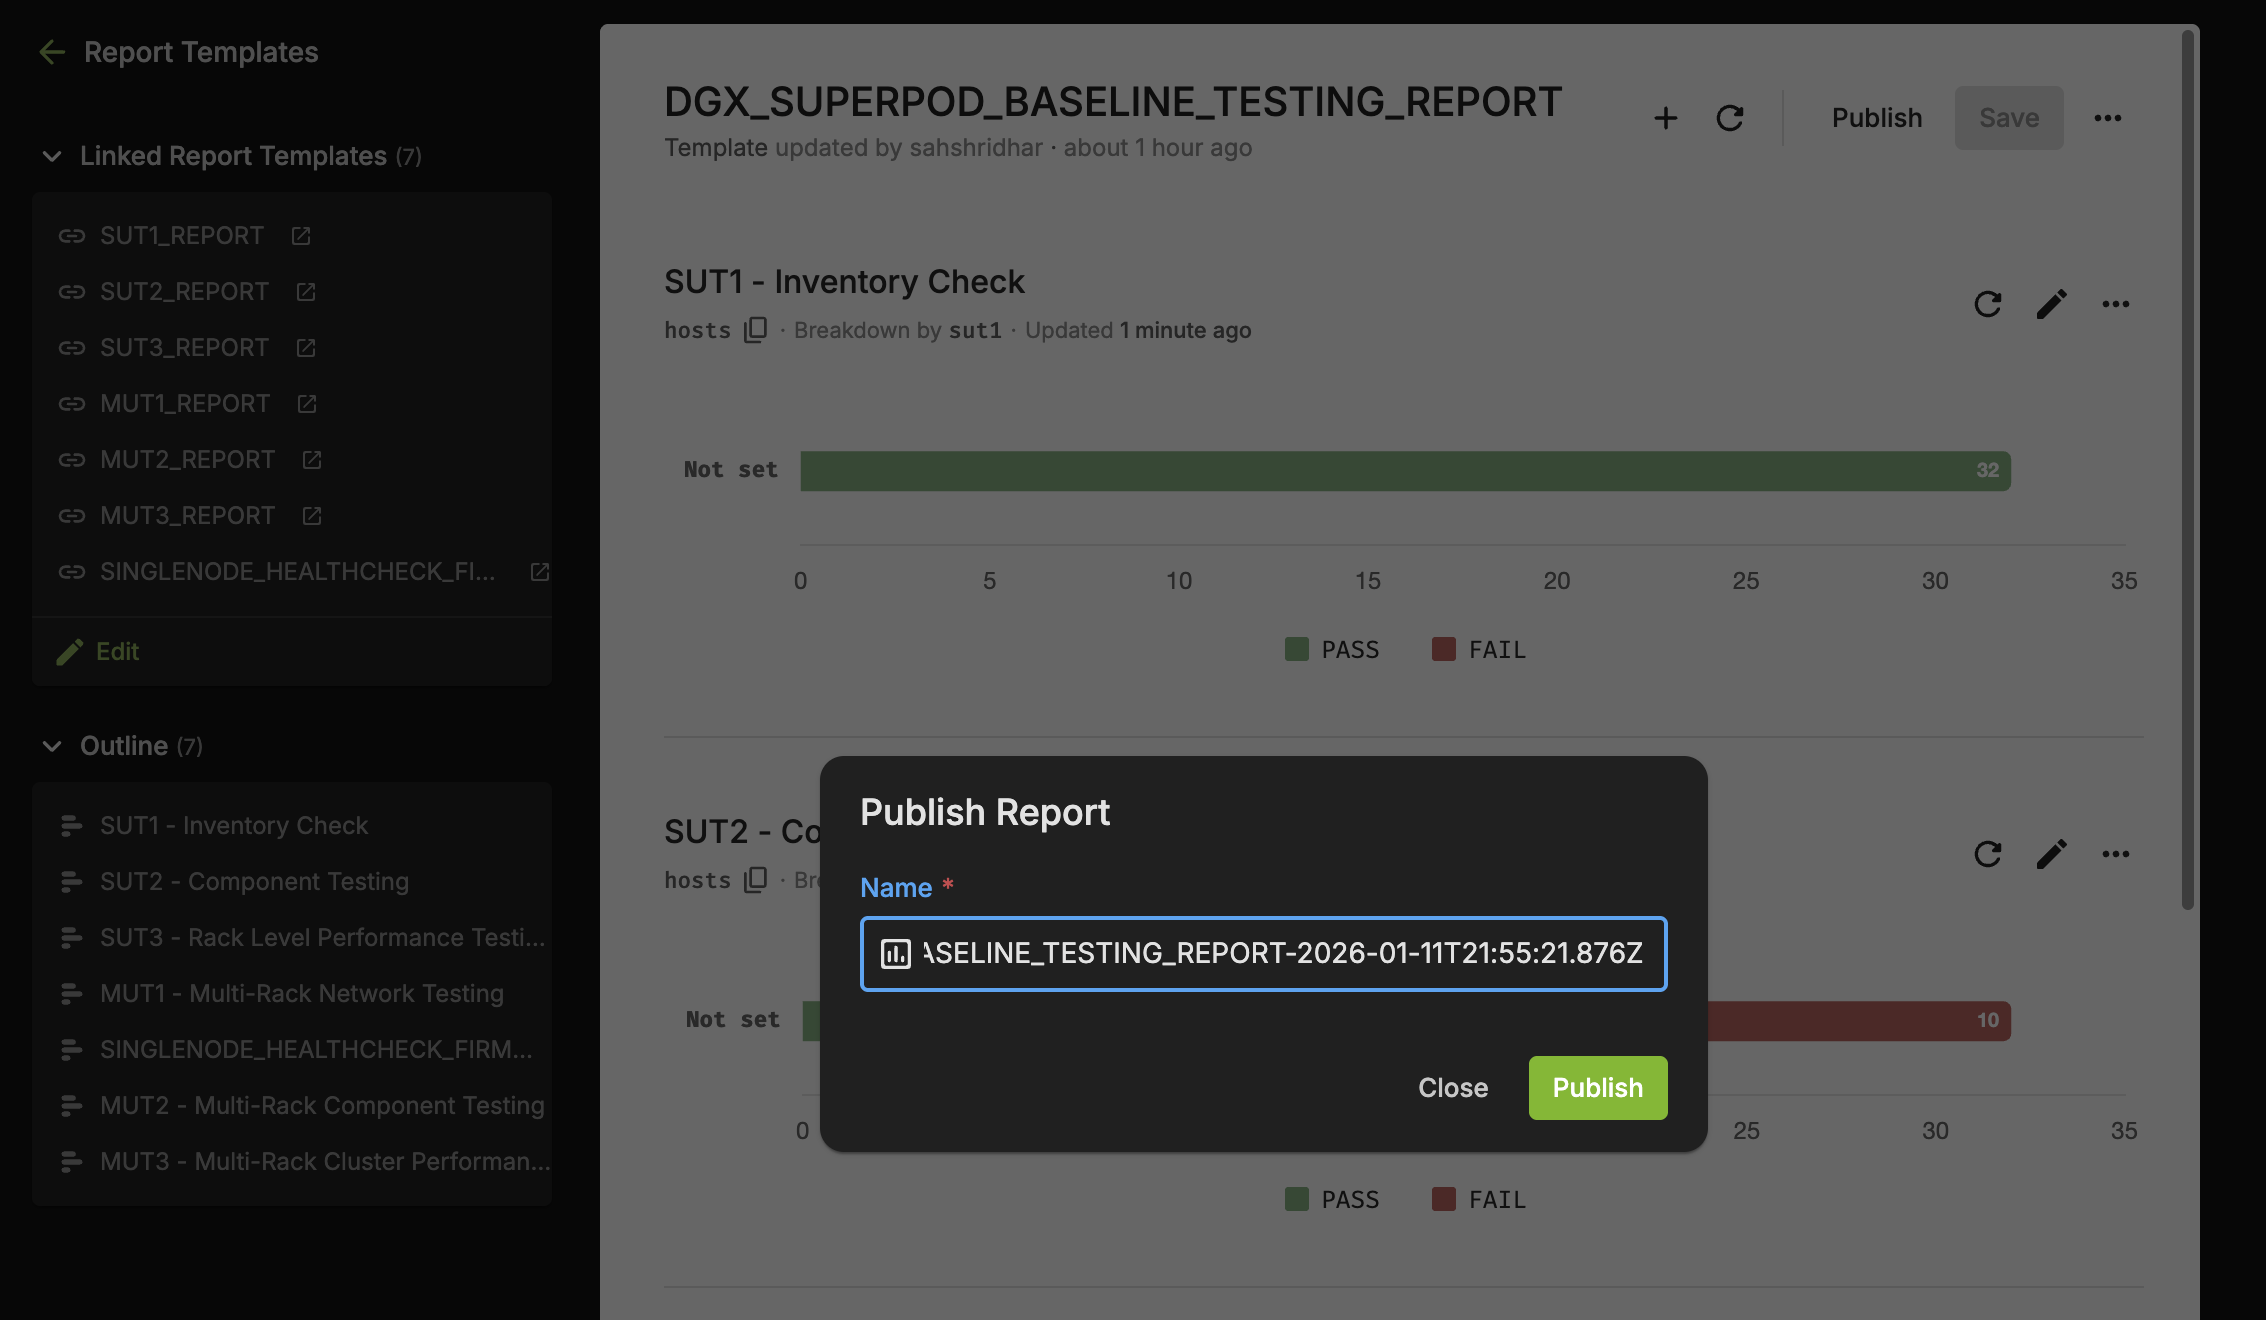
Retain the auto-generated name for the report which includes the timestamp or provide your own name.
Once the process starts, the published reports will begin generating in the background. This includes “DGX_SUPERPOD_BASELINE_TESTING_REPORTS” as well as all the SUT and MUT linked reports.
A pop-up notification will appear containing a hyperlink to access the published reports that are being currently generated.
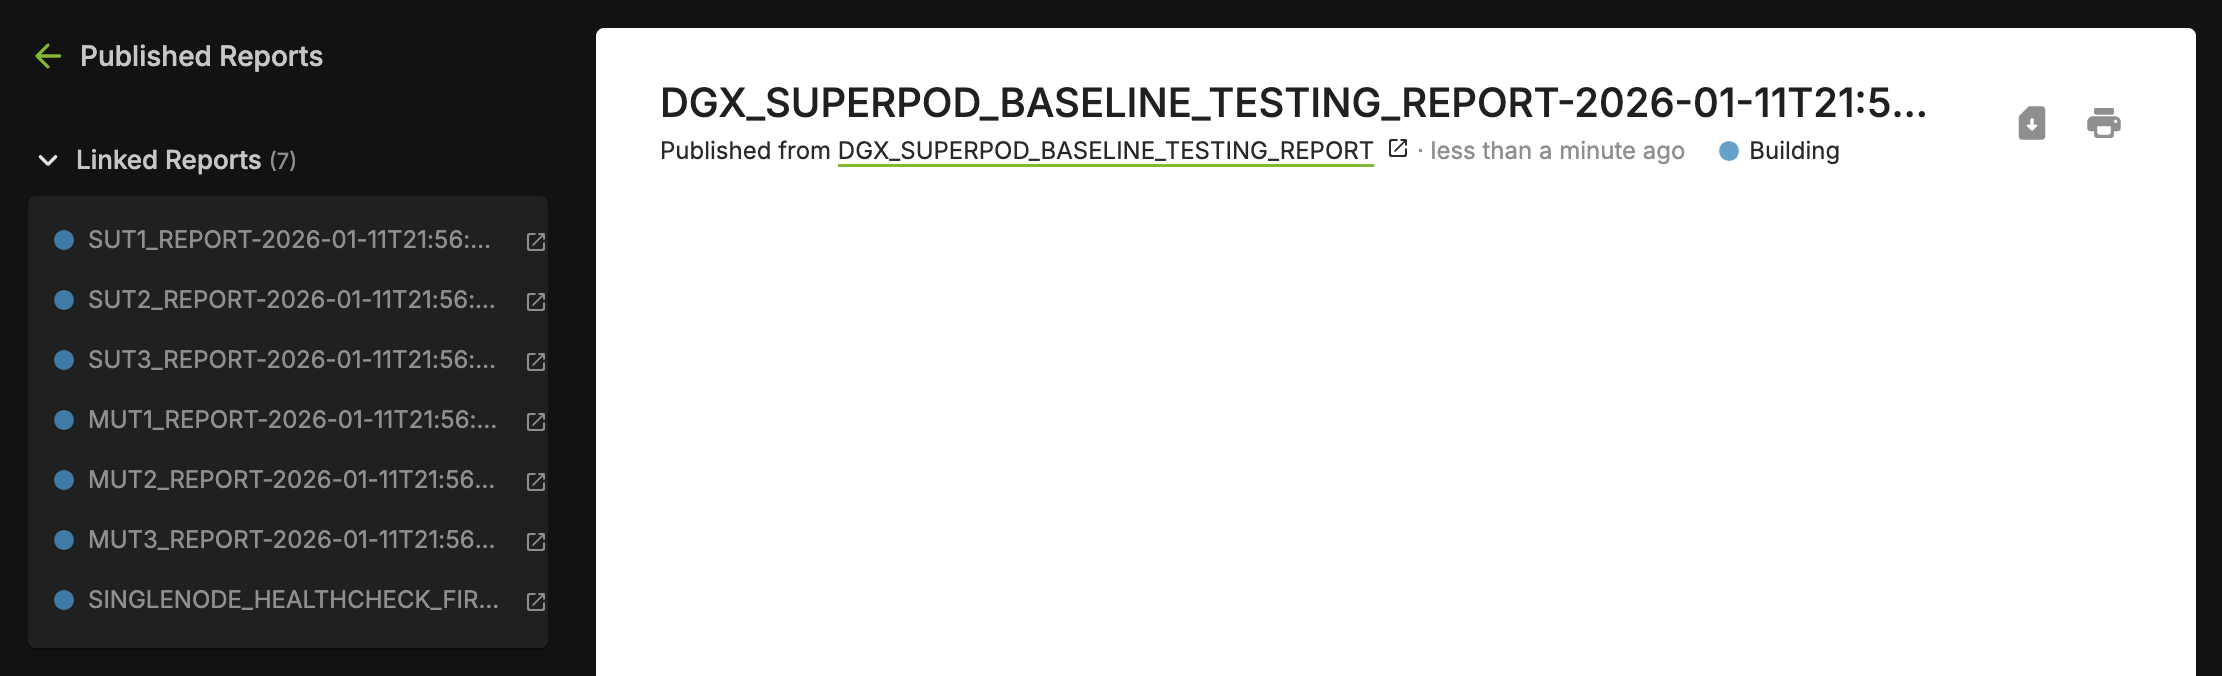
When you publish the “DGX_SUPERPOD_BASELINE_TESTING_REPORTS”, it automatically triggers the publication of all “linked reports”, including the associated SUT and MUT reports, with the data captured at that given time.
All the reports will complete building in under a minute, and the “Linked Published Reports” will include the published reports for all the Linked Reports.
Navigating to Previously Published Reports#
Navigate to the Reports from the NVIDIA Mission Control autonomous hardware recovery Home Page
Click on “Published Reports”, and select the “DGX_SUPERPOD_BASELINE_TESTING_REPORT_timestamp” or any other report of interest.
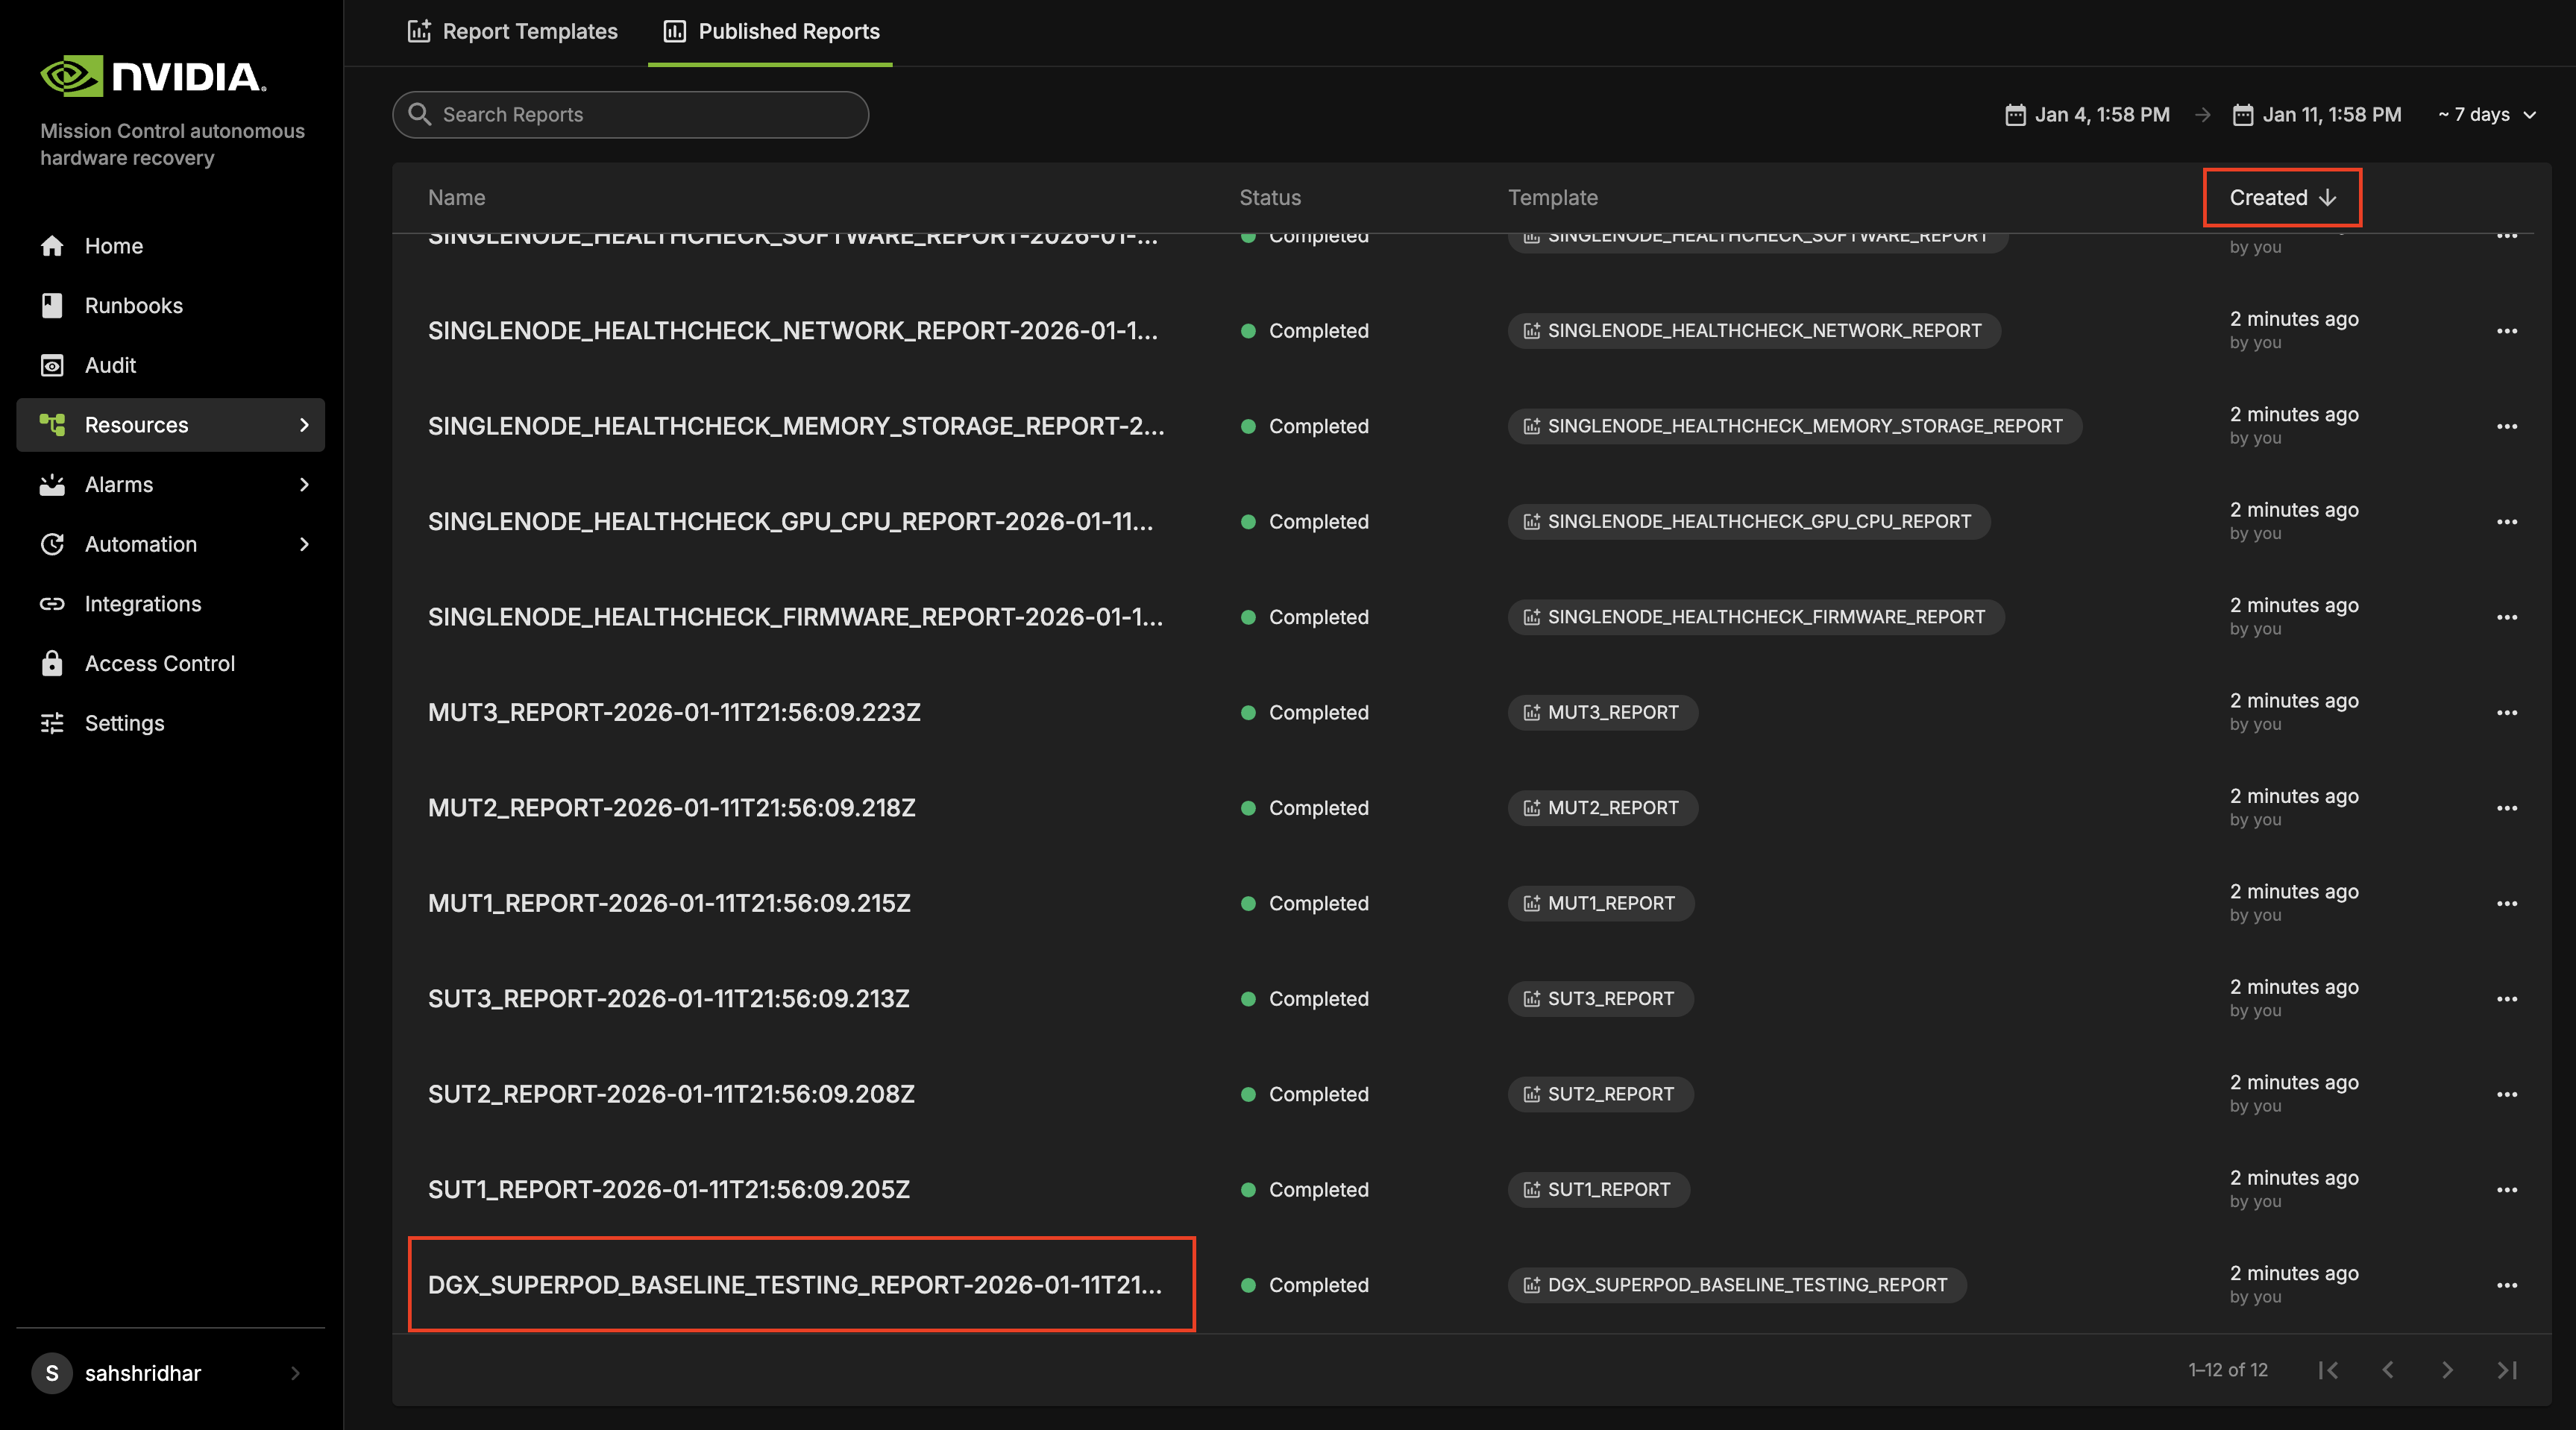
You can also adjust the time range at the top of the screen to view reports generated within specific time frames. Options include viewing reports from the last 10 minutes, last 1 hour, or selecting a custom time range to explore older data beyond these periods.
Breakdown of a Published Report#
DGX_SUPERPOD_BASELINE_TESTING_REPORT#
“DGX_SUPERPOD_BASELINE_TESTING_REPORT”, is the entry point for the Baseline Testing reports. It provides a comprehensive overview of all the SUT/MUT tests for the compute nodes.
Each stage is represented by a separate cell, displaying the results for that specific SUT or MUT test.
To perform a deeper analysis or understand the tests in each stage, click on the relevant report listed under “Linked Published Reports” at the top of the page.
Similarly, all the reports for each stage are available. You can either find the report of interest from Published Reports, or traverse it from the parent report (DGX_SUPERPOD_BASELINE_TESTING_REPORT_<timestamp> )
Understanding the Published Reports#
The reports align up with the SUT and MUT tests. Each cell in “DGX_SUPERPOD_BASELINE_TESTING_REPORT” represents a specific testing stage such as SUT1, SUT2 etc. Within each of these “Linked Reports”, the cells represent individual tests such as Singlenode Healthchecks, HPL, NCCL etc. The layout of the graph for each of the cells is organized as follows:
The X-axis represents all the nodes.
The Y-axis is not defined, which groups all the nodes into a single bar in the bar chart.
For example, in the following visualization, each bar represents the number of nodes within a cluster. In this case, there are 32 nodes per cluster, as indicated by the number displayed on each bar. This provides a clear view of the test progress for each tray across different clusters.
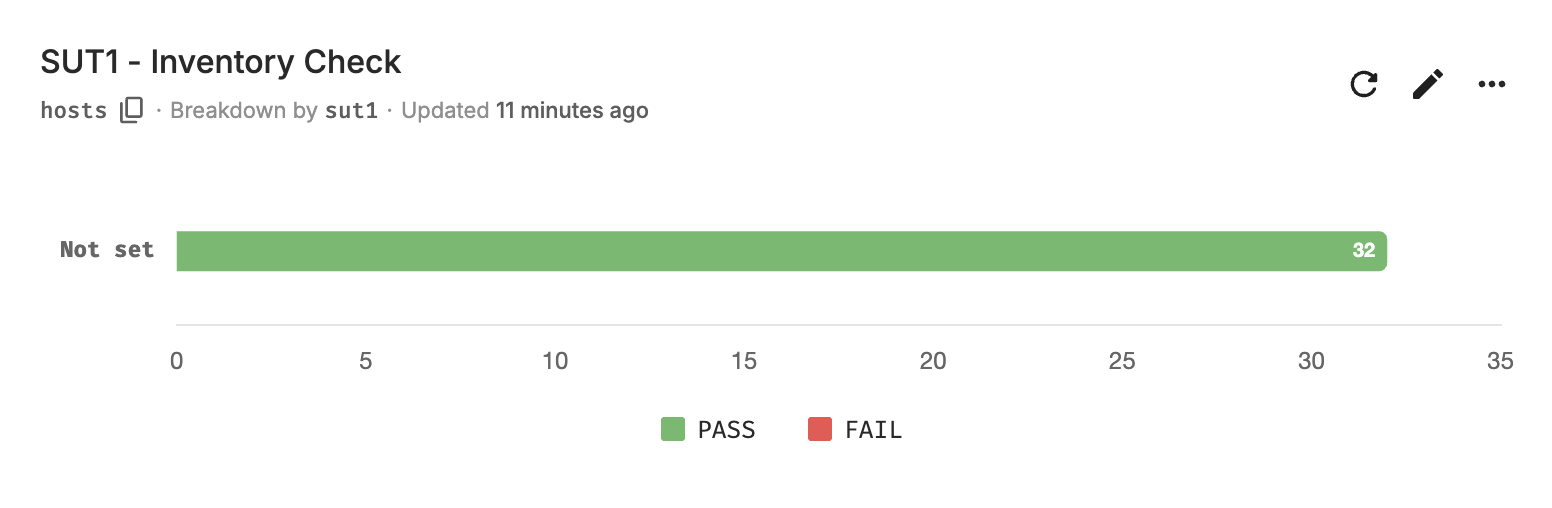
You can click on any bar in the graph to view a detailed list of the resources that passed or failed the tests within that specific bar. This allows you to drill down and see the test results for each tray in a particular rack or test stage.
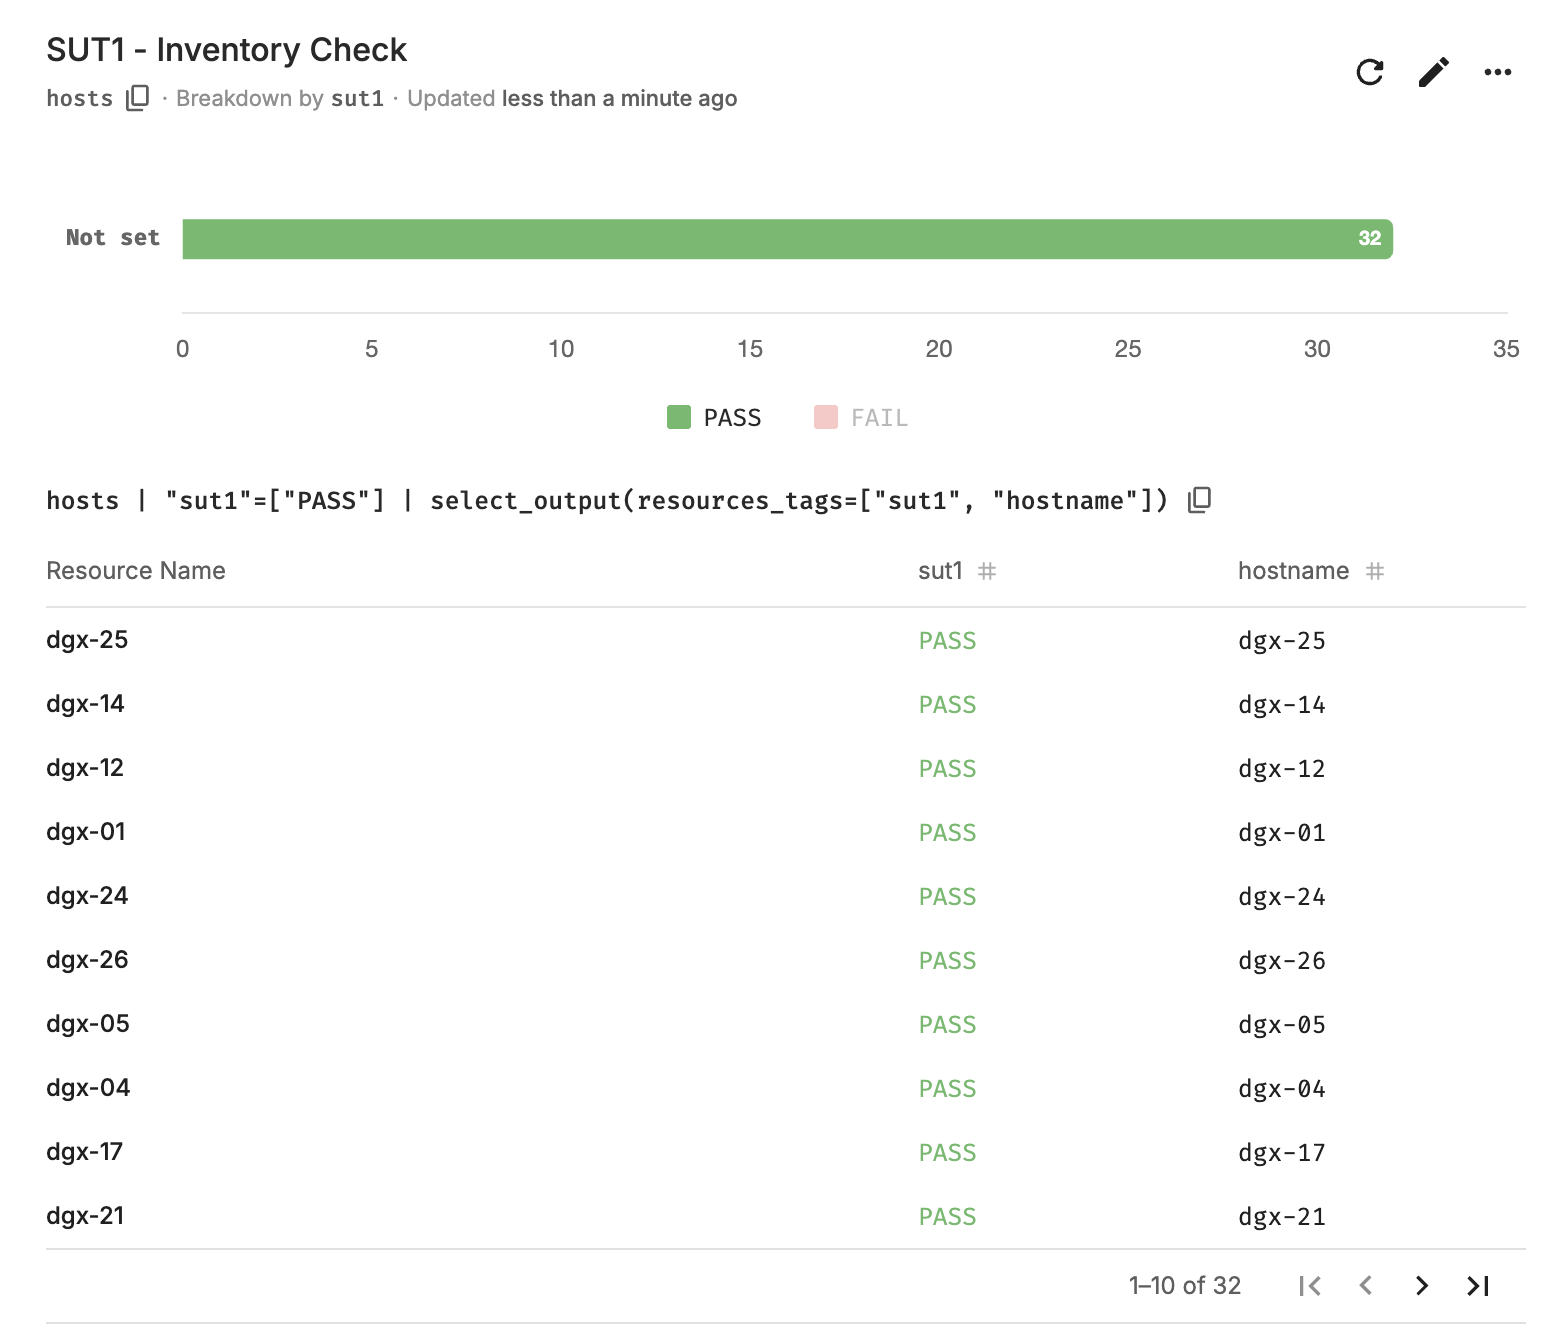
Alternatively, you can click on the legend to filter and display all the passed or failed resources across the entire cluster, providing a comprehensive view of the overall test status.
Root Cause Analysis#
The report for each stage shows the trays that have passed and failed the test. To understand the actual issue and access the logs, you can follow these steps:
Navigate to the report with PASS/FAIL values that you are interested to conduct an RCA. In this example, lets consider SUT1 report where there are a few failed tests for SINGLENODE_HEALTHCHECK_GPU_CPU.
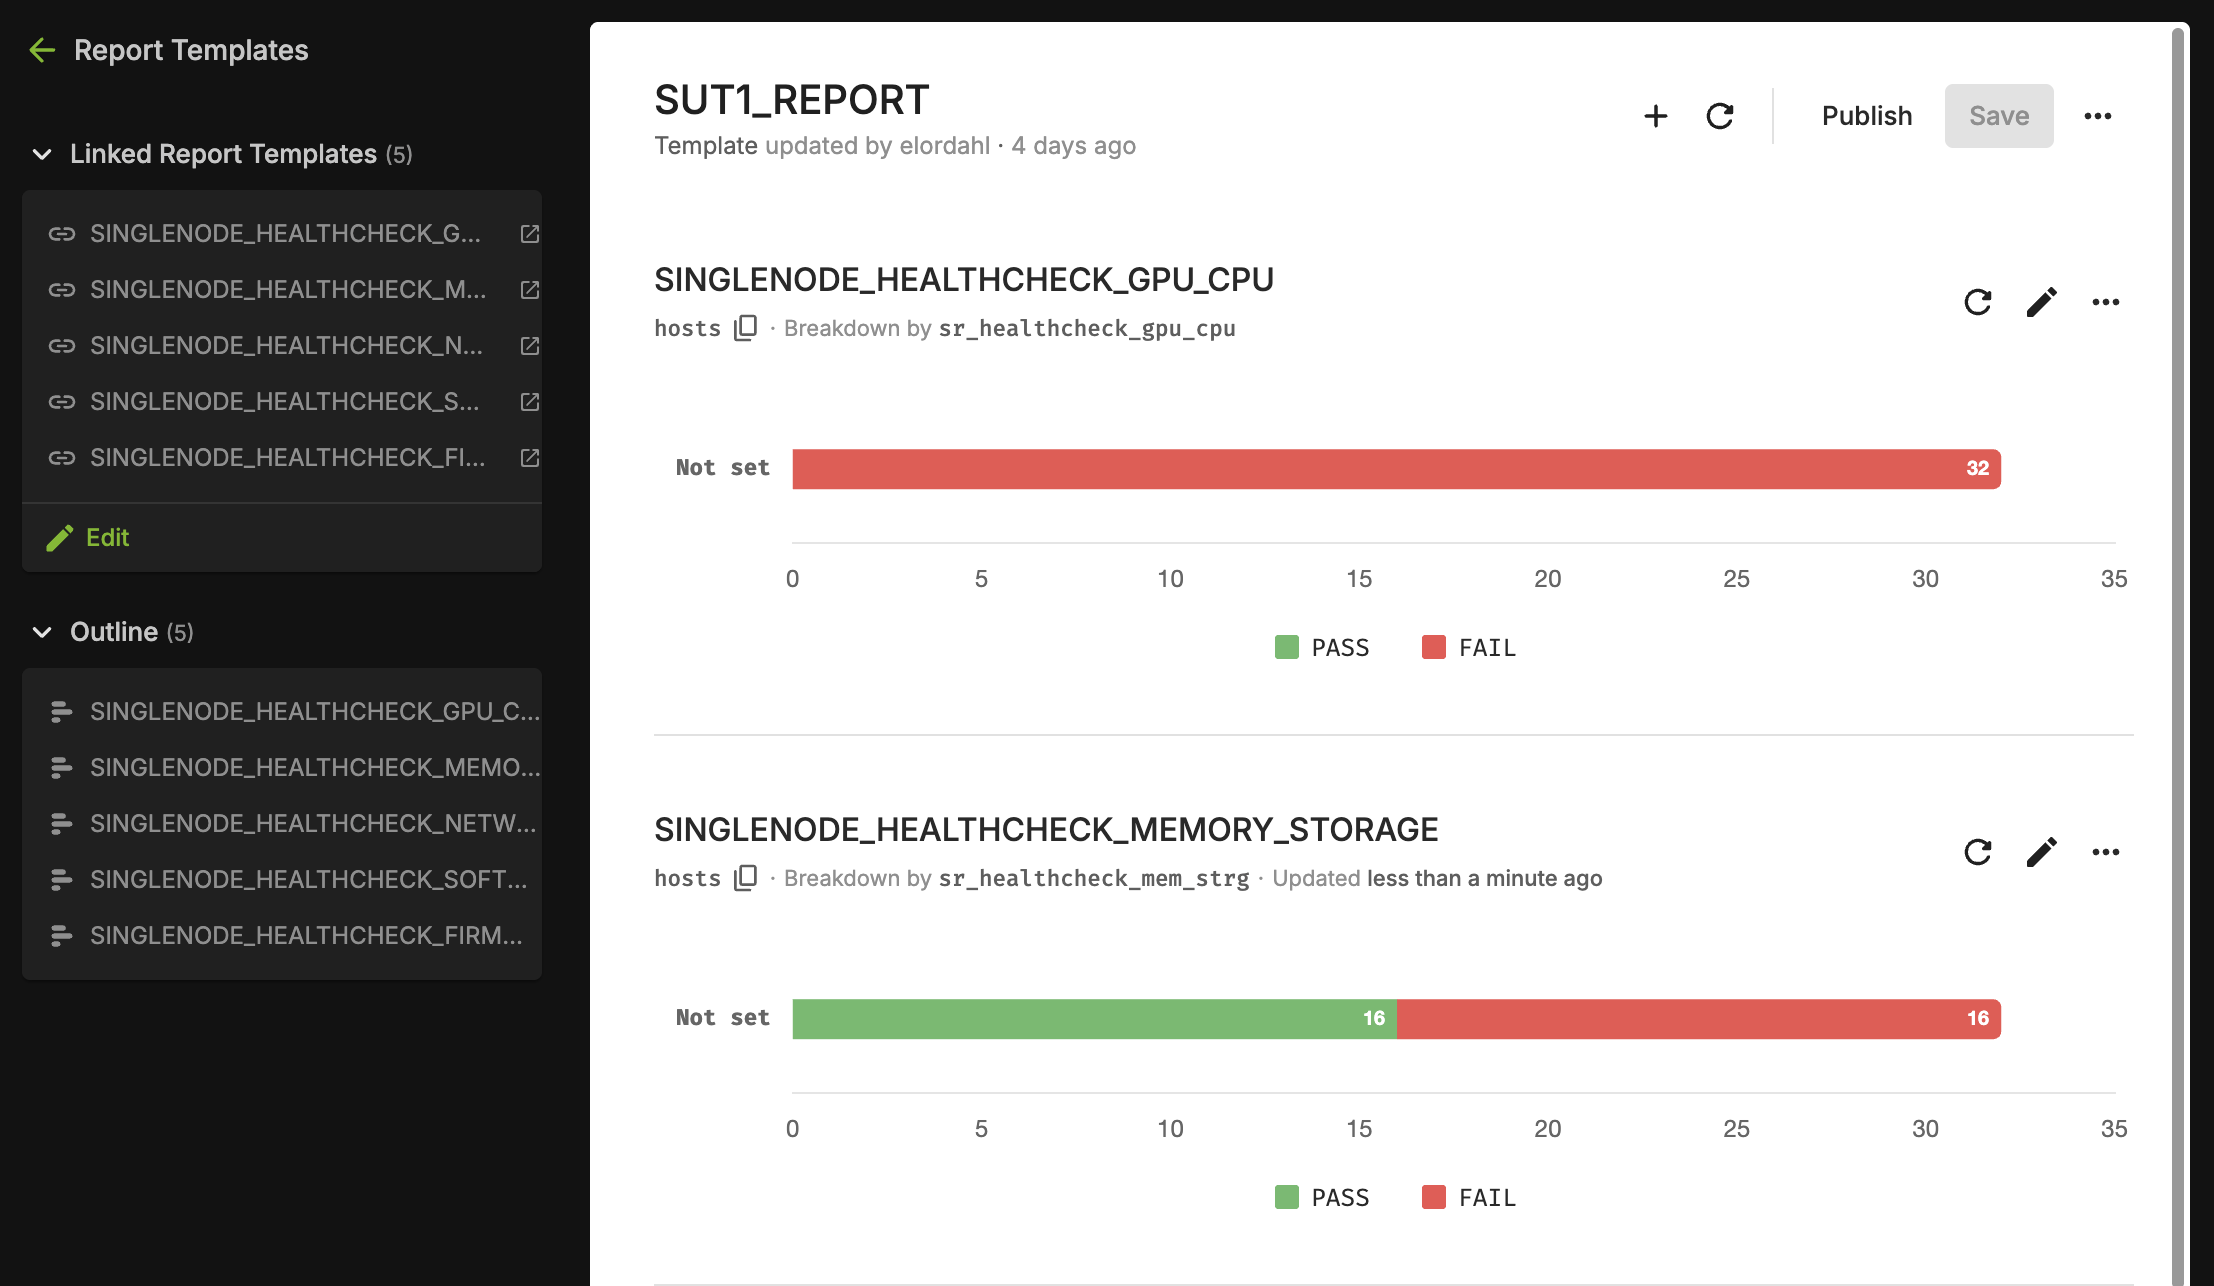
Navigate to the report corresponding to SINGLENODE_HEALTHCHECK_GPU_CPU and scroll to the tests that are failing.
In this example, GPU Inforom Version has failed on 17 nodes. Click on the bar for one of the nodes to list the resources that the test failed on.
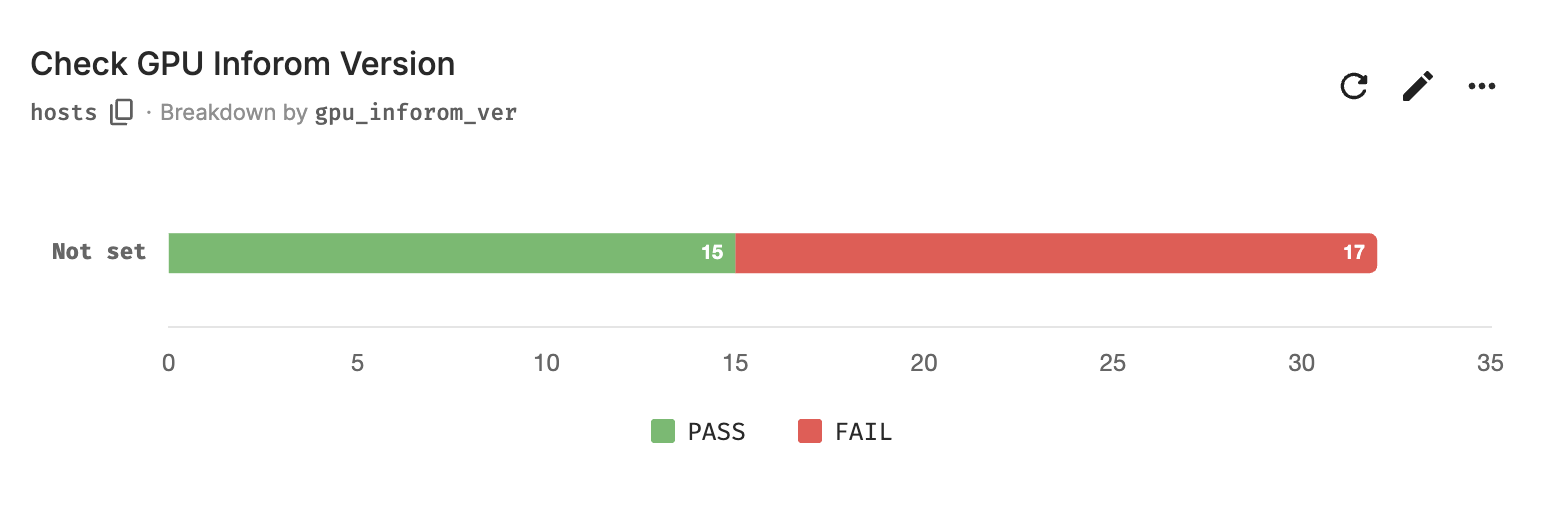
Click on the status (FAIL) which directly links you to the runbook where these tests failed. You can also do the same for tests that passed by clicking on the PASS status.
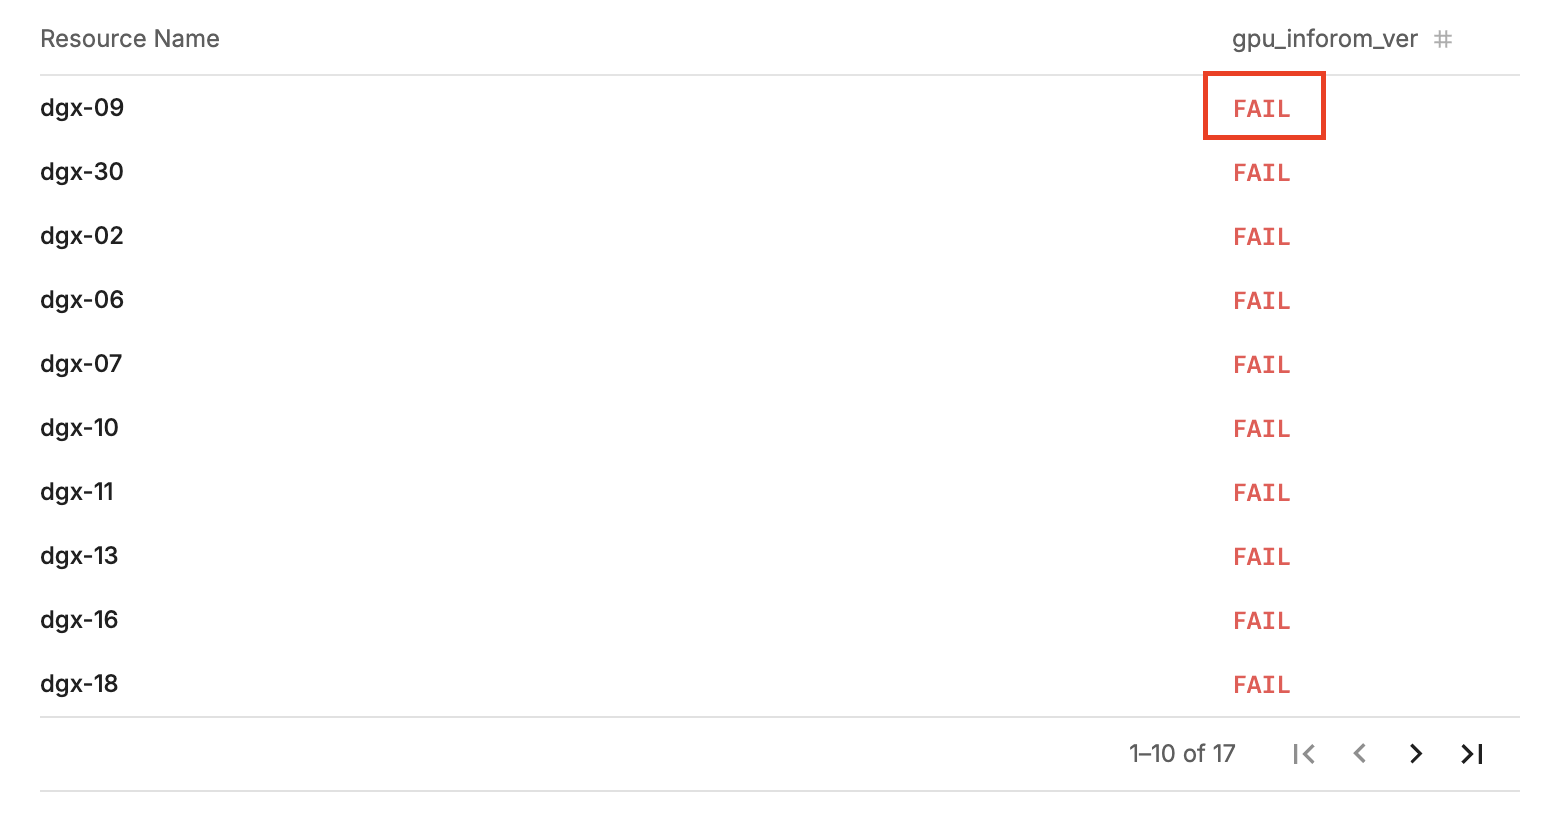
The errors in the runbook are outlined to the left of the screen. Navigate to the test that we are debugging (Inforom Version). Alternatively, you can also scroll through the run to find the failed tests.
Click on the “Command filter excluded x/y resources” to get detailed output for each resource.
Click on the Output to view the detailed logs
Firmware Reports#
For Firmware Checks, NVIDIA Mission Control autonomous hardware recovery offers a tabular report detailing the status of each node. The report includes:
Pass/Fail Status: Indicates whether the firmware check for each node passed or failed.
Expected Version: Shows the firmware version that was expected for the node.
Current Version: Displays the actual firmware version currently installed on the node.
Navigating to Tabular Report for Firmware Checks#
You can access the SINGLENODE_HEALTHCHECK_FIRMWARE_<timestamp> report either through the Runs (Check Job Status and Result) section or by navigating to the Runs History (see Root Cause Analysis).
Scroll to the last cell of the execution and click on the output of the cell.
You can scroll horizontally and vertically to view the complete output. Additionally, you have the option to download the cell output for further analysis.
You can also navigate to the Reports section and view the tabular output by clicking on the status bar. This includes both the expected firmware version and the current firmware version.
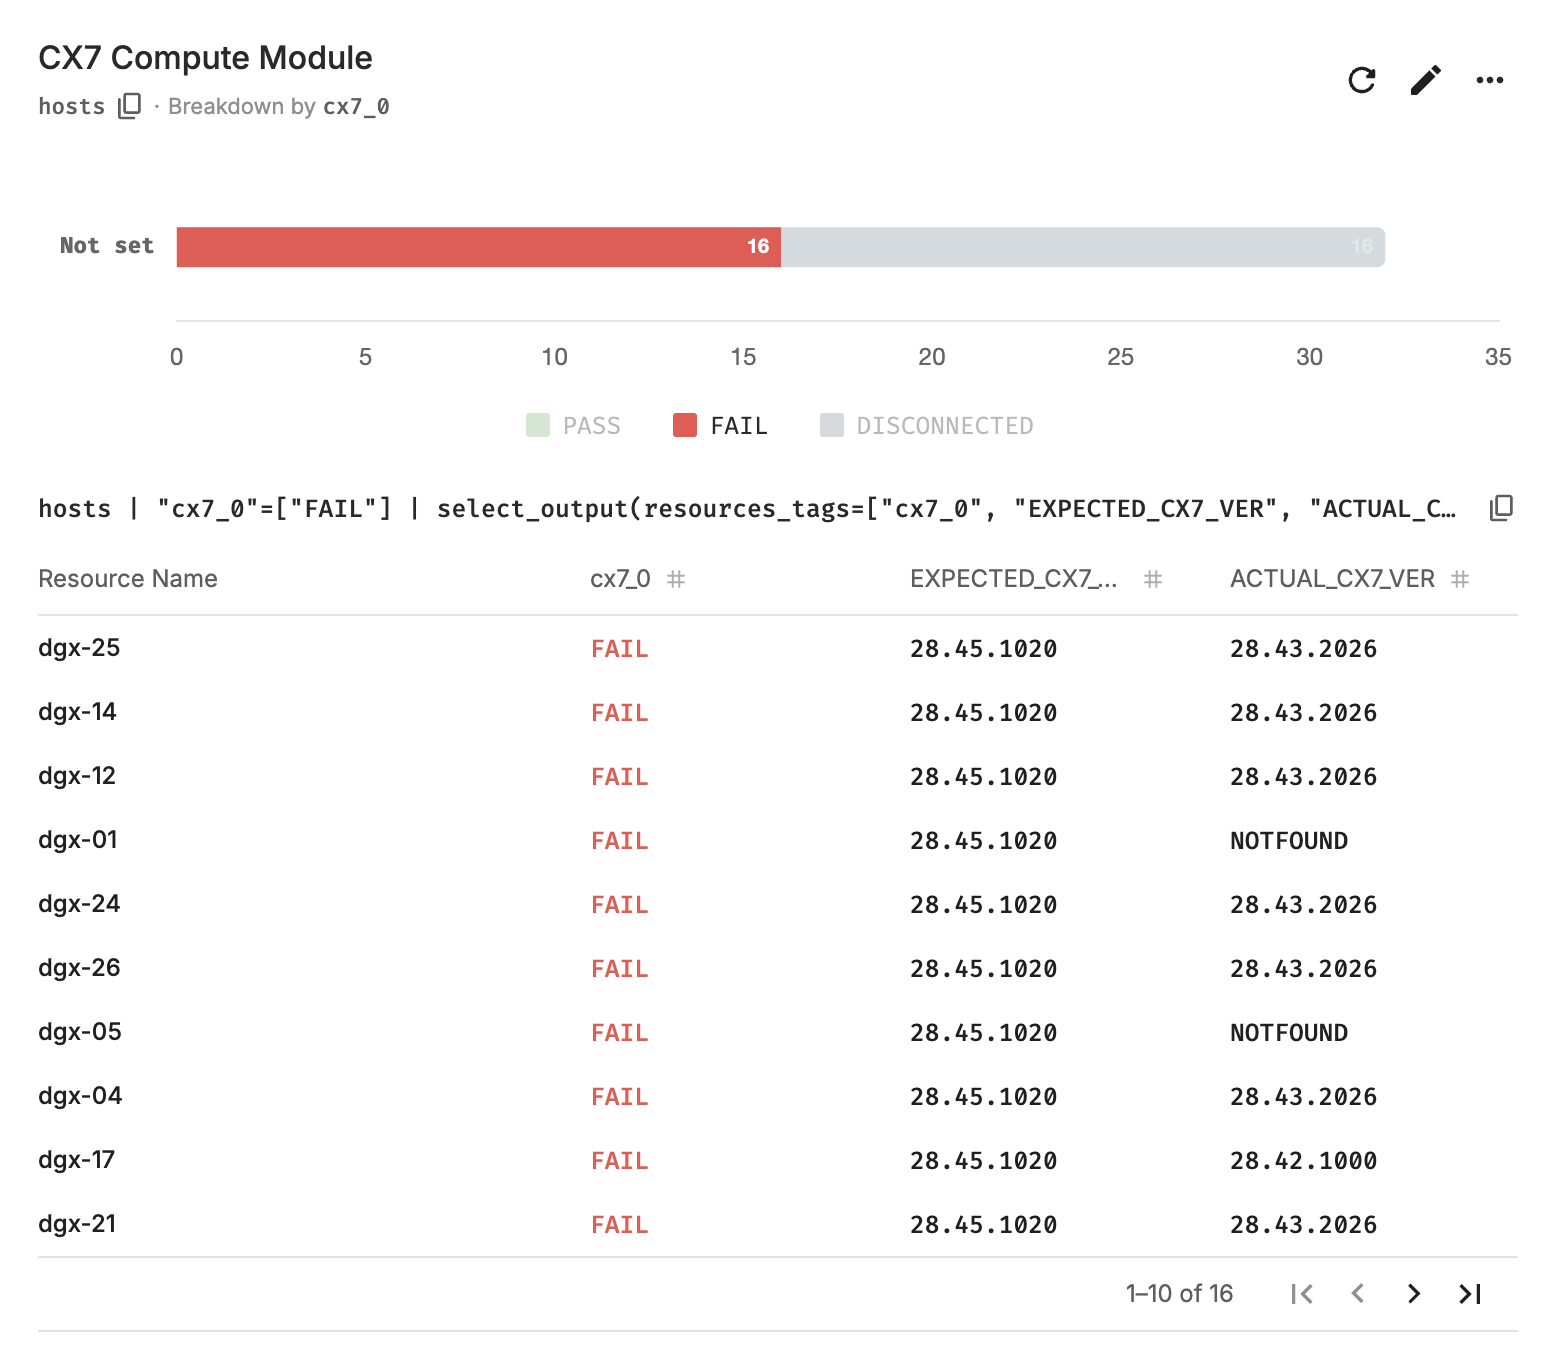
Resource Dashboard#
NVIDIA Mission Control autonomous hardware recovery dashboard provides a comprehensive view of the status of all resources in the cluster, displaying the progress of testing at various stages for each node (control, compute and switch nodes). It shows which tests are completed, which ones have passed, and which have failed. This allows users to easily track the overall health and status of the cluster, identify any issues, and assess the readiness of each resource.
Navigating to the Resource Dashboard#
Visit the NVIDIA Mission Control autonomous hardware recovery homepage, navigate to the ‘Resources’ menu, and click on ‘Dashboards’ to access the dashboard page.
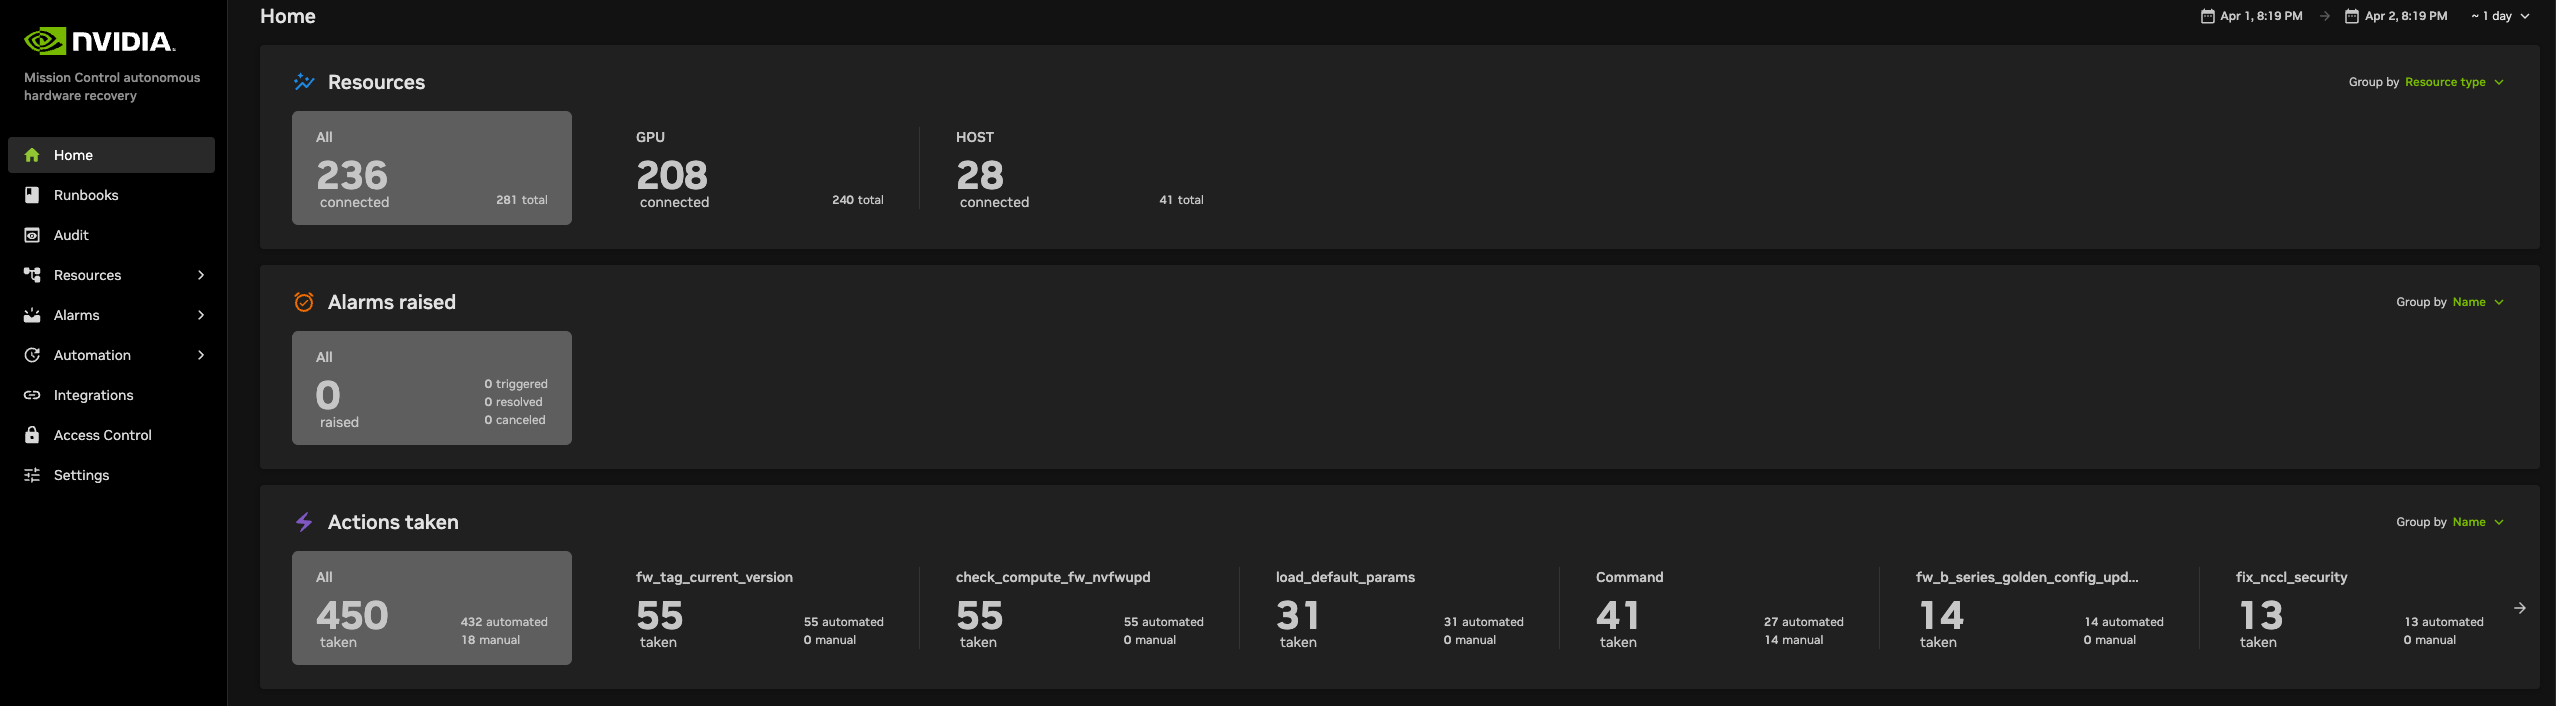
The Landing page contains two tabs: Dashboards and Dashboard Views.
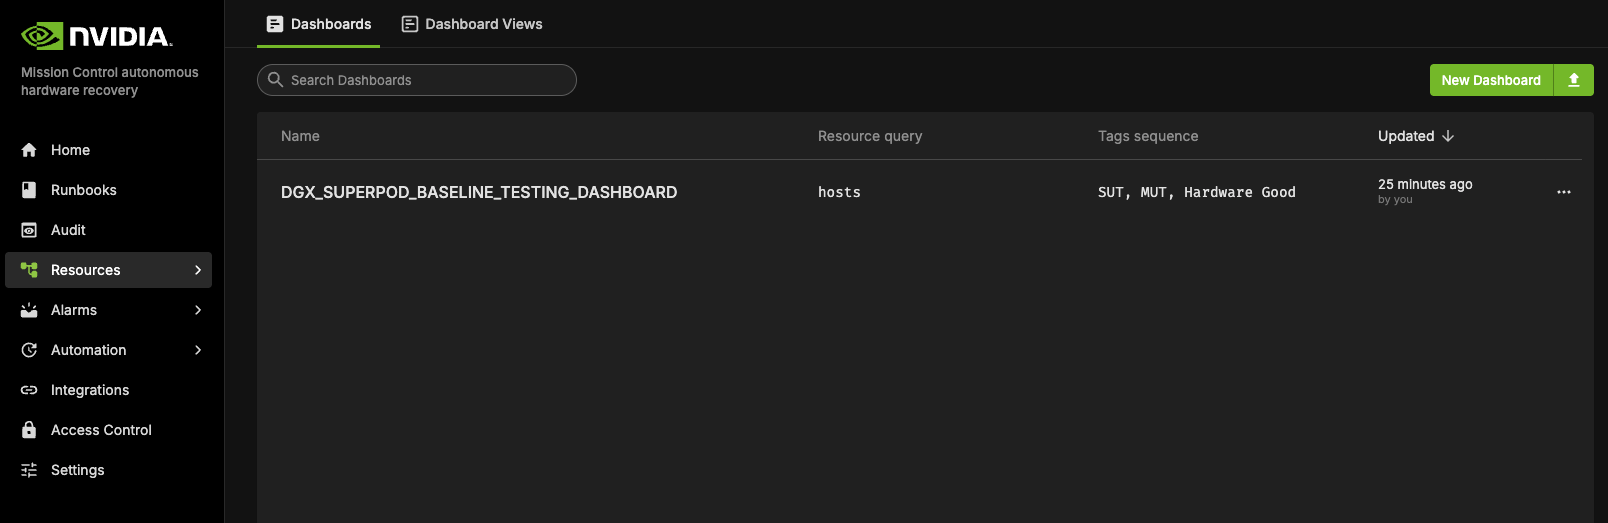
The Dashboards lists all the Dashboards available. All these dashboards reflect the current status of the cluster and the test status.
A Dashboard View is a snapshot of the Dashboard that captures the data at a specific point in time. This snapshot remains static, preserving the exact state and data of the Dashboard as it appeared at that moment, regardless of any future changes or updates to the live data.
DGX_SUPERPOD_BASELINE_TESTING_DASHBOARD#
The DGX_SUPERPOD_BASELINE_TESTING_DASHBOARD provides a detailed view of the cluster’s resources and the status of the baseline tests. Specifically, it tracks the progress of two key testing phases for each resource: SUT and MUT.
Resource Status: The dashboard displays all resources within the cluster, such as compute nodes, control nodes, and switch nodes, along with their associated status.
Hostname: For each resource, you will see the hostname, along with a Tag sequence that indicates the stage of both the SUT and MUT tests.
Test Stage Progress: The rows in the dashboard reflect the current status of each test stage. Each stage (SUT and MUT) has a corresponding tag name that visually represents its test progress, showing whether the stage has been successfully completed, is in progress, or has failed.
Snapshot of Cluster Health: The dashboard offers a comprehensive snapshot of the cluster’s readiness. It allows users to identify potential issues early, track the completion status of tests, and quickly assess which resources are ready and which ones may require attention.
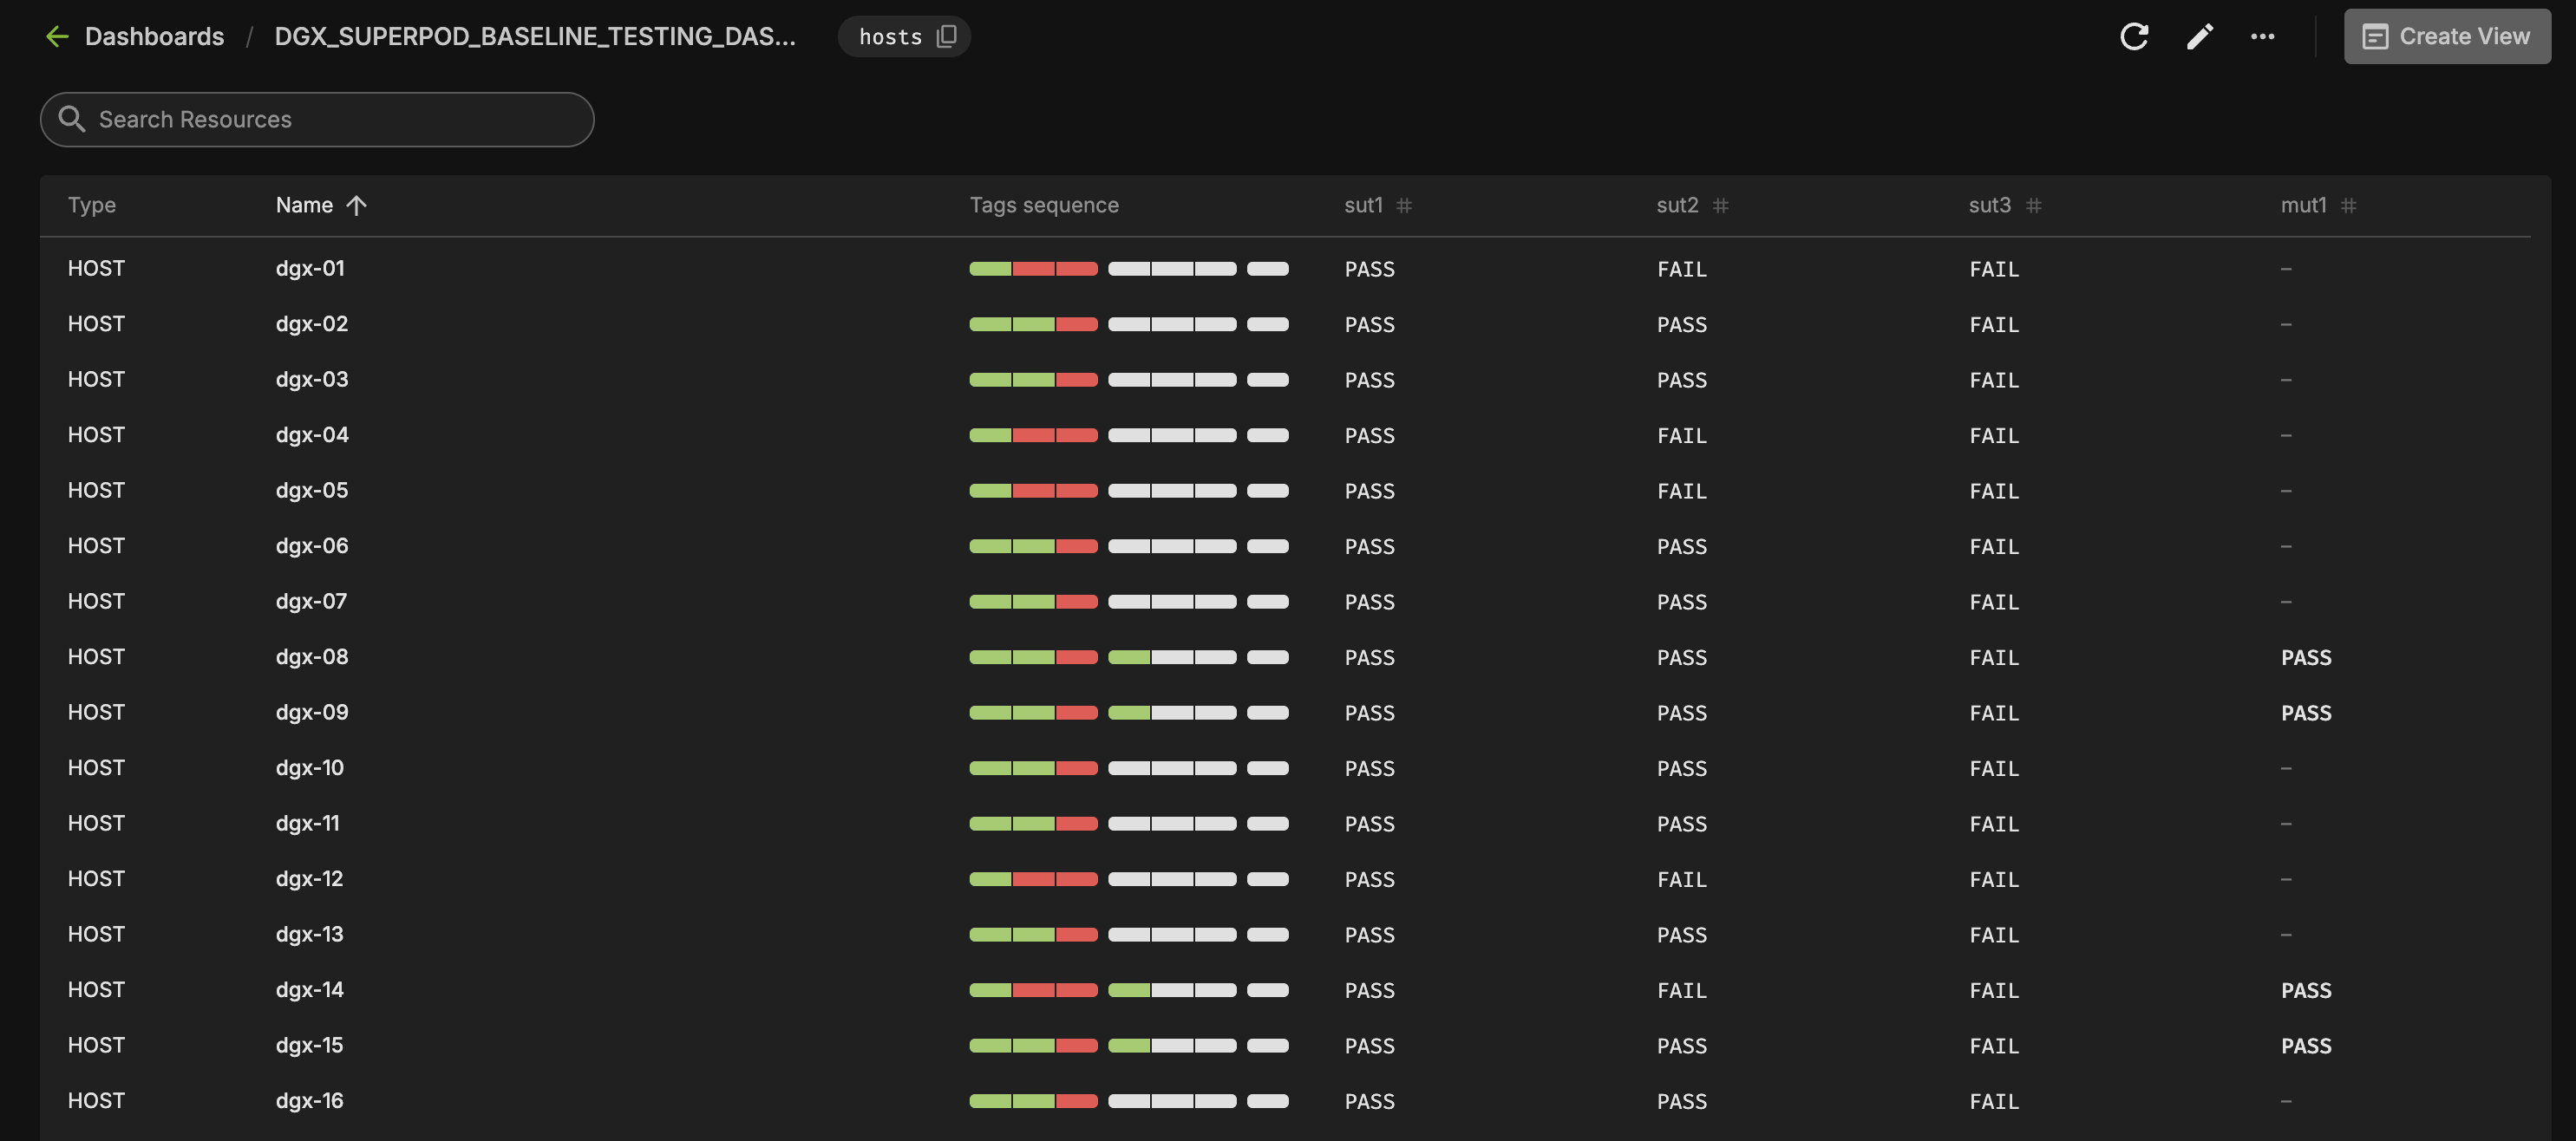
The dashboard allows you to sort the resources by Name, or Progress Bar, making it easier to organize and view the status of your cluster based on your preferred criteria.
Name: Sort resources alphabetically by their hostname for quick access.
Progress Bar: Sort by test progress to focus on resources at different stages of testing or to identify incomplete tasks.
Creating a View / Snapshot#
To create a snapshot of the dashboard, follow these steps.
Click on the “Create View” button located at the top right corner of your screen.
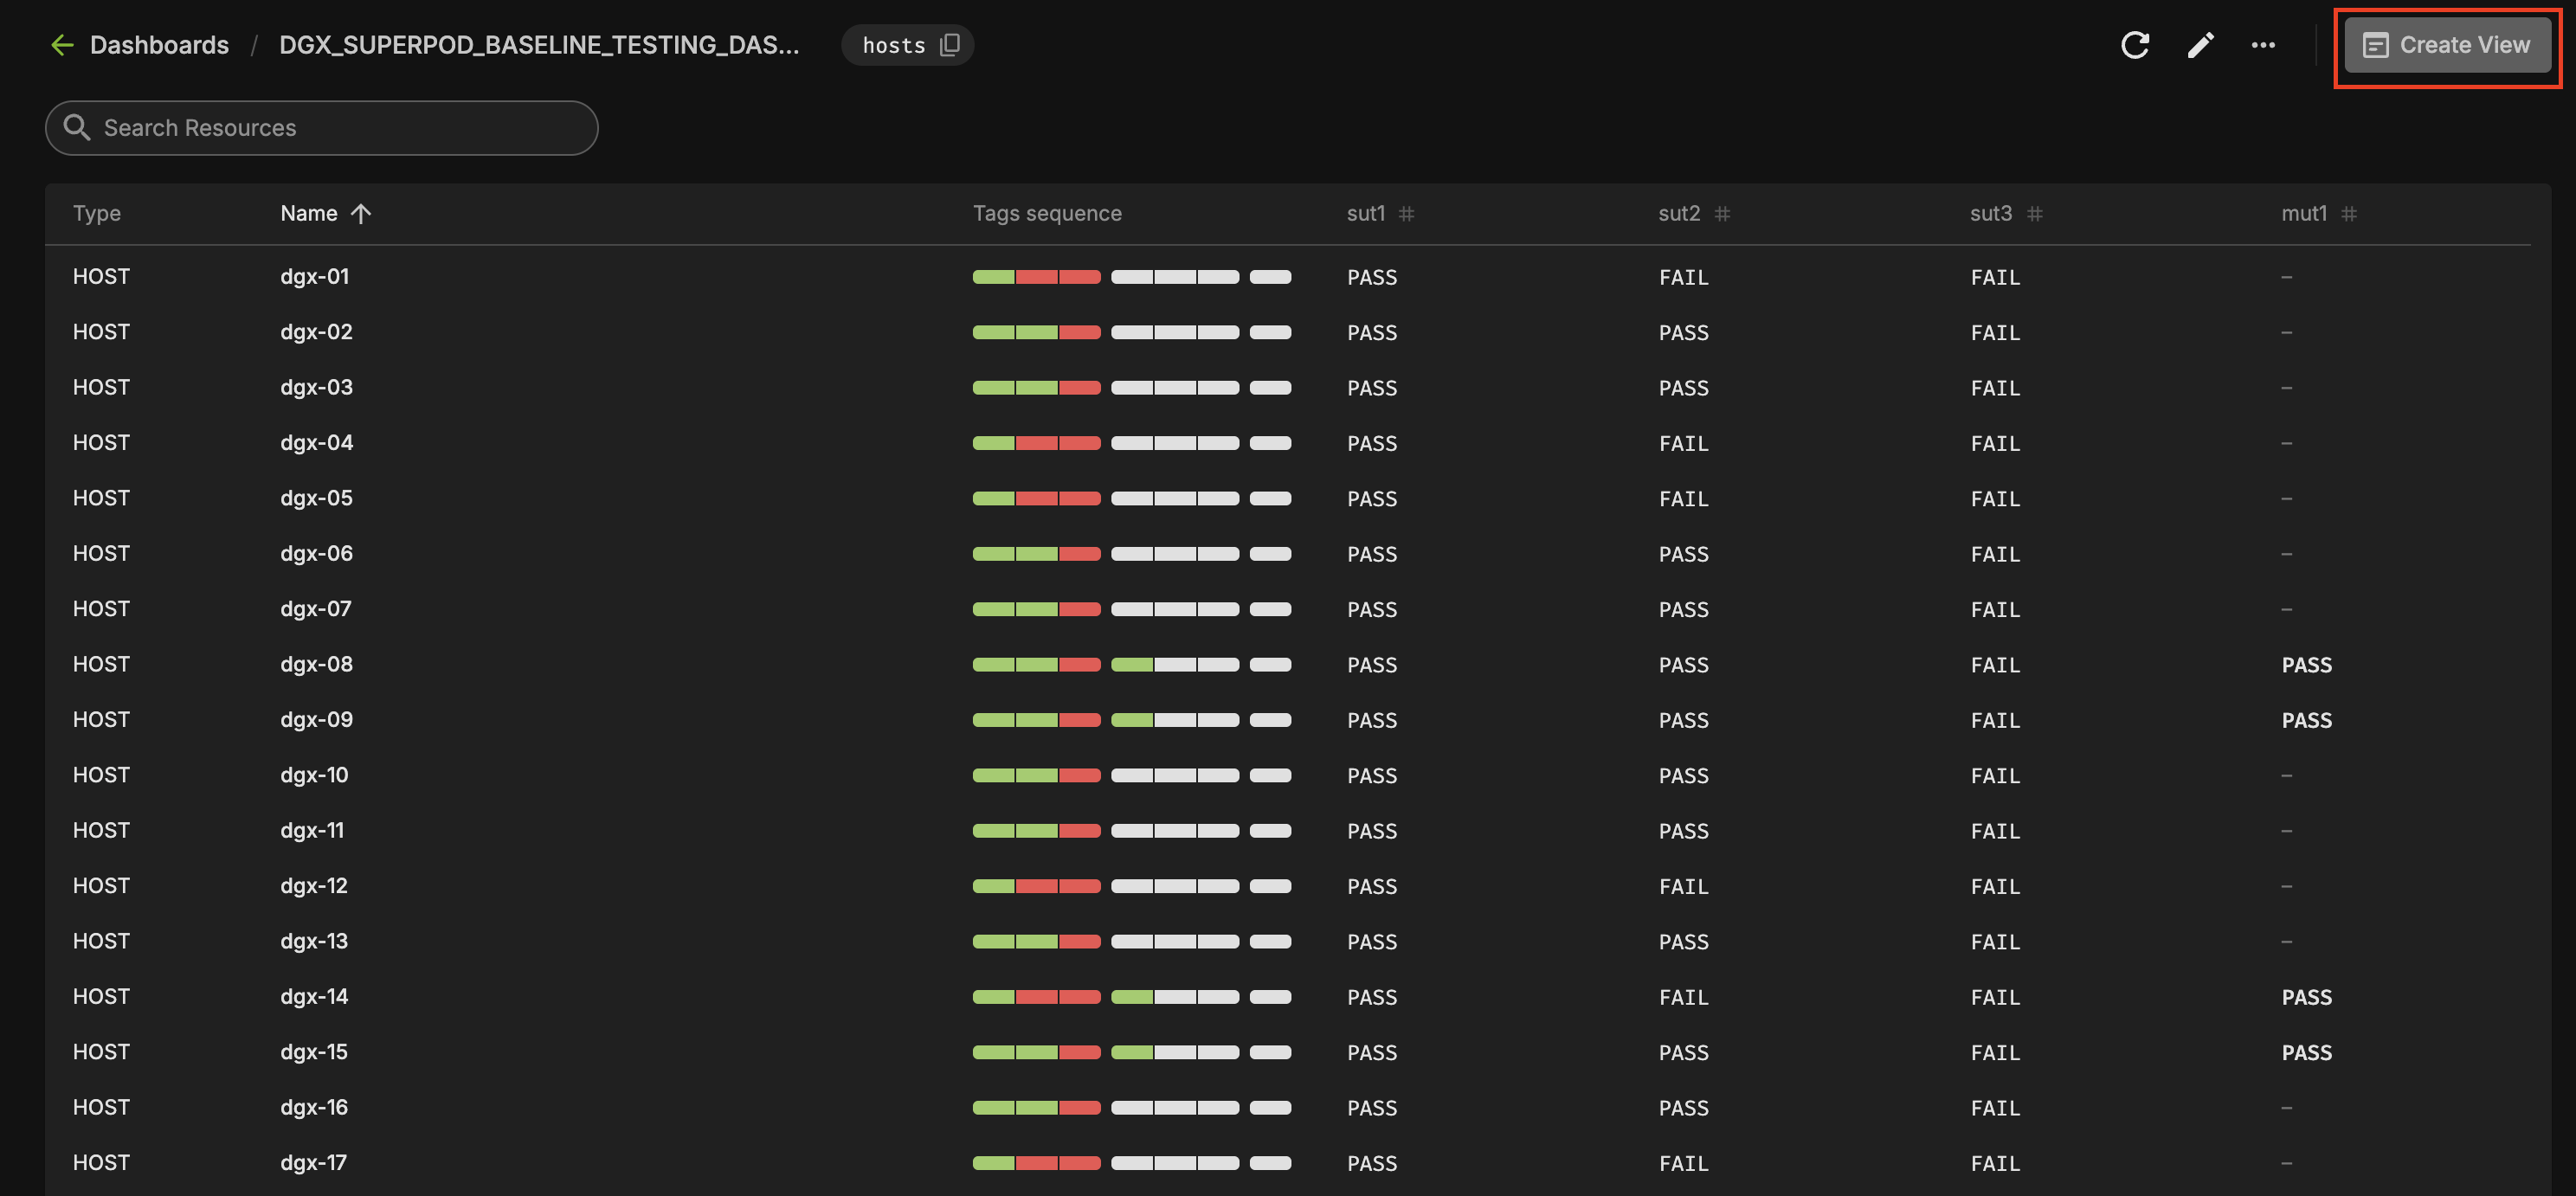
Retain the auto-generated name for the dashboard which includes the timestamp or provide your own name.
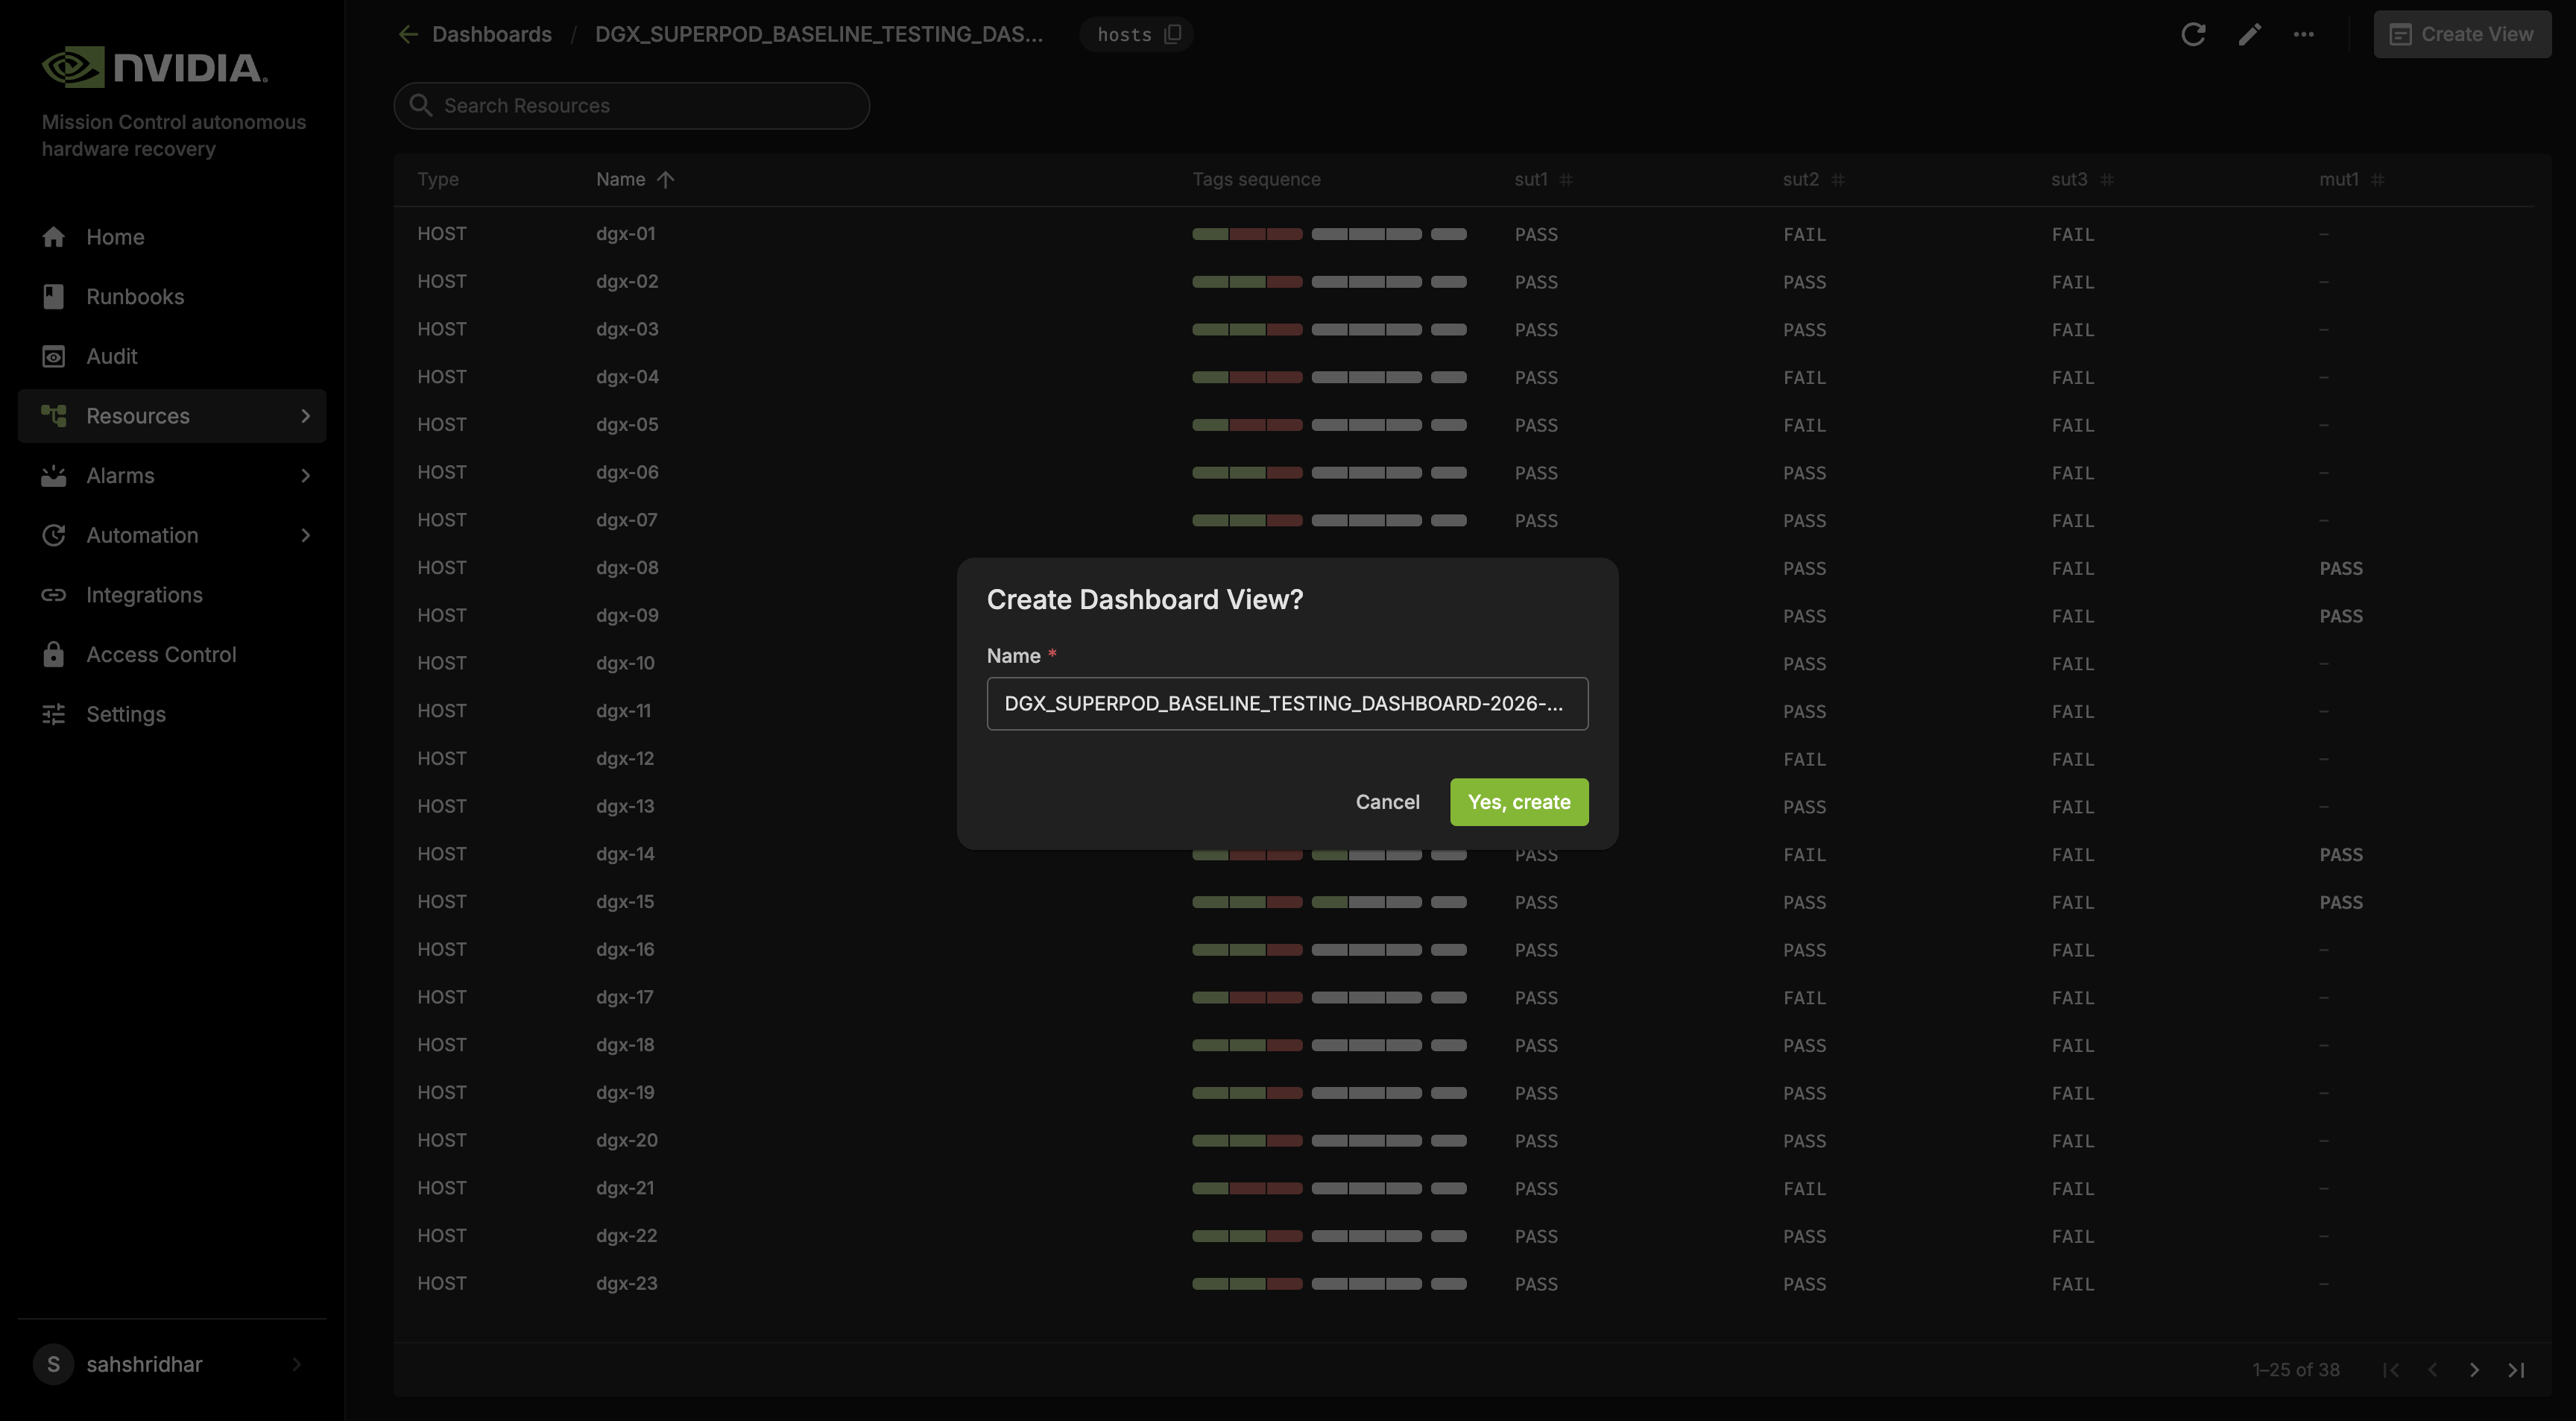
Once the Dashboard View is created, a pop-up notification will appear with a hyperlink to access the Dashboard View.
The Dashboard View created can be downloaded as a CSV to further manipulate the data to generate reports.
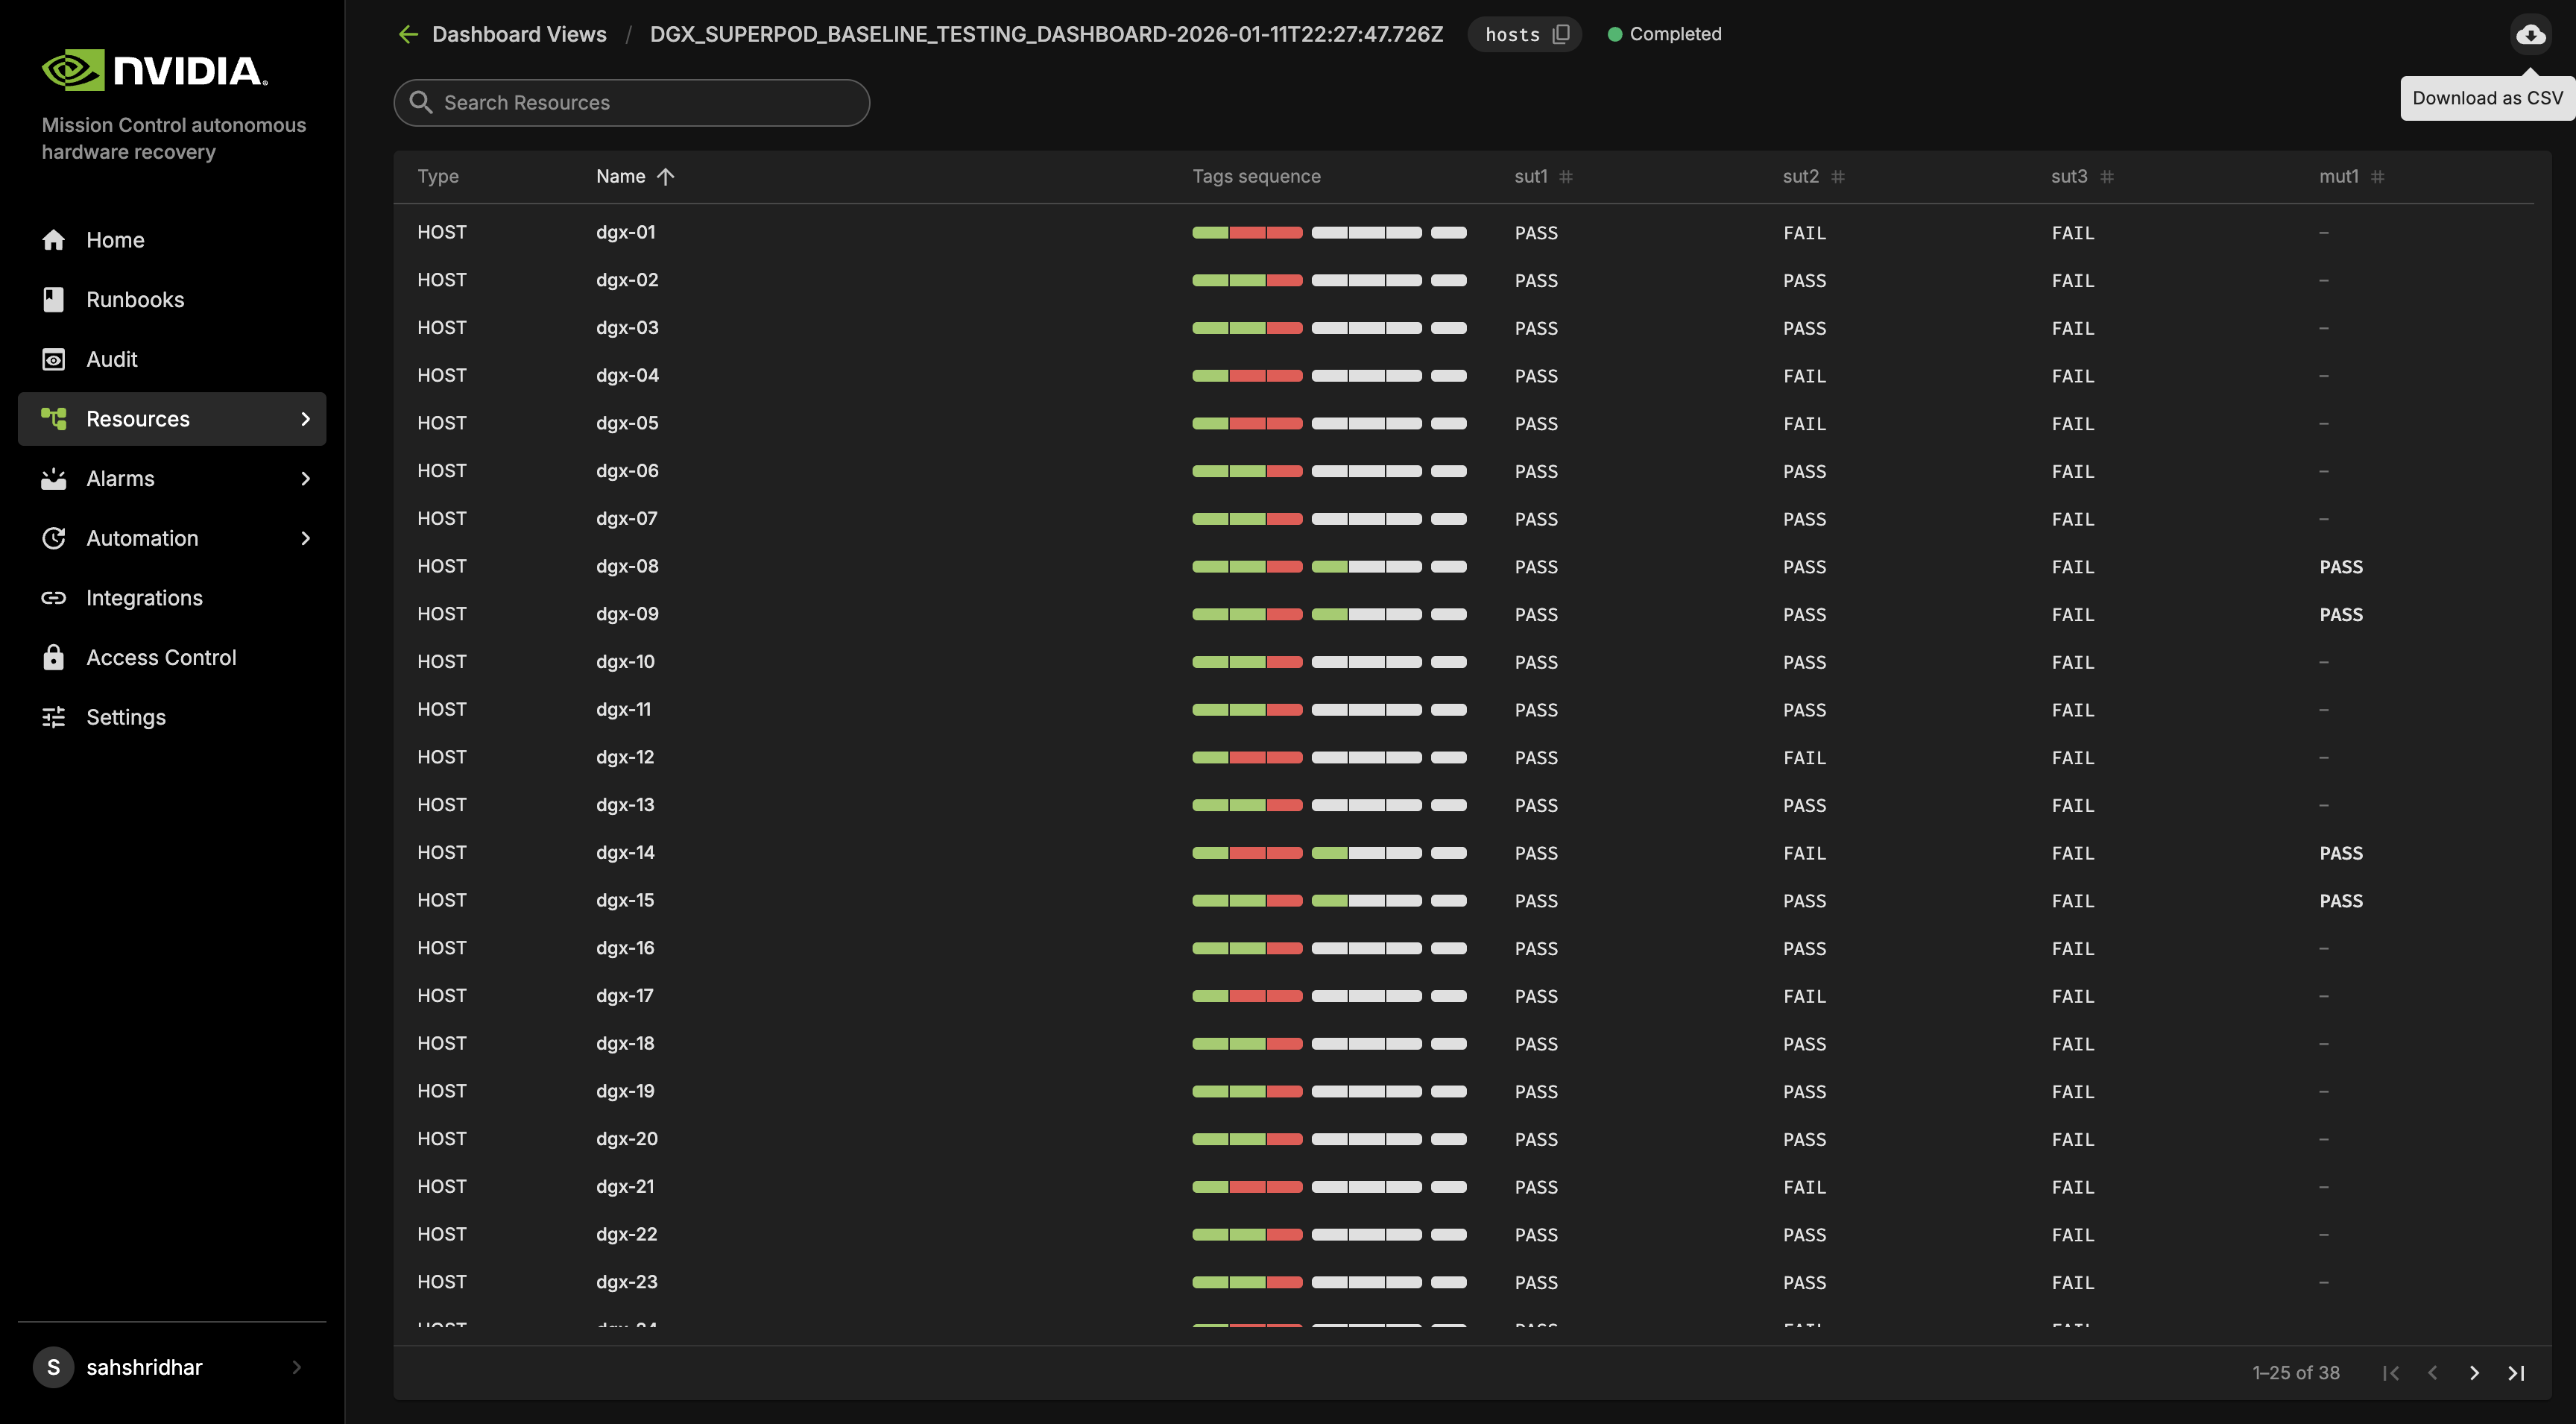
Automated Health Checks with NVIDIA Mission Control autonomous hardware recovery#
Introduction#
NVIDIA Mission Control autonomous hardware recovery provides a full suite of automated health checks to detect failures at the tray, node, and system levels. In addition, system wide health checks are performed by integrating with the UFM and NMX-M network control planes. Health check data is reported back to BCM’s BaseView and/or the in-cluster LGTM stack. These health checks are performed at two layers: BCM job invocation, and as periodic health checks via NVIDIA Mission Control autonomous hardware recovery.
Alarms Dashboard#
The alarms dashboard is an overview of all alarms and the state of your system. In this view, alarms are summarized by counts of alarms firing, alarms firing most frequently, and a configurable list of most frequently firing, canceled, or resolved alarms. This is meant to be a starting point for any investigations of possible issues with your systems, and you may click any alarm for further details.
BCM Slurm Job Lifecycle Checks (Prolog and Epilog)#
When a Slurm job is submitted, the Autonomous Hardware Recovery Agent automatically runs a set of checks at the start and end of the job to validate node health and stability. These are known as Prolog and Epilog checks.
Prolog Checks (run before the job starts):
If a check fails, the node is marked as DRAIN, and the job is re-queued.
If it passes, the job proceeds normally.
Epilog Checks (run after the job finishes):
If a check fails, the node is also marked as DRAIN.
These scripts are automatically pushed to each node when the job runs, but they are not visible or configurable through the NVIDIA Autonomous Hardware Recovery UI. To review them, navigate to Shoreline_files/scripts/slurm in the NVIDIA Mission Control package.
Note: Prolog and Epilog checks are disabled by default and should only be enabled after the nodes are confirmed to be healthy. Use the following runbooks to manage them:
SLURM_CHECKS_ENABLE– enables the checksSLURM_CHECKS_DISABLE– disables the checks
Unlike the Prolog and Epilog checks, Periodic Checks are defined within the NVIDIA Mission Control autonomous hardware recovery interface as Alarms, and are detailed in the next section. They will be automatically enabled for racks that pass Single Rack Testing but may also be manually enabled or disabled for specific racks by running the “ALARMS_ENABLE” AND “ALARMS_DISABLE” runbooks.
Periodic Health Checks (Alarms)#
Periodic Checks are separate from Prolog and Epilog and run at regular intervals to monitor system health. These are managed as Alarms in the NVIDIA Autonomous Hardware Recovery UI.
Automatically enabled for racks that pass Single Rack Testing
Automatically disabled during firmware upgrade and Break/fix
Can be manually enabled or disabled at any time
The alarm_base is the Resource Query they run against. To control them manually, use the following runbooks:
ALARMS_ENABLE– enables periodic alarms for selected racks. Note that a node having themaintenancetag will override these settings.ALARMS_DISABLE– disables them
Periodic Checks are fully visible and configurable in the UI through the alarm section. The following is a list of the configured Alarms, grouped by their check interval:
Frequent Checks (5m)#
bmc_sensors#
Checks the sensors from the Baseboard Management Controller (BMC) to ensure the proper data is returned.
sysmem#
Checks that all expected memory DIMMs are present.
dns_host#
Checks the DNS configuration and resolution for the host.
eth_state#
Checks that the ConnectX devices are present, active, and in the physical LinkUp state via ibstat, and also matching the expected transfer rate
raid_count#
Checks that the raid configuration matches the expected mdstat configuration.
gpu_temp_history#
Checks System Event Log (SEL) history looking for GPU temperature issues.
gpu_alloc_temp#
Checks if the GPU temperatures are above a threshold.
periodic_bmc_host_checks#
The following groups of periodic functional checks are a subset of the BCM Prolog checks that run at predefined intervals as NVIDIA Mission Control autonomous hardware recovery Alarms.
check_bmc_ipmi_version - Checks BMC IPMI version against an expected value
check_nvidia_module_loaded - Verifies the NVIDIA module is loaded in the host OS
check_host_os_version - Verifies the DGX OS version matches the expected value
check_nvsm_status - Verify the NVSM service is currently active
periodic_cpu_mem_checks#
check_cpu_health - Verifies CPU sockets and cores are present and online
check_dimm_count - Checks that all expected memory DIMMs are present
check_dimm_size - Checks that the size of each memory DIMM matches the expected values
check_memory_swap_size - Checks that the memory swap size matches the expected value
periodic_gpu_nvlink_checks#
check_gpu_pci - Checks that all GPUs are present on the lspci interface and with the correct link width and speed
check_gpu_error - Checks GPUs for ECC errors, retired pages, and throttles present
check_gpu_powerstate - Checks the powerstate for each GPU and compares against an expected value
check_gpu_param - Checks that specified GPU parameters are present and correct for the host
check_nvlink_health - Checks that links are active for each GPU, the speed is correct, fabric registration has been completed, are running at full bandwidth, and belong to the same NVLink domain and partition.
check_gpu_topology - Checks that there are no issues with the p2p topology within the node
check_gpu_telemetry - Checks that various sensors can be successfully read from the GPU via nvidia-smi
check_gpu_power_limit - Checks that the power limit is correct for each GPU
check_nvidia_inforom_ver - Checks that the inforom version is correct for each GPU
check_gpu_clock_info - Checks that the maximum clock speed is correct for each GPU
check_remapped_row - Checks if any remapped row events have occurred
periodic_network_checks#
check_ib_ber_and_ro - Checks if the PCI_WR_ORDERING field is set to relaxed and also the bit error rate of the ConnectX using mlxlink
check_ib_port_rcv_errors - Check Infiniband devices port RCV errors
check_ib_cables - Checks the cable info using mlxcables
check_bf3_speed - Validates that the BlueField devices are operating at the correct speed and that the proper number of devices are in the “Up” state. This check will run, but never fail
periodic_storage_checks#
check_pex_switch_health - Checks that the PEX switches are present, have the correct PCIe link speed and width, and the downstream devices have enumerated to lspci
check_cx_config - Checks that the ConnectX devices have the correct PCIe link speed and width via lspci and ACS config via setpci
check_nvme_health - Checks that the PCIe link speed and width of each NMVe device matches the expected value
check_storage_dir - Checks that the host has functional access to the home storage
check_storage_util - Checks that the used local storage on the host is below a given threshold
periodic_error_checks#
Checks journald for machine check events, Xid, AER, CPER, I/O, GPU fell off the bus, and other generic errors.
Hourly Checks#
nfs_mounts#
Verifies required mount points.
daily_informational#
Checks for which the severity and remediation may not be critical. This alarm will only be triggered once per day, and results may be viewed in the resulting runbook run.
check_sel_event - Read the SEL events from the BMC and ensure none are asserted
check_dgx_os_version - Verifies the DGX OS version matches the expected value
check_gpu_vbios_ver - Checks the VBIOS version of the GPUs and compares against an expected value
check_nvme_fw_ver - Checks that the FW version for each NVMe matches an expected value
check_kernel_commandline_opt - Verifies the specified kernel option(s) is present in the current kernel’s boot parameters
check_host_bios_ver - Verifies the system’s BIOS version
check_kernel_ver - Verifies the current version of the Linux kernel
check_host_package_versions - Queries the installed packages on the host
nv_container_cli_info - Retrieves information about the NVIDIA container CLI (driver and devices)
Daily Checks#
cpu_microcode_version#
Checks the CPU microcode version and compares against an expected value.
cpu_stepping#
Checks that the CPU stepping parameter is correct for each CPU.
numa_node_count#
Checks that the correct count of Non-uniform memory access (NUMA) nodes are configured with the CPU cores.
NVIDIA Mission Control autonomous hardware recovery Alarm Configuration#
There are several components to an alarm, with the key pieces being the Resource Query, Fire Query, Resolve Query, Check Interval and Automation. An example configuration is shown in the following figure.
Resource Query#
The resource query allows you to customize the resources (hosts, pods, gpus) on which the checks will be performed. In the preceding example, the `hosts | rack_name =~ “.*”` will only check alarms on hosts which have a value set for the “rack_name” tag.
Fire Query#
The fire query is a condition that, when true, will cause the alarm to begin firing. It will be run at each interval.
Resolve Query#
Similar to the fire query, the Resolve query is a condition that will resolve the alarm when true. Resolving an alarm will cause firing to cease and the state to change to Resolved.
Check Interval#
The interval at which the fire and resolve queries are checked.
Automation#
You may use the Automation settings to have Runbooks triggered when an alarm fires, and you may also customize the informational messages that are displayed in the Alarm’s logs.
Alarm States#
If an Alarm has triggered, it will be in one of the following three states:
Triggered#
This state means the alarm is currently firing. Any automation (break/fix) will subsequently be invoked to remediate any issues, potentially resolving the alarm. Alternatively, the user could cancel the alarm by clicking the “Cancel alarm.”
Clicking into the triggering alarm will give you more details on what caused the alarm, metadata and resources relating to the alarm, and will also allow you to view log output from the check itself.
Resolved#
When the clear query of an alarm evaluates to true for a firing alarm, the status will be changed to Resolved. Automation triggered runbooks will invoke break/fix operations that should be configured to result in a resolved alarm.
Canceled#
When a user cancels an alarm from the dashboard, or from the triggered alarm itself, its state will become Canceled. Also, if an alarm configuration is changed for an alarm in the Triggered state, it will be canceled since it was triggered against a defunct configuration.
Firmware Upgrades with NVIDIA Mission Control autonomous hardware recovery#
Overview#
NVIDIA Mission Control autonomous hardware recovery provides functionality for upgrading, cycling, and verifying firmware and the corresponding OS within your B200 racks. The three distinct components for which firmware can be upgraded using this process are:
Motherboard Tray (CPU, PCH, BMC)
GPU Tray (GPU, NVSwitches, HMC)
Mellanox Devices
The workflow invocation is performed via autonomous hardware recovery’s Runbooks. To view all Firmware upgrade related runbooks, you may search by the FIRMWARE_UPGRADE label as shown below.
Using the filter will reduce the runbooks displayed to a list. In general, you will use these runbooks to upgrade the compute trays and mellanox deivces, by following the steps in the next section.
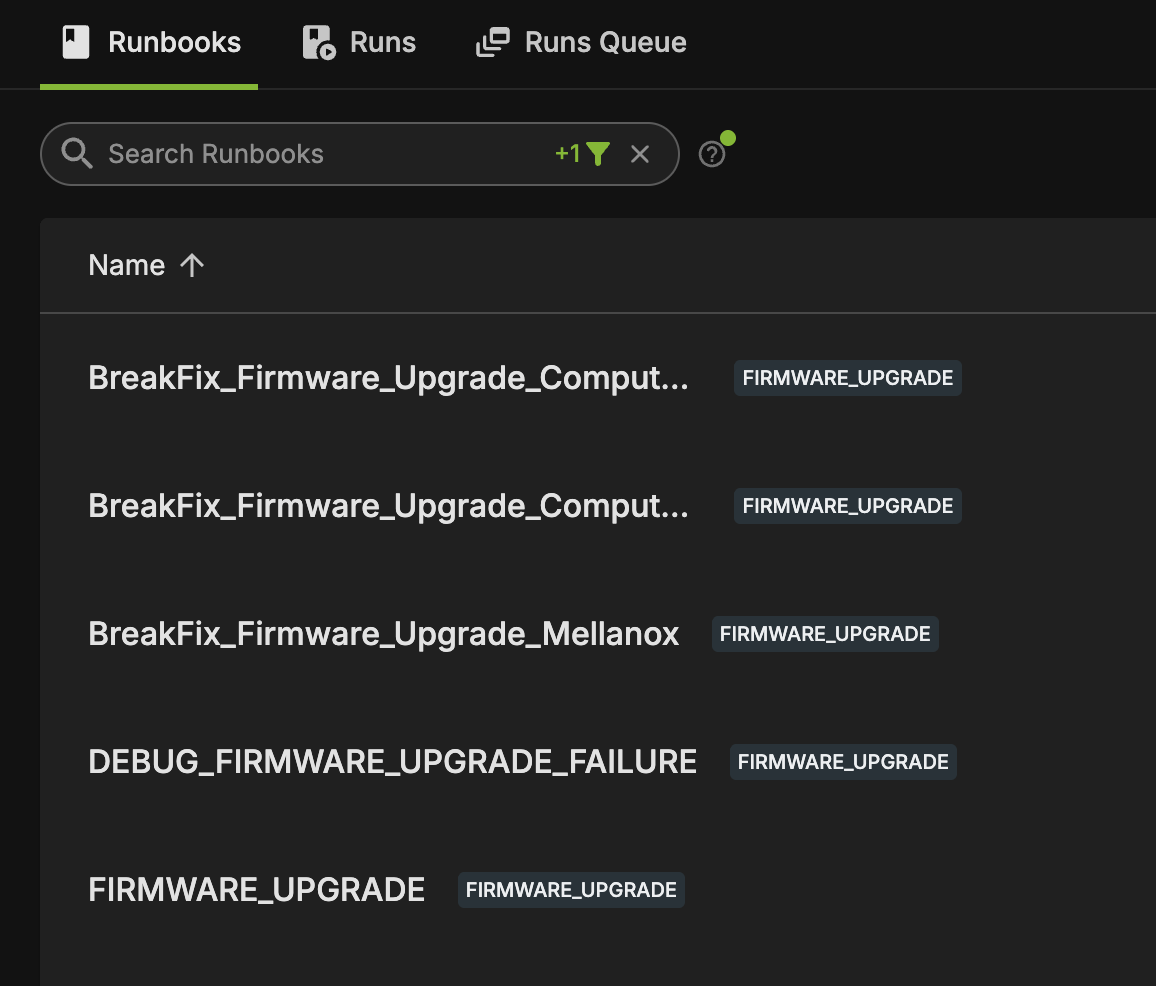
Preparing the Upgrade#
In the firmware upgrade runbook, nvfwupd and mlxfwmanager are used with the upgrade package file to determine the versions needing upgrade. You will need to obtain the firmware package and the the Source of Truth (SOT) JSON file, the latter of which defines the referenced settings used for validation.
The SOT JSON may be obtained from the NVIS team, whereas the firmware packages may be downloaded from the NVIDIA Application Hub.
Source of Truth Snippet (truncated)#
{
  "TemplateVersion": "0.5",
  "Id": "8e755bd7-f6af-4621-96d3-d55a5f0fe45e",
  "Name": "Viking_Release_1.3.2 (25.09.1)",
  "State": "QA Tested",
  "ReleaseDate": "2025-07-01T06:28:08.398Z",
  "ReleaseCustomers": [],
  "Tests": [],
  "Packages": [],
  "BoardSKUs": [
    {
      "SKUID": "P4387 B200",
      "Name": "DGX B200",
      "Components": {
        "Software": [
          {
            "Component": "DGX OS",
            "Version": "7.0.2 RC6",
            "Comments": "Install ISO",
            "External": false,
            "Sideload": false,
            "Informational": false,
            "Locations": [
              {
                "Location": "",
                "LocationType": "HTTPS",
                "Distro": "All",
                "Architecture": "All",
                "PackageName": "",
                "External": false
              }
            ],
            "SubComponents": []
          }
        ],
        "Firmware": [
          {
            "Component": "DGX B200 Motherboard Tray FW ",
            "Version": "1.3.2",
            "SKUID": "",
            "Vendor": "",
            "Comments": "Subcomponents Parsed from FWPKG",
            "External": false,
            "Sideload": false,
            "Bundle": "nvfw_DGX_250629.1.0.fwpkg",
            "Type": "Prod",
            "Informational": false,
            "Locations": [
Ordering Constraints#
The runbooks automatically determine the ordering of applicable packages and will AUX cycle nodes when appropriate. The following paragraph describes this ordering, but is for informational purposes only, as there is no requirement for the user.
Verify#
For the compute tray, much older firmware packages require the BMC to be upgraded prior to HMC, but this is no longer the case with modern firmware. Both BMC and HMC can be upgraded within a single AC cycle.
Coordination with other jobs#
To prevent other tasks from utilizing the nodes undergoing the upgrade process, AHR will do two things:
It will tag the nodes with a special
maintenancetag.Subsequently, it will drain the node on BCM.
In particular, this will prevent other upgrade processes from interfering, and will also bypass AHR’s breakfix workflow. This tag will be automatically removed upon successful completion of the upgrade, and the node will be undrained. If there’s an issue during the upgrade process, this tag and drain state will remain for further investigation. At this point of failure, the user should review the failures, and return the nodes to undrained and remove the maintenance tag once the nodes are deemed healthy.
If you need to remove the maintenance tags after the firmware upgrade process encounters an issue, troubleshooting has completed, or even after unsuccessful breakfix triage, you may do so using the CLEAR_MAINTENANCE_TAGS runbook.
Performing the Upgrade#
This section details the steps involved to upgrade each firmware type. The runbooks below will take care of invoking the process, performing the upgrade, calling any ancillary runbooks, and ultimately performing validation of the upgraded component once complete.
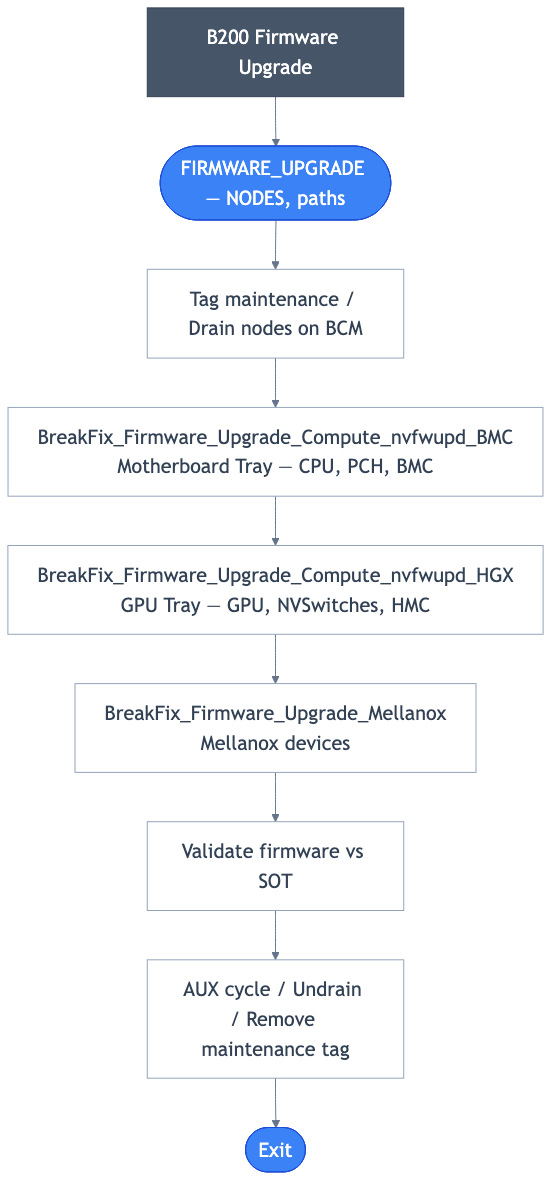
Prerequisites#
Download the firmware upgrade packages.
Obtain the golden configuration SOT JSON file.
On the headnode, place the JSON and packages in a subdirectory of
/cm/shared/apps/autonomous-hardware-recovery/var/firmware/, which is accessible to theshorelineuser.Upgrade packages contain motherboard, GPU and network components among others.
Upgrading#
From the Runbooks view, select “Create Run” for the FIRMWARE_UPGRADE runbook. This will prompt you for the following required parameters, and perform the upgrade. Additionally, it will automatically select the appropriate packages for the corresponding components e.g. DGX and HGX.
NODES - Provide the node names using a regular expression. Examples:
node01,node01|node02, ornode-*.FORCE_UPGRADE - When set to true, forces the firmware upgrade to proceed regardless of version checks or validation; false follows standard upgrade rules.
BMC_FIRMWARE_PATH - Provide the entire path of the firmware upgrade package for BMC/DGX packages (mother board)
HGX_FIRMWARE_PATH - Provide the entire path of the firmware upgrade package for HGX package (GPU Tray)
MELLANOX_FIRMWARE_PATH - The complete path of the Mellanox firmware package
FW_SOURCE_JSON_PATH - Path to the golden configuration JSON file provided within the firmware package. This file defines the reference settings used for validation. If the file is not available, set this parameter to NA.
When running it will invoke other runbooks as necessary, but should you need to upgrade a single component, you may run the following runbooks directly.
BreakFix_Firmware_Upgrade_Compute_nvfwupd_BMC
BreakFix_Firmware_Upgrade_Compute_nvfwupd_HGX
BreakFix_Firmware_Upgrade_Mellanox
AUX_CYCLE which can be used to perform an AUX power cycle is an additional parameter you may change in the individual runbooks.
Note: The firmware upgrade automation follows the general outline described above. Please check the firmware upgrade documentation and, if it differs from the standard procedure mentioned above, take the necessary steps for any additional components or requirements.
Troubleshooting#
1. Nodes not reachable from headnode#
To upgrade firmware, the BMC IP must be accessible from the headnode. The runbook verifies node accessibility and automatically skips unreachable nodes.
Action: Ensure the node is online and accessible from the headnode, then rerun the firmware upgrade runbook.
2. Failed firmware upgrade#
The firmware upgrade failed to complete successfully. Possible causes include failures in the nvfwupd command, or mlxfwmanager command, depending on the package.
Action: Verify logs by clicking on the Output, which includes the command’s stdout and stderr.
Note that the runbook does not automatically undrain or untag maintenance when the firmware upgrade fails. After verifying that the failures are safe to ignore and the nodes are ready to return to the pool, undrain, and untag the nodes using the UNDRAIN_AND_UNTAG runbook:
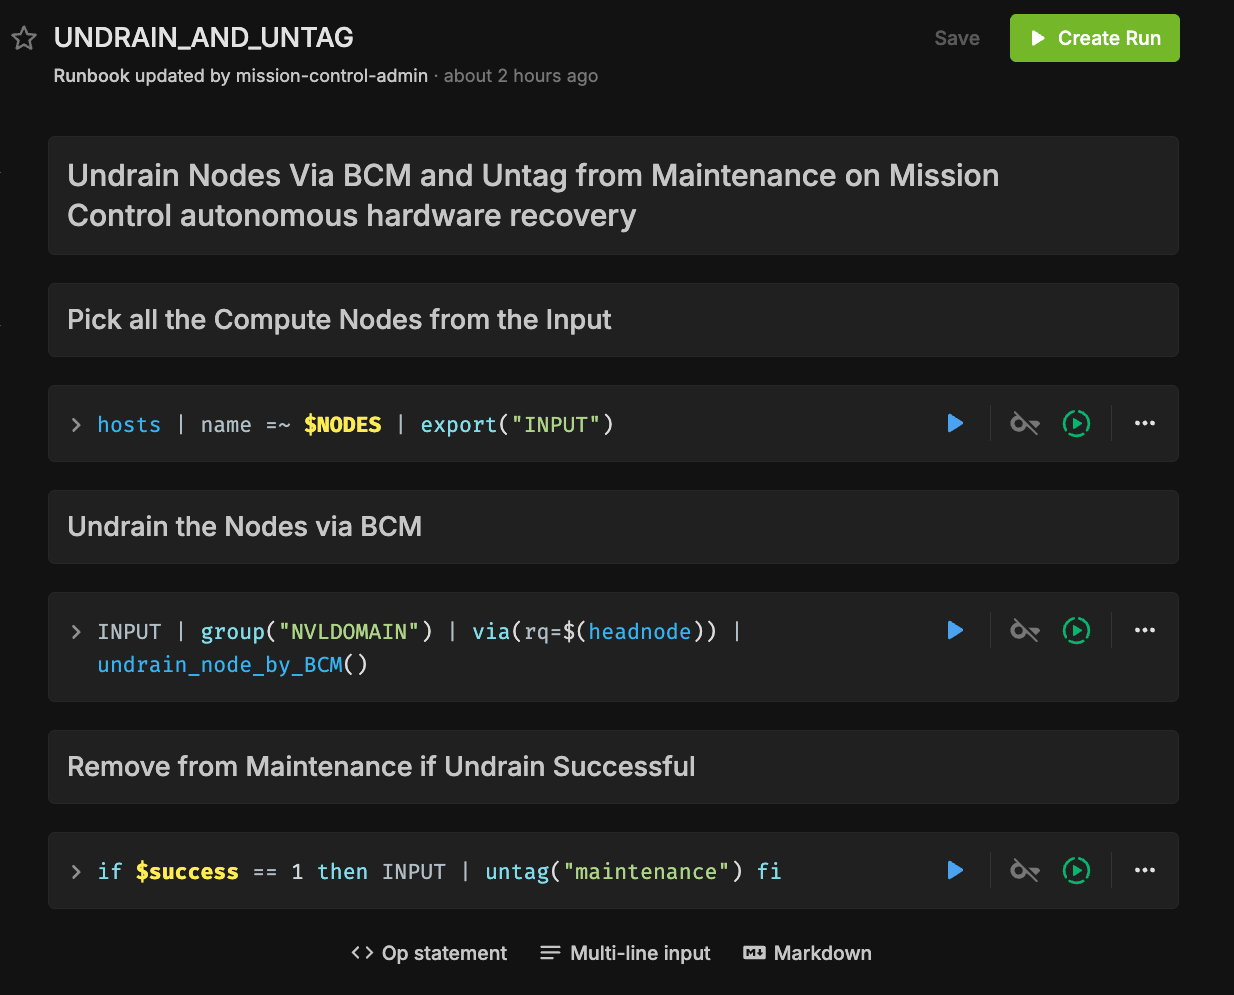
3. Failed validation stage#
The final step in every firmware upgrade is validation. The runbook verifies the current firmware versions against the SOT. Failures may result from upgrade issues, an incorrect SOT JSON file, or command failures when retrieving component versions. Validation may also include components that were not upgraded in the firmware release.
Action: Compare the expected and actual versions in the logs and check for any other errors.
Notes#
Netcat is used to check if nodes are back online after a reboot.
If
nvfwupddoes not upgrade, (due to already being at the specific version, for example) and FORCE_UPGRADE is not specified as true, the runbook will exit after untagging frommaintenance.
Links#
Please see Firmware Reports for more information on Firmware related reports.
NVIDIA Mission Control autonomous hardware recovery Break/Fix Workflow#
Break/Fix Introduction#
NVIDIA Mission Control autonomous hardware recovery provides automated break/fix workflows to handle node failures for DGX B200 systems. These workflows execute a series of diagnostic steps to determine the cause of the failure and take necessary repair steps and create Support tickets for the issues that cannot be auto resolved.
The automated break/fix workflow is designed to efficiently diagnose and remediate issues, with clear paths for different failure scenarios and comprehensive validation to ensure systems are properly restored to service.
Note: In B200 systems, the break/fix workflow operates at the compute node level (individual DGX B200 servers), whereas in GB200 systems, it operates at the compute tray level (liquid-cooled units containing multiple GPU modules).

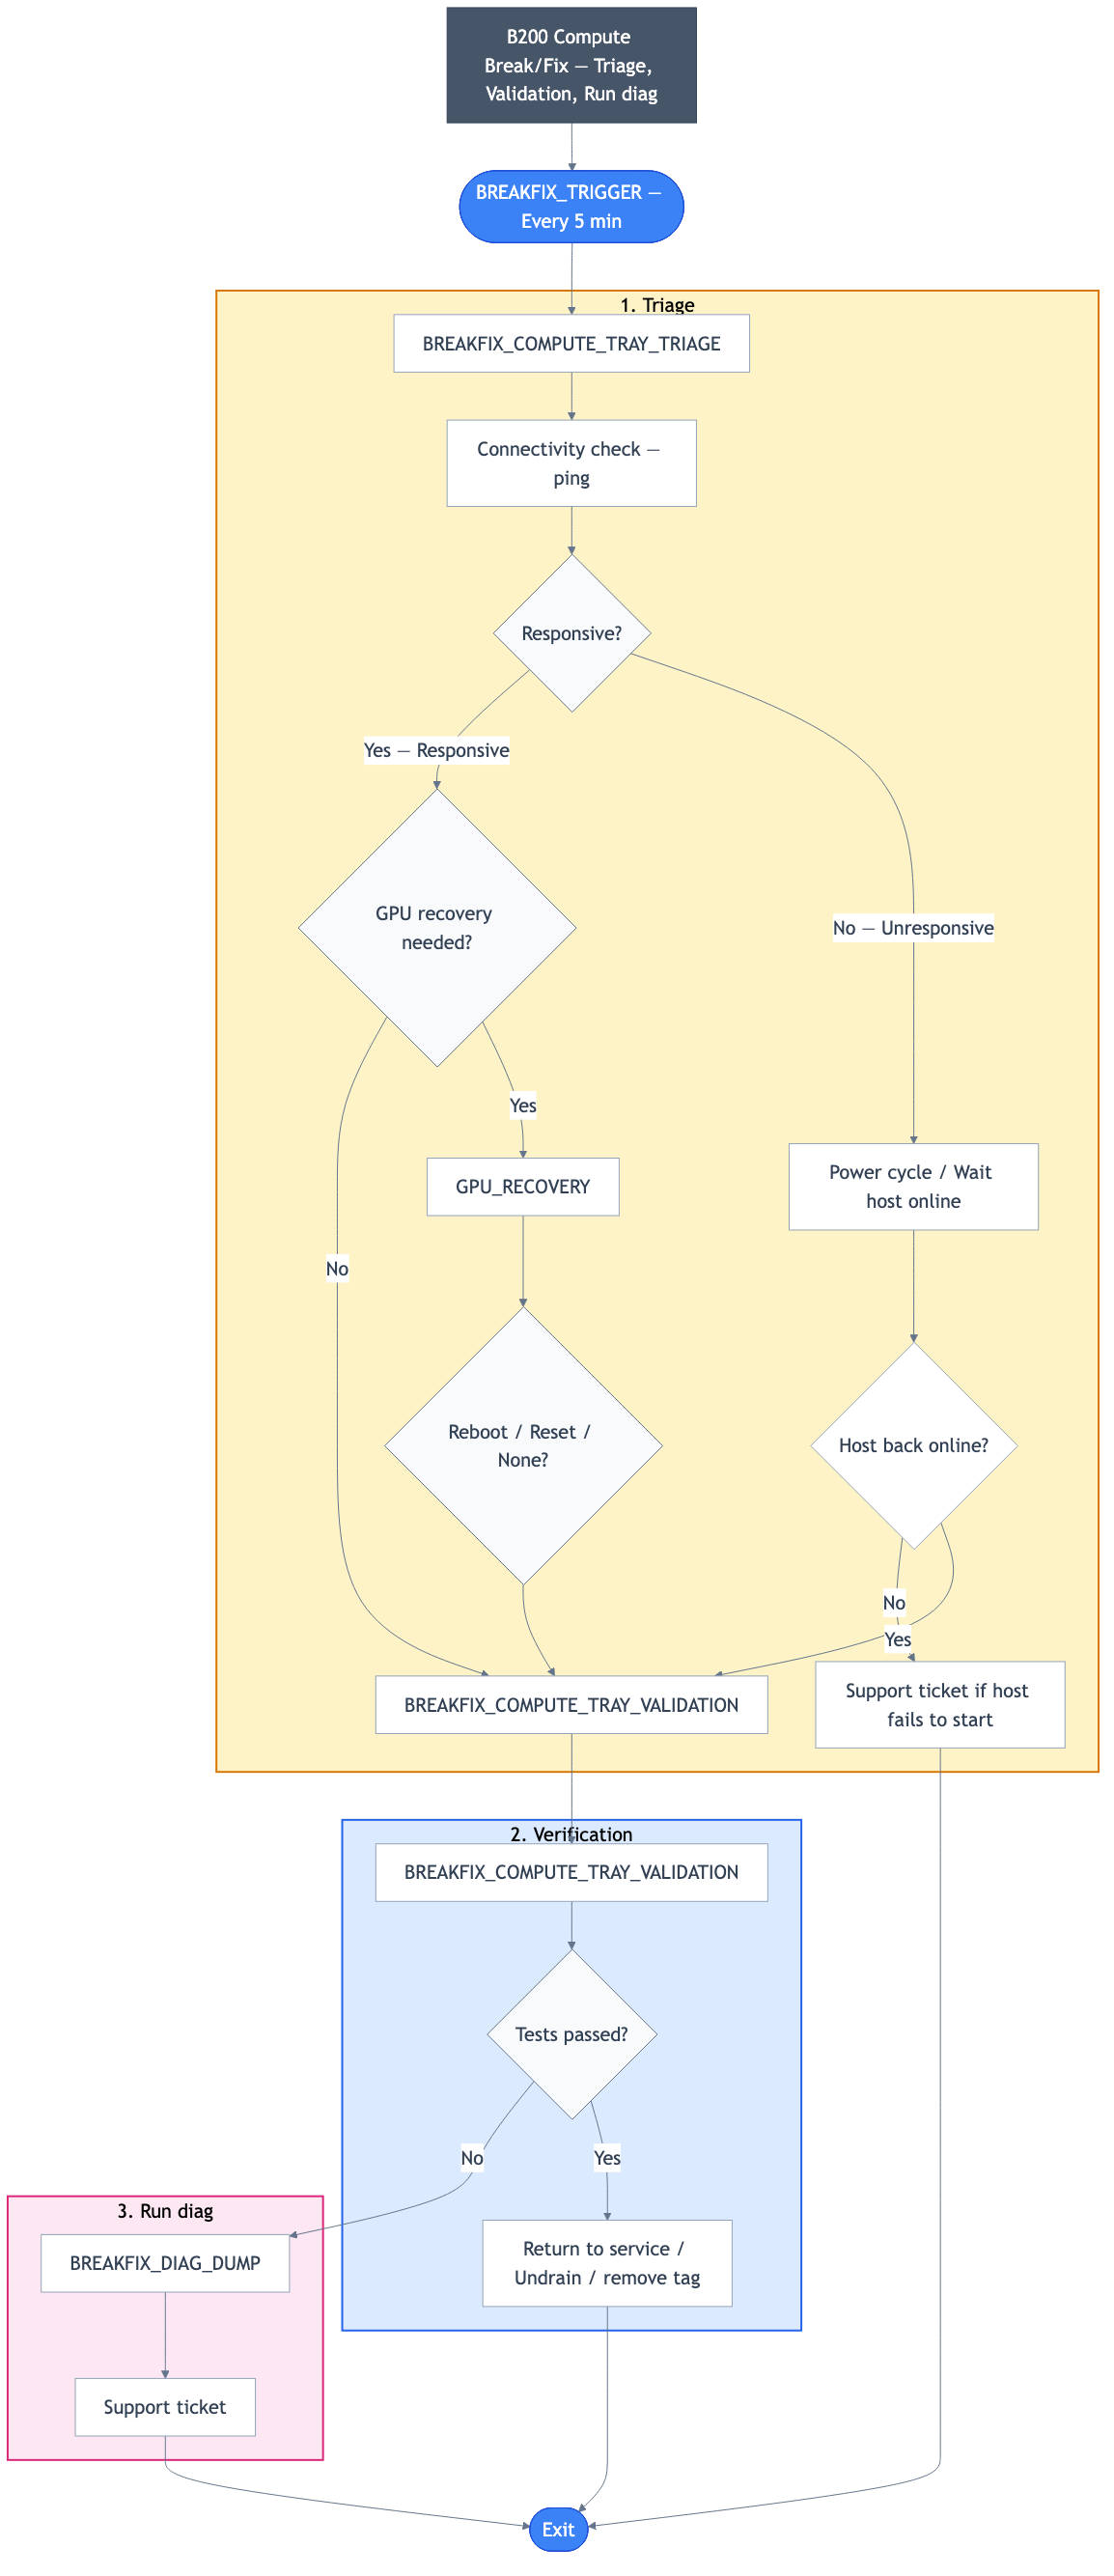
Figure: Compute Break/Fix Workflow - This diagram illustrates the end-to-end automated break/fix process for B200 systems, starting from the BREAKFIX_TRIGGER runbook that monitors for nodes drained with specific reasons every 5 minutes. The workflow shows how nodes are triaged through BREAKFIX_COMPUTE_TRAY_TRIAGE, which routes to either GPU_RECOVERY for GPU-specific issues or directly to validation. All paths converge on BREAKFIX_COMPUTE_TRAY_VALIDATION for comprehensive testing, with failed nodes proceeding to BREAKFIX_DIAG_DUMP for diagnostic collection and support ticket creation, while successful nodes are returned to service.
Key Features#
Automatic Detection: Identifies drained nodes without manual intervention
Intelligent Triage: Routes to appropriate diagnostic workflows based on failure symptoms
Comprehensive Diagnostics: Performs thorough hardware and software checks
Automated Remediation: Attempts to resolve issues without human intervention when possible
Detailed Reporting: Provides comprehensive logs for RMA or further troubleshooting
Entrypoint of Break/Fix Workflow#
A centralized automated break/fix interface has been established to facilitate streamlined diagnostics and remediation. This unified entry point provides comprehensive access to the break/fix framework, enabling efficient navigation and implementation of all remediation procedures.
To access the break/fix interface:
Access the NVIDIA Mission Control autonomous hardware recovery portal using your credentials and navigate to the Runbooks section.
Locate the “BREAKFIX_TRIGGER” runbook through the search functionality
Upon selecting the “BREAKFIX_TRIGGER” runbook, you will be presented with the interface showing the workflow for automated break/fix.
Run Break/Fix Workflow#
The BREAKFIX_TRIGGER is a time-triggered runbook that automatically runs every 5 minutes. When executed, it:
Automatically checks if there are any drained nodes from BCM
It checks the drain reason from BCM and proceeds only if the reason is in the allowed list (Excluded by ARE, Prolog error, Kill task failed, Epilog error, Duplicate jobid, Low RealMemory, or Not responding); otherwise, the runbook will exit.
Processes one node per execution cycle from the Slurm drained node pool and applies a maintenance tag in AHR to prevent duplicate processing, ensuring all drained nodes are handled sequentially across multiple runs
For each drained node, initiates the appropriate triage workflow
Begins diagnostic procedures based on the drain reason and node symptoms
No manual intervention is required to start the process
One can see the time trigger settings on the right side of the Runbook under Triggers, where it shows that it is currently enabled and runs every 5 minutes.
You can also manually trigger the workflow:
Navigate to the “BREAKFIX_TRIGGER” runbook in the Runbooks section
Select the “Create Run” button positioned in the top right corner of the interface
After initiating the process, a confirmation dialog will appear with a “View Run” link
Selecting this link will redirect you to a page displaying comprehensive job status and details
The automated nature of this workflow ensures that system issues are addressed promptly without requiring constant monitoring or manual intervention.
Break/Fix Workflow Components#
The break/fix system consists of several key components that work together to diagnose and remediate issues with compute nodes. The following is a detailed explanation of each component:
BREAKFIX_TRIGGER#
The entry point runbook that:
Runs automatically every 5 minutes via time trigger
Checks for any drained nodes in BCM
Initiates the triage process for affected nodes
Routes to the appropriate diagnostic workflow
BREAKFIX_COMPUTE_TRAY_TRIAGE#
This runbook is automatically triggered by BREAKFIX_TRIGGER and performs comprehensive triage on drained compute nodes.
This runbook performs comprehensive triage on drained compute nodes with two main workflows:
Workflow for Unresponsive Compute Nodes#
Initial Assessment
Tests connectivity using ping to check if compute nodes are responsive or unresponsive
Identifies nodes that are already unresponsive and require recovery
Recovery Process
Initiates power cycle for nodes that are down
Waits and checks if hosts come back online
Waits until the AHR agent is connected to confirm successful recovery
Failure Handling
Creates Support ticket for hosts that fail to start up (if opted in to support ticket service)
Validation
For recovered nodes, automatically runs BREAKFIX_COMPUTE_TRAY_VALIDATION to verify functionality
Workflow for Responsive Compute Nodes#
GPU Recovery Assessment
Checks if any GPU recovery action is present
Routes to GPU_RECOVERY runbook if GPU issues are detected
Automatically runs BREAKFIX_COMPUTE_TRAY_VALIDATION for nodes without specific issues
GPU_RECOVERY#
This specialized diagnostic runbook is automatically invoked by BREAKFIX_COMPUTE_TRAY_TRIAGE when GPU-related issues are detected.
This specialized diagnostic runbook focuses on GPU-related issues:
Verification and Assessment
Verifies the node is still drained from BCM
Categorizes recovery actions (Reboot, Reset, or None)
Recovery Actions Based on Type
For Reboot Action:
Reboots the node requiring GPU reboot
Waits for host to come back online
Automatically runs BREAKFIX_COMPUTE_TRAY_VALIDATION if host is up
Creates Support ticket for host that fail to start up (if opted in to support ticket service)
For Reset Action:
Resets the GPU
Automatically runs BREAKFIX_COMPUTE_TRAY_VALIDATION to verify on successful GPU reset
If reset fails, automatically runs BREAKFIX_DIAG_DUMP and creates a Support Ticket (if opted in to support ticket service)
For No Action Required:
Automatically runs BREAKFIX_COMPUTE_TRAY_VALIDATION directly
BREAKFIX_COMPUTE_TRAY_VALIDATION#
This runbook is automatically executed after remediation actions to validate system health as part of the automated workflow following triage and recovery operations.
After remediation actions, this runbook validates the system health:
Comprehensive Testing
Runs testing suites to validate the compute node
Executes HPL test (HPL use mpirun for single-node execution instead of Slurm for break/fix scenarios)
Runs AHR prolog script to prevent undraining of nodes that are still failing prolog checks, since undraining will result in them being drained again at the next Slurm invocation
Result Handling
For failed tests, automatically runs BREAKFIX_DIAG_DUMP for detailed diagnostics
For passed tests, undrains/untags the host to return it to service
BREAKFIX_DIAG_DUMP#
This runbook is automatically triggered when validation tests fail, collecting comprehensive diagnostic information for support ticket creation.
This runbook collects comprehensive diagnostic information:
Runs NVSSVT (NVIDIA System Software Validation Toolkit)
Collects NVSM (NVIDIA System Management) health dumps
Executes EUD (End User Diagnostics)
Runs Partnerdiag if necessary
Creates a consolidated diagnostic log dump package
Generates a Support ticket with diagnostic log for support (if opted in to support ticket service)
Prerequisites for EUD and Partnerdiag:
EUD: Binary must be installed on every compute node for execution
Partnerdiag: Binary must be installed on the head node under path
/cm/shared/partnerdiagIf these binaries are not properly installed, EUD and Partnerdiag will be skipped during diagnostic collection
View Break/Fix Result#
Users can monitor break/fix operations and determine outcomes through multiple methods:
Accessing Break/Fix Results#
Via Runbook Execution View:
Click “Runs” in the upper left corner
Filter by “BREAKFIX_TRIGGER” to see all break/fix executions
Select a specific run to view detailed execution flow
Via Resource Run History:
Navigate to “Resources” in the left panel and search for the resource (e.g., “node01”)
Click on the resource name
View the “Run History” page which displays all runbooks the resource participated in, with execution timestamps and status
Filter or search for BREAKFIX related runbooks to see the complete history of remediation attempts for that specific node
Understanding Break/Fix Outcomes#
Successful Recovery Indicators:
Node status changes from “DRAINED” to “IDLE” or “ALLOCATED” in BCM
Maintenance tag is removed from the node
BREAKFIX_COMPUTE_TRAY_VALIDATION shows “PASSED” status
Node is automatically returned to service
Failed Recovery Indicators:
Node remains in “DRAINED” state
Support ticket is automatically created (if opted in to support ticket service)
BREAKFIX_DIAG_DUMP execution indicates diagnostic collection
Maintenance tag remains on the node
Drain reason is updated to add “(AHR complete)” to indicate AHR processing has finished. Note that “(AHR in-progress)” indicates Break/Fix is still processing the node.
Determining Recovery Path#
GPU Recovery Path:
Look for GPU_RECOVERY runbook execution in the workflow
Check if GPU reboot or reset actions were performed
Validation results indicate GPU functionality restoration
Power Cycle Recovery Path:
BREAKFIX_COMPUTE_TRAY_TRIAGE shows auxiliary power cycle execution
Node connectivity tests show successful recovery
Monitoring Ongoing Operations#
Break/fix operations run every 5 minutes automatically
Check the “maintenance” tag to see which nodes are currently being processed
Review recent BREAKFIX_TRIGGER executions to track system-wide break/fix operations
NVIDIA Mission Control autonomous hardware recovery Break/Fix Post RMA#
Break/Fix Post RMA Introduction#
The NVIDIA Mission Control autonomous hardware recovery Break/Fix Post RMA workflow automates the process of bringing hardware components back into service after a Return Merchandise Authorization (RMA) replacement. This workflow ensures that replaced hardware is properly configured, firmware is updated to the correct versions, and the component is thoroughly validated before returning to production.
For B200 systems, the Post RMA workflow focuses on individual compute node replacement, including GPU tray replacement following the procedures outlined in the DGX B200 Field Replaceable Units (FRU) documentation.
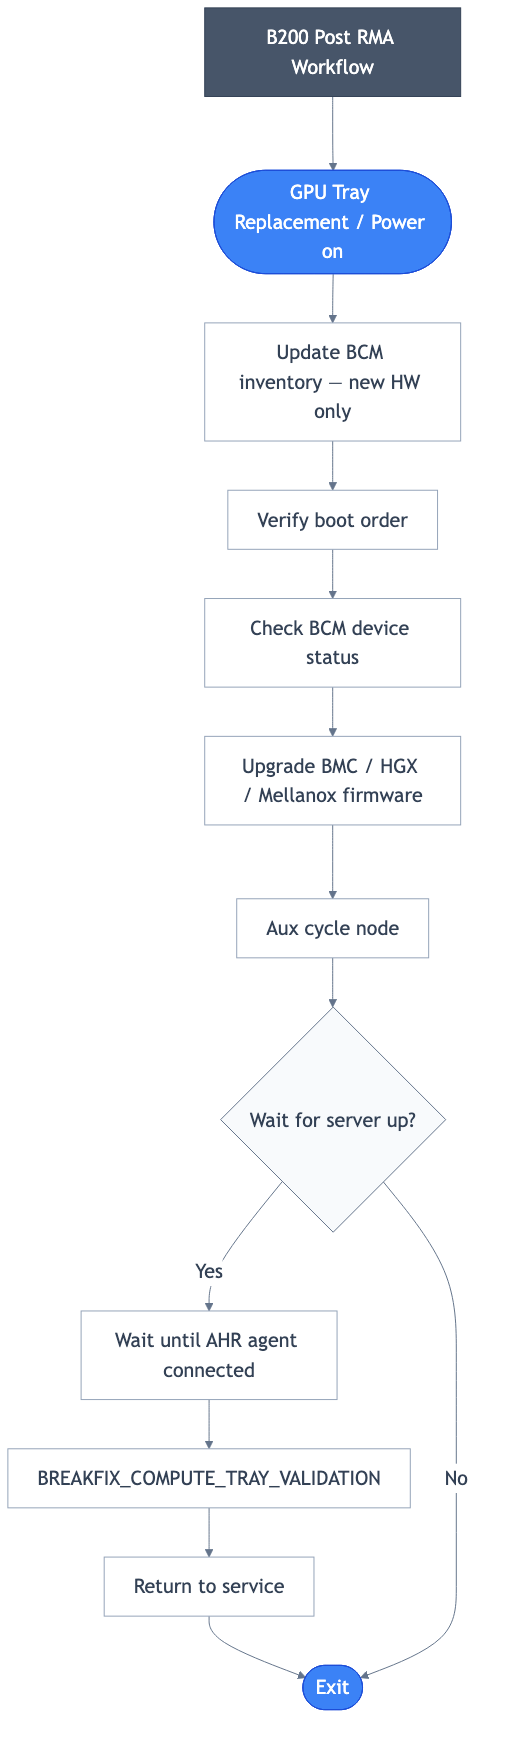
Figure: Break/Fix Post RMA Workflow for B200 - This diagram illustrates the comprehensive post-RMA process for B200 compute node replacement, starting with physical GPU tray replacement (if needed), followed by power-on, boot order verification, and firmware updates to ensure correct versions. The workflow then proceeds through system validation including agent connectivity verification and comprehensive testing via BREAKFIX_COMPUTE_TRAY_VALIDATION, and automatically returns validated hardware to service.
Key Features#
Automated Configuration: Configures replaced hardware components with proper settings
Firmware Updates: Updates firmware to match the required versions for the environment
Comprehensive Validation: Ensures hardware meets all operational requirements before return to service
Automatic Service Restoration: Returns validated nodes to production automatically
Post RMA Workflow Components#
The Post RMA workflow consists of several automated steps:
Physical Replacement Procedures#
GPU Tray Replacement Instructions (Two people are needed for this procedure)
Power down the system (system administrator)
Cordon the node from job scheduler so no more workloads are sent to the system
Shut down the system from the console
Confirm the system is turned off
Wait 5 minutes before working on the system to make sure the internal components have cooled off
Unplug all power cords from the power supplies
Note: Unlike GB200, B200 GPU tray has no front cables to disconnect
Prepare workspace and confirm clearance
Confirm there is enough space and clearance at the back of the rack to access and remove the GPU tray from the system
Prepare a solid flat surface that will hold the GPU tray
If needed, unplug cables that are in the way or remove PDUs that might be blocking access
If obstructions can’t be removed, the system may need to be pulled out of the rack using a mechanical lift
Release GPU tray from the system
Loosen the thumbscrews that hold the release levers in place
Pull the ejection levers out to disengage the midplane connectors
Note: The levers help eject the GPU tray connectors from the midplane
Pull the GPU tray out of the system
Fully extend the levers and begin pulling the tray out
Use extreme caution during this procedure to avoid damaging the sliding mechanism
The tray will stop sliding and lock halfway out. Use the buttons on both sides to release the tray from the locking mechanism
NOTE: Do not use the handles to carry the tray as they will bend and may break
With the help of another person, remove the GPU tray completely
Slowly pull out the GPU tray with the help of another technician (requirement due to weight and size)
Two people are necessary to support the weight of the component
Pull the tray all the way out until fully released from the system
Install the new GPU tray
With the help of another person, install the new GPU tray
Pick up the new tray with the help of your partner
Fully extend the levers so they don’t get in the way during insertion
Insert the GPU tray into the slot
Two people are necessary to support the weight of the component
Secure the GPU tray in the system
Use the levers to help with the mating of the connectors from the GPU tray to the midplane
Close the GPU tray levers to lock the tray in place
Tighten the GPU tray thumbscrews to secure the tray
Install all power cords
Plug in all the power cords to the power supplies
Power on the system and continue with automated workflow
Power on system from the console
Wait for system to boot up completely
Continue with GPU tray post RMA workflow in autonomous hardware recovery (AHR)
Power and Connectivity Verification#
After physical replacement:
System powers on successfully
BMC connectivity is established
Host OS boots properly
AHR agent connection is verified
Firmware Updates#
The workflow automatically:
Updates BMC firmware to the required version
Updates HGX firmware to the required version
Updates Mellanox firmware to the required version
System Validation#
Comprehensive validation through BREAKFIX_COMPUTE_TRAY_VALIDATION:
Hardware component detection
GPU functionality tests
Memory and storage validation
Network connectivity verification
Performance benchmarking (HPL test)
Prolog checks to ensure Slurm compatibility
Running the Post RMA Workflow#
Step 1: Update BCM Inventory (ONLY FOR NEW HARDWARE)#
Note: This step is ONLY required when installing a new compute tray. Skip this step for repaired trays as MAC addresses remain unchanged.
For new hardware replacement, update the BCM inventory with new MAC addresses and hardware identifiers:
Navigate to the “BREAKFIX_POST_RMA_UPDATE_BCM_INVENTORY” runbook in the Runbooks section
Configure the required parameters (MAC addresses and serial numbers are provided by the Enterprise Support team):
HOST_NAME: The hostname of the replaced hardware component (e.g., a07-p1-dgx-03-c08)
BF_PORT2_0_MAC: First Bluefield Port 2 MAC address (enp170s0f1np1)
BF_PORT2_1_MAC: Second Bluefield Port 2 MAC address (enp41s0f1np1)
BMC_MAC: MAC Address of the BMC (optional)
NODE_IDENTITY_MAC: Node Identity MAC (defaults to first Bluefield Port 2 if not specified) (optional)
TRAY_SERIAL_NUMBER: Serial Number of the Tray (optional)
Select “Create Run” to initiate the BCM inventory update
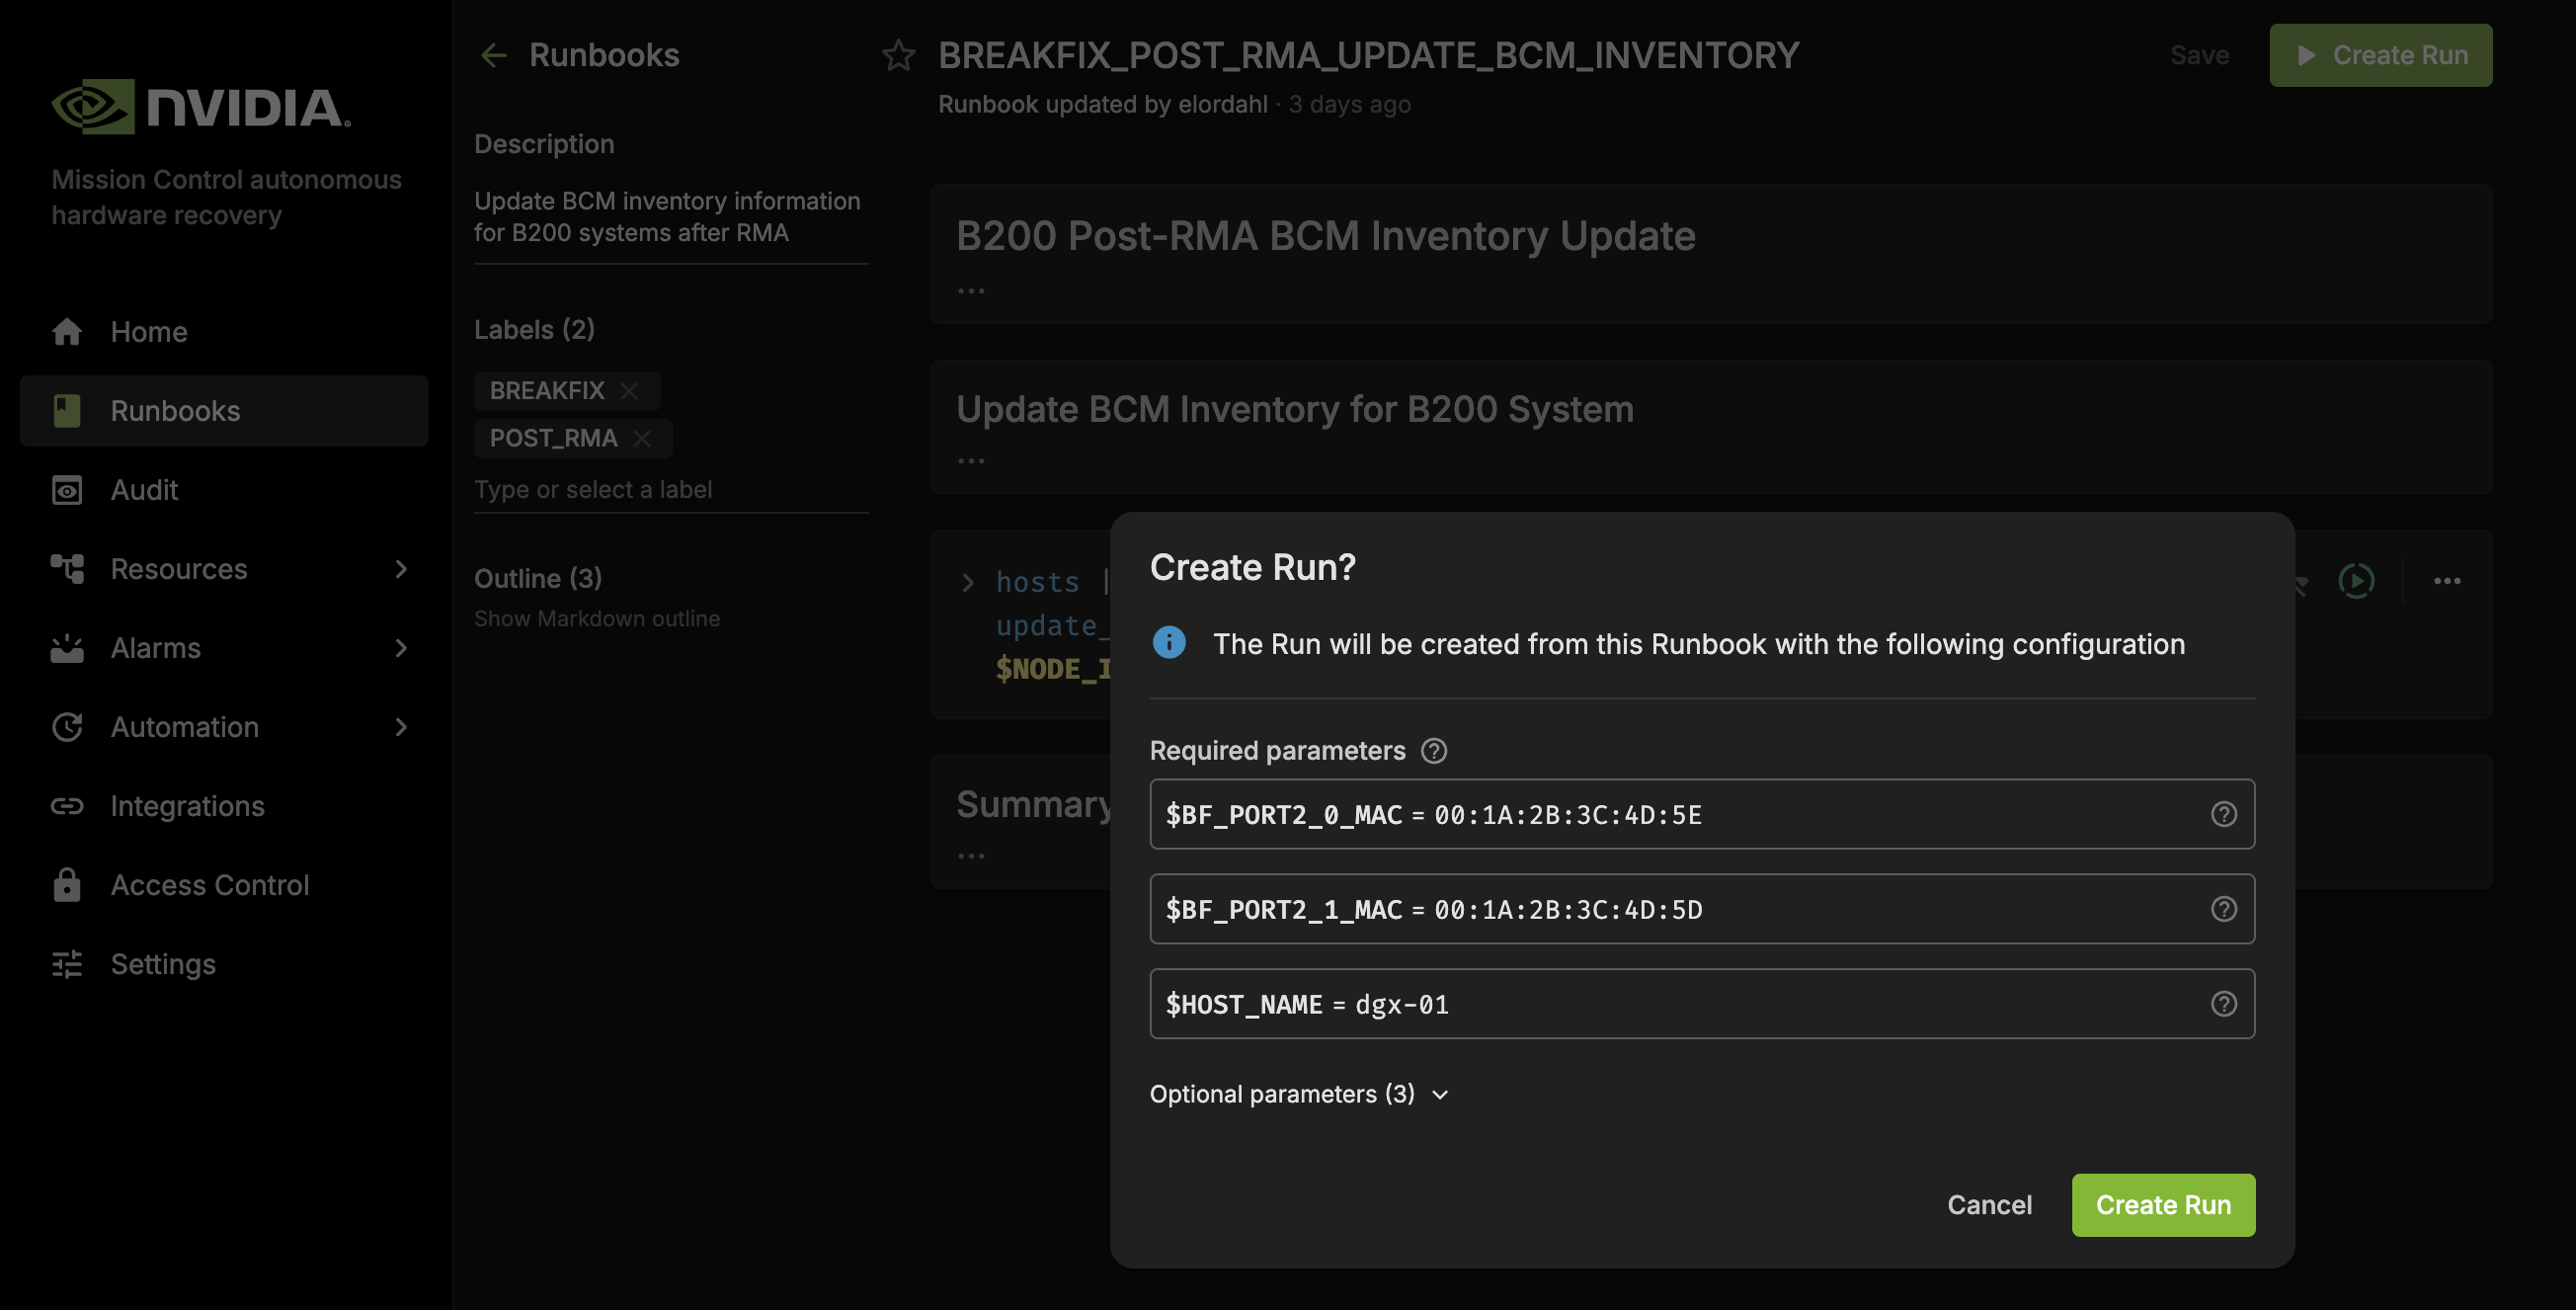
Monitor the execution progress to ensure successful completion
Step 2: Execute Main Post RMA Workflow#
After successfully updating the BCM inventory (if required for new hardware), proceed with the main Post RMA workflow:
To execute the Post RMA workflow:
Complete Physical Replacement
Follow the GPU tray replacement procedures outlined previously
Ensure system is powered on and booting
Navigate to the BREAKFIX_POST_RMA Runbook
Access the NVIDIA Mission Control autonomous hardware recovery portal
Go to Runbooks section
Search for “BREAKFIX_POST_RMA”
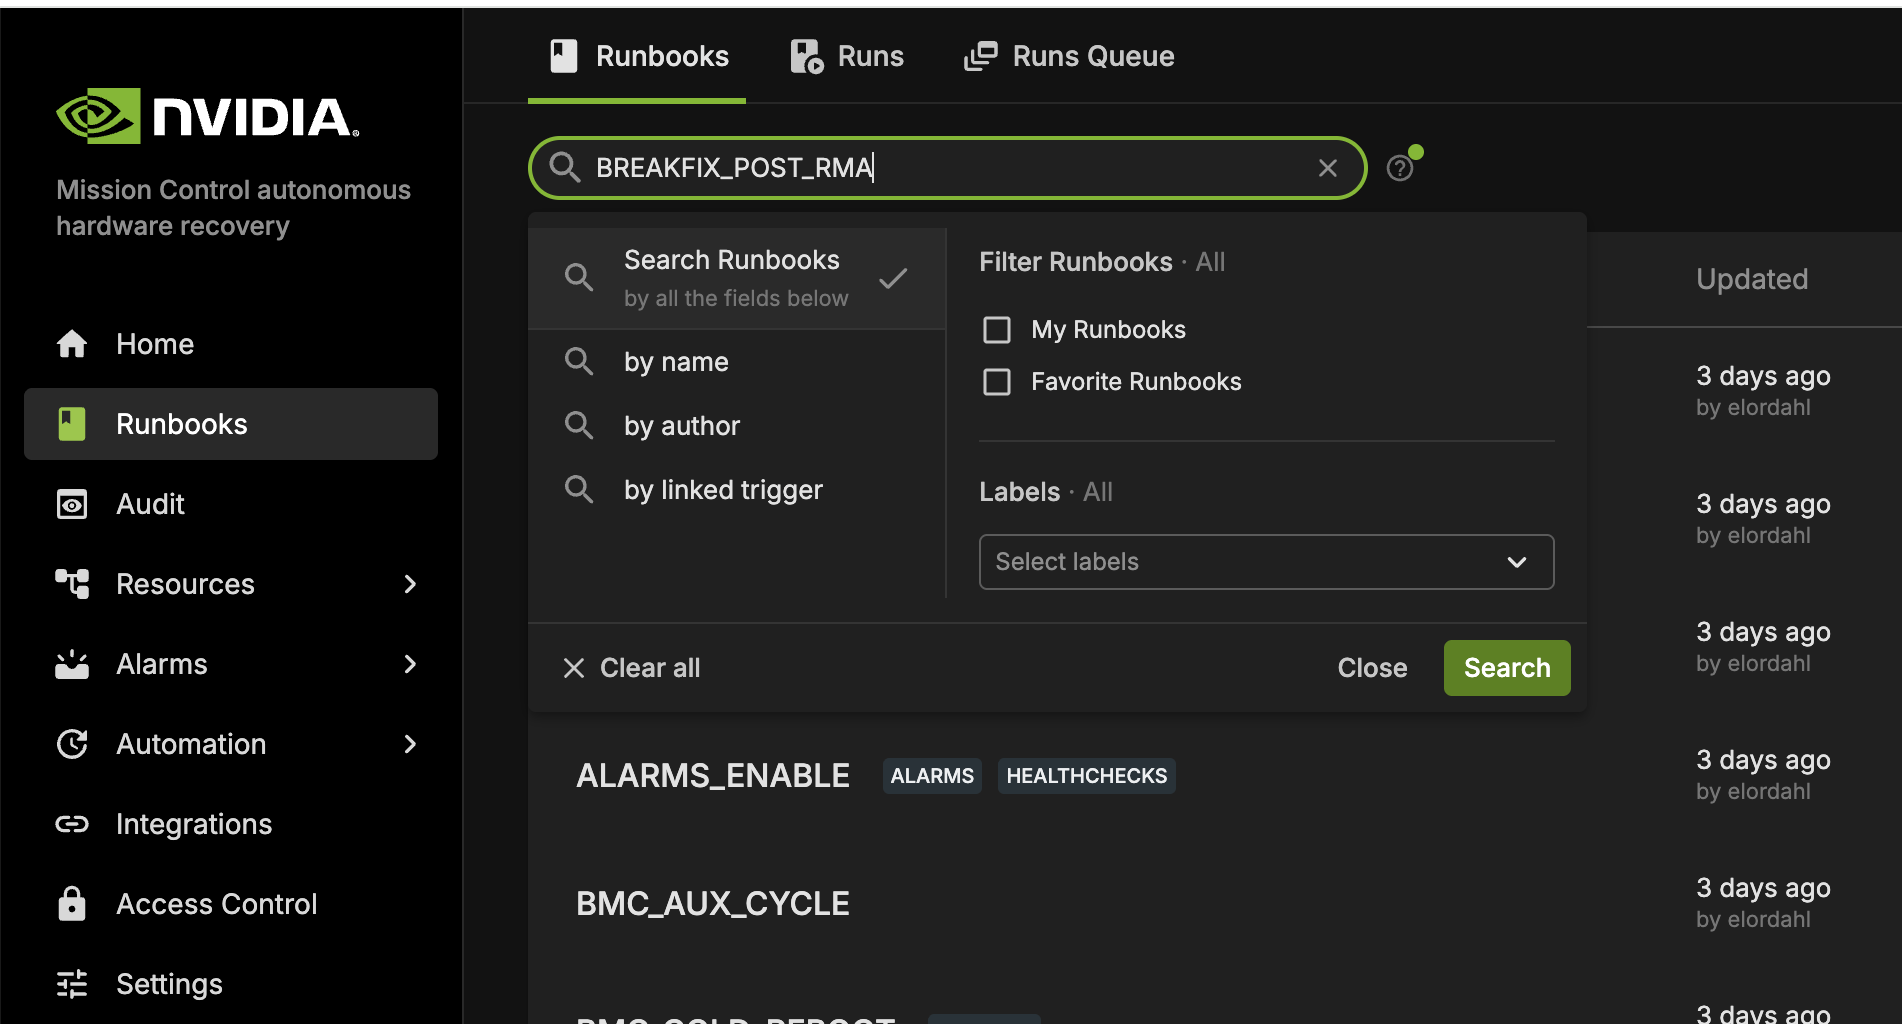
Configure the required secrets (if not already configured):
AHR_API_ENDPOINT: The API endpoint URL for NVIDIA Mission Control
AHR_TOKEN: Authentication token for API access
To add or update these secrets:
In the Shoreline UI, go to Settings.
Click on the Secrets section.
Use the + Secret button to create:
AHR_API_ENDPOINT— Provide the correct API endpoint.AHR_TOKEN— Provide the secure API token.
If a secret already exists, click its name to update the value.
Click Save to persist the changes.
🔐 These secrets will be securely injected into the action at runtime.
Configure Required Parameters
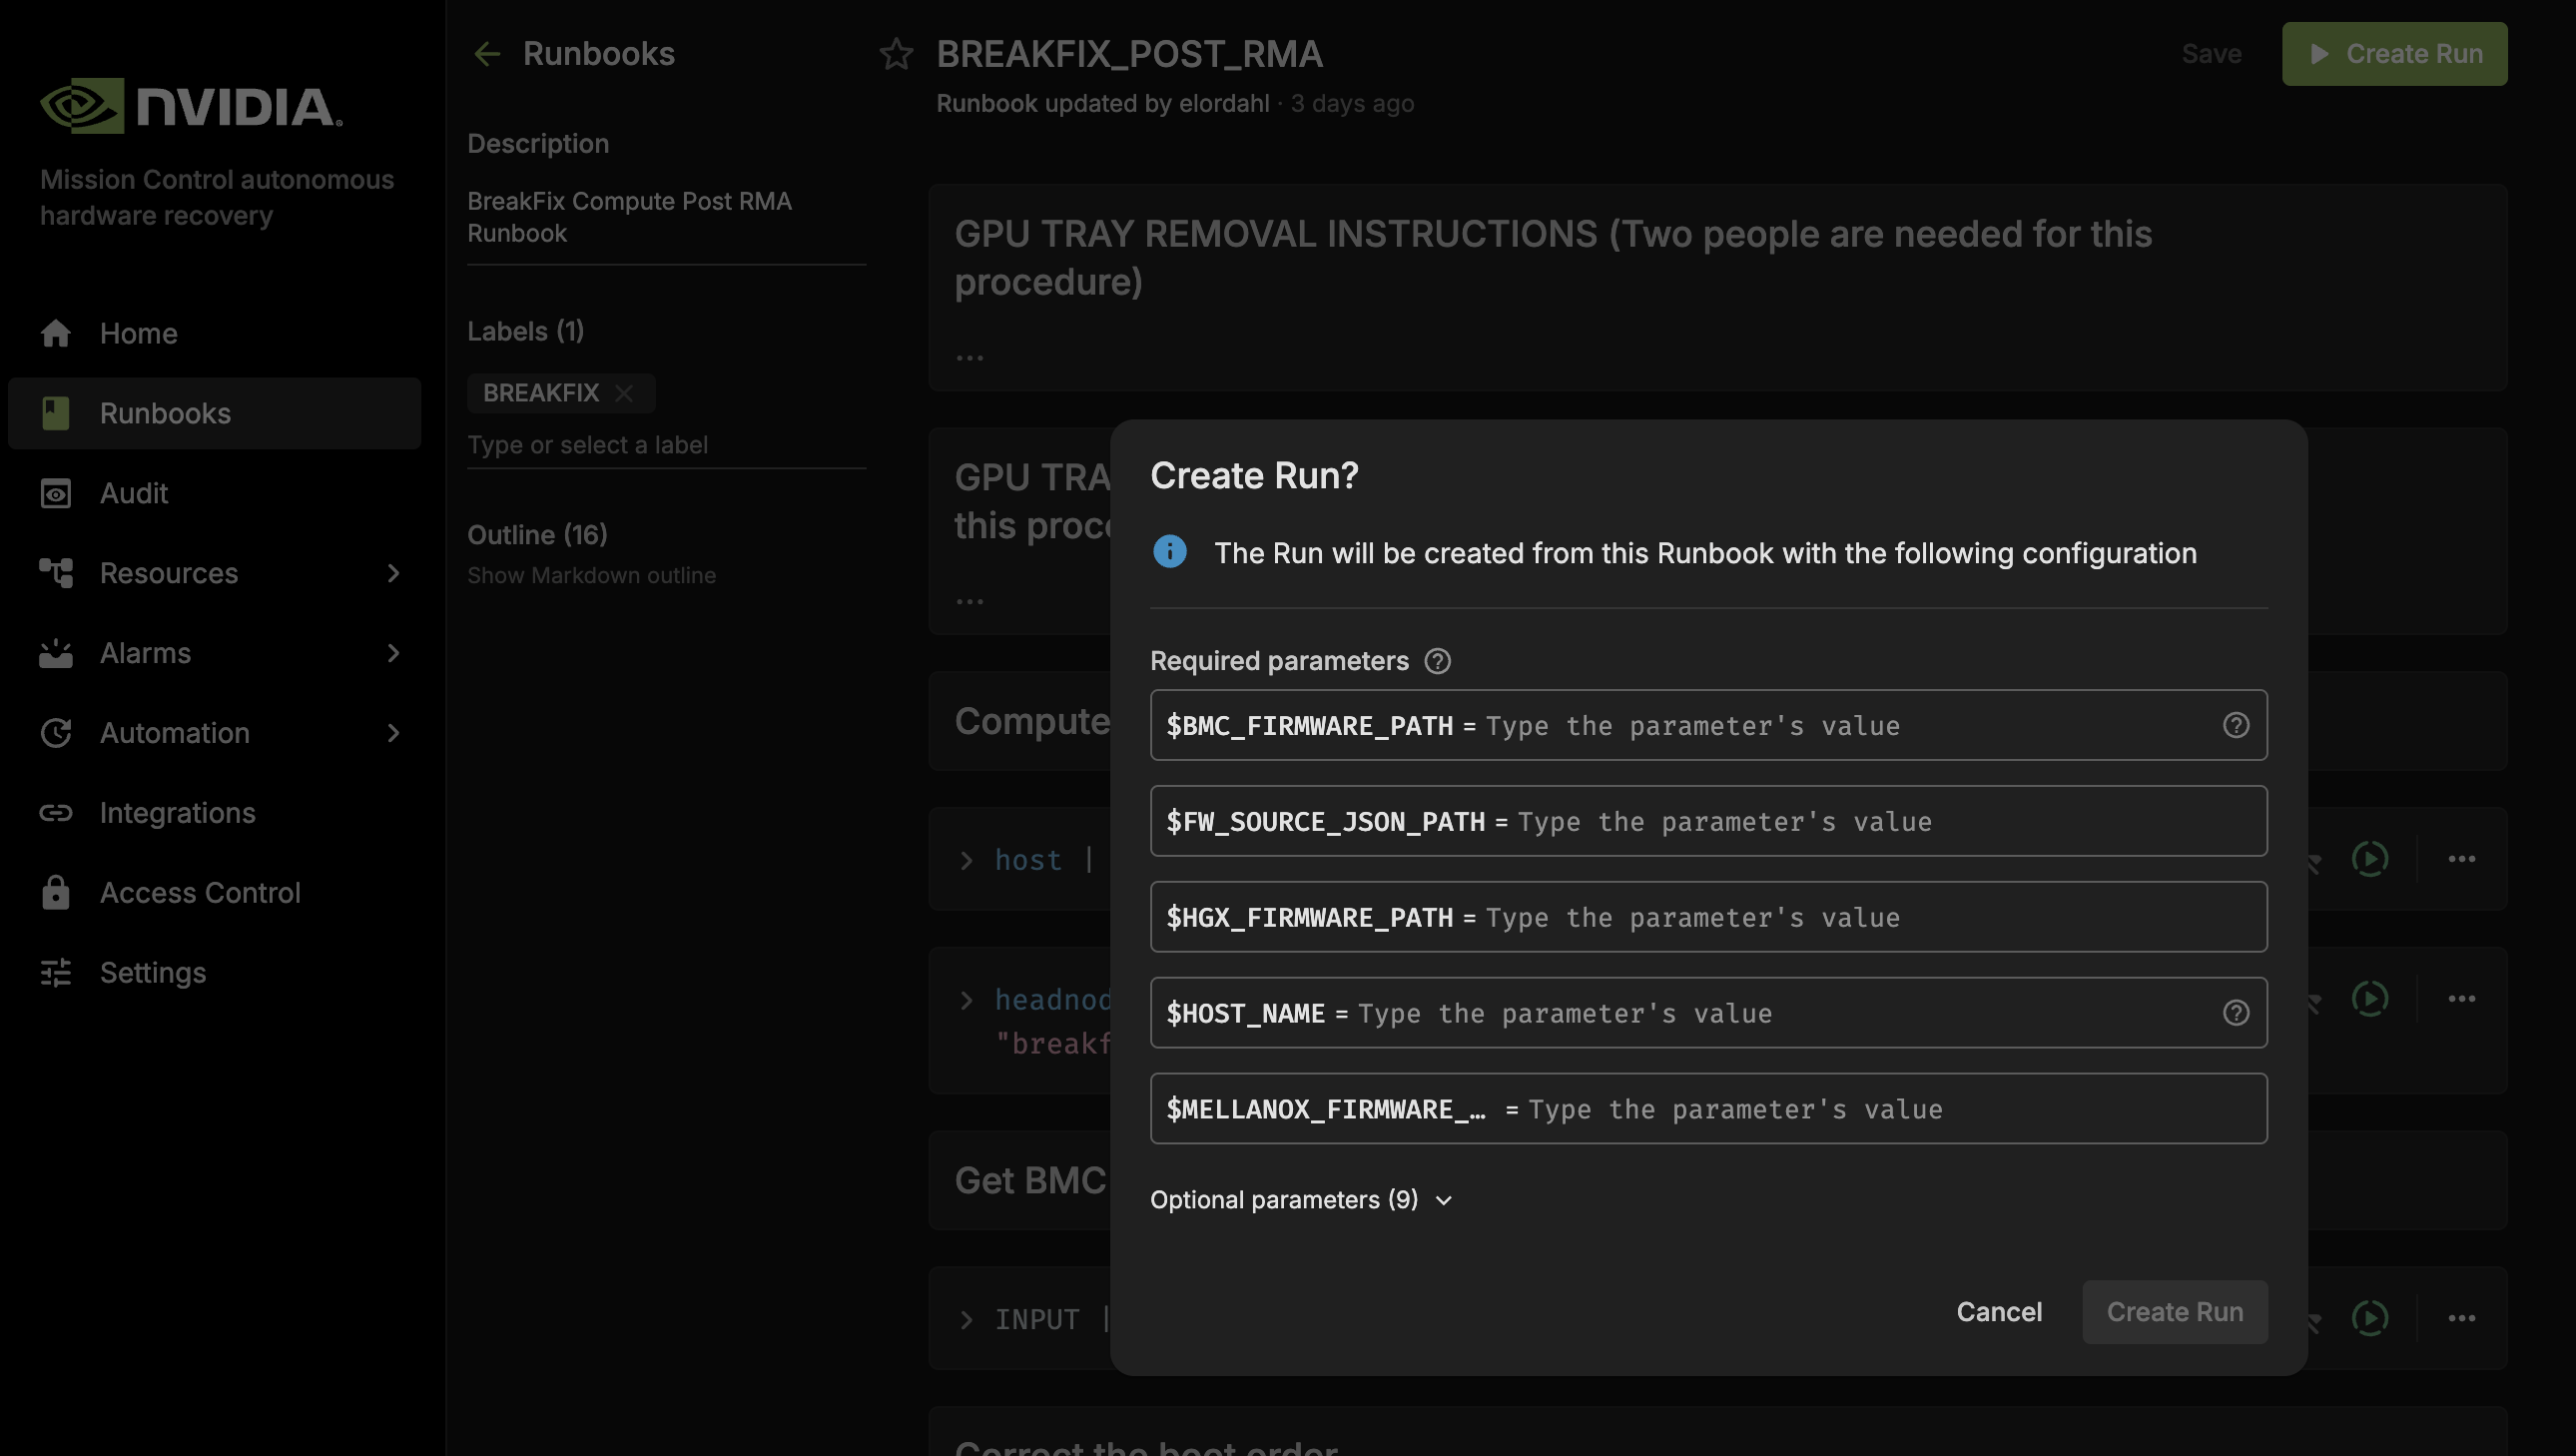
HOST_NAME: The hostname of the replaced node (e.g., “node01”)
BMC_FIRMWARE_PATH: Full path to the BMC firmware package directory or .fwpkg file
HGX_FIRMWARE_PATH: Full path to the HGX firmware package directory or .fwpkg file
MELLANOX_FIRMWARE_PATH: Full path to the Mellanox firmware package directory or .fwpkg file
FW_SOURCE_JSON_PATH: Full path to the firmware source json file
Example:
HOST_NAME: a04-p01-dgx-04-c16
BMC_FIRMWARE_PATH: /cm/shared/firmware/nvfw_DGX_250629.1.0.fwpkg
HGX_FIRMWARE_PATH: /cm/shared/firmware/nvfw_HGX_DGXB100-B200x8_250828.1.1.fwpkg
MELLANOX_FIRMWARE_PATH: /cm/shared/firmware/network
FW_SOURCE_JSON_PATH: /cm/shared/firmware/firmware_source.json
Create and Monitor the Run
Click “Create Run” to initiate the workflow
Click “View Run” in the confirmation dialog
Monitor progress through each workflow step
Wait for Completion
The workflow will take approximately 2-3 hours depending on firmware updates required
Monitor for any errors or failures during execution
Post RMA Workflow Results#
Successful Post RMA Indicators#
All Steps Complete: Each workflow component shows “Complete” status
Firmware Updated: All firmware versions match the golden configuration
Validation Passed: BREAKFIX_COMPUTE_TRAY_VALIDATION completes successfully
Node Returned to Service: Node is automatically undrained and available for workloads
Tags Removed: Maintenance tags are cleared from the node
Failed Post RMA Indicators#
Firmware Update Failure: One or more firmware components failed to update
Boot Failure: System fails to boot after firmware update
Validation Failure: Hardware tests fail during BREAKFIX_COMPUTE_TRAY_VALIDATION
Agent Connection Timeout: AHR agent fails to connect within timeout period
Troubleshooting Post RMA Failures#
Firmware Update Failures:
Verify firmware package path is correct and accessible
Check BMC connectivity and credentials
Review firmware package compatibility with hardware
Manually retry firmware update step
Boot Failures:
Check power connections
Verify BMC is accessible
Review console logs for boot errors
Check boot order configuration
Validation Failures:
Review BREAKFIX_COMPUTE_TRAY_VALIDATION logs for specific test failures
Check hardware installation (GPU tray properly seated)
Verify all power connections
Review GPU detection and functionality
May require additional hardware troubleshooting or RMA
Agent Connection Timeouts:
Verify network connectivity
Check firewall rules
Ensure AHR agent service is running
Review agent logs on the compute node
Accessing Post RMA Results#
Via Runbook Execution:
Navigate to “Runs” in the left panel
Filter by “BREAKFIX_POST_RMA”
Select the specific run for your node
Review each step’s execution status and logs
Via Resource History:
Navigate to “Resources”
Search for the replaced node
Click on the node name
Review “Run History” for BREAKFIX_POST_RMA execution
Check timestamps and outcomes
B300#
Automated Baseline Testing with NVIDIA Mission Control autonomous hardware recovery#
GPU B300 supports Automated Baseline Testing with NVIDIA Mission Control autonomous hardware recovery. The following section mirrors the baseline testing procedures for B300 (SUT/MUT).
Introduction#
The NVIDIA Mission Control autonomous hardware recovery portal enables efficient automation of baseline testing procedures for GPU B300 systems. This comprehensive testing framework can be flexibly executed across various scales of infrastructure, from individual compute nodes to multiple node configurations. The system performs extensive validation of critical compute node components, including CPU/GPU/Memory/storage functionality, network connectivity, and firmware versioning. Additionally, it incorporates industry-standard performance benchmarking tools such as HPL, NCCL, and Nemotron (Large Language Model) to assess system capabilities. This streamlined approach significantly enhances both testing efficiency and thoroughness while reducing execution time.
Note: For B300, unit means an individual compute node.
Entrypoint of Automated Testing#
A centralized automated baseline testing interface has been established to facilitate streamlined test execution and management. This unified entry point provides comprehensive access to the testing framework, enabling efficient navigation and one-click implementation of all testing procedures.
To access the baseline testing interface:
Access the NVIDIA Mission Control autonomous hardware recovery portal using your credentials and navigate to the Runbooks section.
Locate the “DGX_SUPERPOD_BASELINE_TESTING” runbook through the search functionality (reference the interface depicted following)
Upon selecting the “DGX_SUPERPOD_BASELINE_TESTING” runbook, you will be presented with the interface shown below. The subsequent sections of this documentation will provide detailed guidance on executing various testing procedures.
Run SUT (Single Unit Testing) Job#
Guide to Initiating Baseline Testing Procedures for Single Unit Configuration when one or multiple nodes are ready for testing.
Navigate to the “DGX_SUPERPOD_BASELINE_TESTING” runbook utilizing the previously outlined navigation protocol.
Ensure the “DGX_SUPERPOD_BASELINE_TESTING_SUT” component is activated by toggling its switch control. This control is located on the right side of its immediate group of interface icons. The switch indicator in its default deactivated state should be visually distinct from the activated state. Note: When activated, the switch indicator displays as a green circle with a play icon.
Verify that the “DGX_SUPERPOD_BASELINE_TESTING_MUT” component is in its deactivated state. This deactivated state is indicated by its corresponding switch control displaying as a grey circular icon containing a muted play symbol, signifying it is ‘Off’.
Select the “Save” button positioned in the top right corner of the interface to preserve your settings.
Upon successful completion of these preliminary steps, your runbook configuration should reflect the specified parameters as illustrated below.
To initiate a run, select the Create Run button located at the top right corner of the interface. A new window will appear as shown below. For detailed information about each parameter, simply hover over the info icon beside it.
You are required to provide the following inputs for the runbook:
FW_SOURCE_JSON_PATHSpecify the file path to the golden configuration JSON file included in the firmware package. This file defines the reference settings used for validation. If the file is not available, set this parameter to NA.IGNORE_LISTProvide a list of nodes to exclude from the test only if required. Leave the value as “none” if no nodes need to be ignored. This parameter supports regular expressions. Here are some examples:Single node: node01
List format: [“node01”, “node02”]
Pipe-delimited string: node01|node02
After entering the correct value, select the “Create Run” button to initiate the process. A confirmation dialog will appear with a “View Run” link illustrated below. Selecting this link will redirect you to a new page displaying comprehensive job status and details. For additional information regarding job monitoring and results, please refer to the “Check Job Status and Result” section of this documentation.
Predefined the timeout for SUT is 6 hours. You can adjust based on your requirements.
Run MUT (Multi Unit Testing) Job#
Guide to Initiating Baseline Testing Procedures for Multi-Unit Configuration.
Navigate to the “DGX_SUPERPOD_BASELINE_TESTING” runbook utilizing the previously outlined navigation protocol.
Ensure the “DGX_SUPERPOD_BASELINE_TESTING_MUT” component is activated by toggling the switch control. This control is located on the right side of its immediate group of interface icons. The switch indicator in its default deactivated state should be visually distinct from the activated state. Note: When activated, the switch indicator displays as a green circle with a play icon.
Verify that the “DGX_SUPERPOD_BASELINE_TESTING_SUT” component is in its deactivated state. This deactivated state is indicated by its corresponding switch control displaying as a grey circular icon containing a muted play symbol, signifying it is ‘Off’.
Select the “Save” button positioned in the top right corner of the interface to preserve your settings.
Upon successful completion of these preliminary steps, your runbook configuration should reflect the specified parameters as illustrated below.
Select the “Create Run” button positioned in the top right corner of the interface, the new window will pop out as illustrated below.
After entering the correct Required parameter values, select the “Create Run” button to initiate the process. A confirmation dialog will appear with a “View Run” link illustrated below. Selecting this link will redirect you to a new page displaying comprehensive job status and details. For additional information regarding job monitoring and results, please refer to the “Check Job Status and Result” section of this documentation.
Predefined the timeout for MUT is 48 hours. You can adjust based on your requirements.
Runbook Configurations#
Before you initiate real jobs, we’d like to provide you with a guide on how to check the Runbook Configurations.
Select “Runbook” from the left navigation panel, then use the search field on the right side of the page to find your runbook by name, as shown in the illustration below.
Below is the list of all mission control related runbooks including its name and description for B300 systems.
Category |
Runbook Name |
Description |
|---|---|---|
DGX_SUPERPOD_BASELINE_TESTING |
EntryPoint Runbook |
|
SUT |
DGX_SUPERPOD_BASELINE_TESTING_SUT |
EntryPoint Runbook of SUT (Single Unit Testing) |
SUT1 |
EntryPoint Runbook of all single node health checks |
|
SINGLENODE_HEALTHCHECK_GPU_CPU |
Baseline health checks for GPU and CPU |
|
SINGLENODE_HEALTHCHECK_MEMORY_STORAGE |
Baseline health checks for Memory and Storage |
|
SINGLENODE_HEALTHCHECK_NETWORK |
Baseline health checks for Network |
|
SINGLENODE_HEALTHCHECK_SOFTWARE |
Baseline health checks for installed software |
|
SINGLENODE_HEALTHCHECK_FIRMWARE |
Baseline health checks for firmware |
|
SUT2 |
EntryPoint Runbook of component testing |
|
MEMORY_BENCHPRESS |
Benchmark testing for memory |
|
CUDA_SAMPLES |
Benchmark testing for CUDA |
|
HPL_MXP_TEST_SINGLE_NODE_MPIRUN |
HPL testing on single node separately |
|
NVBANDWIDTH_SINGLE_NODE_MPIRUN |
Bandwidth testing running on single node |
|
NCCL_TEST_SINGLE_NODE_MPIRUN |
NCCL testing on single node |
|
SUT3 |
EntryPoint Runbook of burn-in performance testing |
|
HPL_MXP_TEST_BURN_IN_SINGLE_NODE_MPIRUN |
HPL testing on the single node with long duration |
|
MUT |
DGX_SUPERPOD_BASELINE_TESTING_MUT |
EntryPoint Runbook of MUT (Multi Unit Testing) |
MUT1 |
EntryPoint Runbook of rack level connectivity testing |
|
INFINIBAND_CHECK |
InfiniBand connectivity validation |
|
MUT2 |
EntryPoint Runbook of multi-rack performance testing |
|
NVBANDWIDTH_MPIRUN |
Bandwidth testing across multiple nodes |
|
P2P_IPERF_MPIRUN |
Point-to-point network performance testing |
|
HPL_MXP_TEST_MPIRUN |
HPL testing across multiple nodes |
|
. |
NCCL_TEST_MPIRUN |
NCCL testing across multiple nodes |
HPL_MXP_TEST_BURN_IN_MPIRUN |
HPL testing cross multiple nodes with long duration |
|
MUT3 |
EntryPoint Runbook of cluster level testing |
|
Nemotron_15B_MPIRUN |
LLM testing with mocked data |
Runbook Interface Guide#
When accessing the runbook as shown in the example below, please note these important configuration elements:
Central Workspace#
The main content area displays your resource queries, commands, scripts, or nested runbooks.
Each row represents an individual cell
Each cell includes a play button for isolated execution
Toggle switches allow you to enable/disable specific cells
Configuration Panel (Right Side)#
The right panel contains several critical configuration sections:
Parameters Contains all required inputs for runbook execution
Triggers Configure automated execution methods:
Alarm triggers
Time Trigger (cron jobs)
Other integrations like AlertManager
Users Manage permissions for who may run or edit the runbook
Settings General runbook configuration options
… more runbook operations including:
Clone functionality
Export options
Delete runbook
etc.
Check Job Status and Result#
This section provides comprehensive guidance on monitoring runbook execution progress and interpreting results.
Check Job Status#
To monitor the status of a runbook execution:
After creating a run, click the “View Run” link in the confirmation dialog
Alternatively, navigate to “Runs” in the left panel and select your specific execution
The run details page displays:
Overall run status
Start time and duration
Each cell’s execution status
Resource filtering information
Output from each step
Status Types and Definitions#
Running The job is currently executing. Progress is displayed as a percentage based on completed cells.
Completed The job has finished execution. Note that completion status does not guarantee successful results. Please review the detailed output in the results section.
Aborted The job terminated prematurely due to execution errors, such as cell syntax issues.
Terminated The job was forcibly ended by the system.
Timed Out The job exceeded its maximum allowed execution duration (default timeout is 1 hour for runbook, 1 minute for action)
Canceled The job was manually terminated by a user.
Check Job Results#
When the job status displays “Completed,” you may proceed to review the job results. If the job status shows otherwise, you may click into the job for more details and troubleshooting.
Cell Structure Overview#
Each cell in the runbook contains three primary components:
Main Content Area: This section displays the executed script or command. On the right side of the cell, you’ll find several control icons. While most icons were detailed in the previous section, the “fx” icon is particularly valuable as it displays all parameters along with input/output values for the specific cell when hovering over it.
Execution Information Bar: Located in the middle of the cell, this light grey text line indicates the execution start time and duration of the operation.
Results Section: The bottom portion displays:
Exit code status
Execution location information
Complete command output (accessible by clicking the “Output” column contents)
Additional Features:
Configure output display preferences
Toggle the density
Download results in various formats using the download options menu
Streamlined Error Navigation: When a job contains numerous cells, manually checking for failures becomes inefficient. Use the “Error outline” feature in the middle panel to quickly locate problematic cells. Simply click any item in this list to automatically navigate to the corresponding failed cell.
Notes: there are reports available for the major runbooks. Details can be found “Reports of Testings”
Handling Job Failures#
In the event of job or cell execution failures, the following remediation options are available:
Major Issue Resolution: Upon resolution of critical infrastructure issues (e.g., hardware replacement), a complete re-initialization of the SRT or MRT job is recommended.
Targeted Component Resolution: When specific components have been updated (e.g., firmware version upgrades), execute the relevant job or runbook within the existing session by selecting the “Run” button located in the upper-right interface section. This maintains all previously established parameters.
Individual Cell Correction: For isolated cell failures that have been addressed, execute the specific cell independently by activating the execution control (play button) positioned on the right margin of the cell interface. Note: This option might cause the difficulty to locate the job/run from the reports panel (Please refer Reports of Testing section below).
Firmware checks#
NVIDIA Mission Control autonomous hardware recovery includes firmware checks that extract the current firmware versions of the trays and switches, and compare them with the expected versions specified in the Source of Truth (SOT) file. The SOT file includes the expected versions for all components such as OS, HMC, ConnectX, etc., and is prepopulated. The SOT file can be obtained from the NVIS team.
The runbook extracts the expected versions of all firmware components and compares the current versions against them.
Updating the SOT file#
Place the SOT JSON file on the headnode and provide the complete file path as the input FW_SOURCE_JSON_PATH to the DGX_SUPERPOD_BASELINE_TESTING runbook. To update the file, simply replace it with the new file and update the path in the input parameter of the runbook accordingly.
Thresholds and Defaults#
The thresholds and default values for various tests are defined in the Golden Config File. The runbook picks the appropriate values, and compares it against the values on the nodes. This includes defaults such as number of GPUs and expected benchmarks for benchmarking tests (such as SRT2).
Golden Config File#
The Golden Config File (referred to as the defaults.env file on the trays and control nodes) contains the expected values for all benchmark thresholds, and other relevant settings. This file is distributed across all trays and loaded as environment variables, making its contents available during testing.
Updating the Golden Config File#
To update the golden config values, edit config/<CHIP>/defaults.yaml (for example, config/B200/defaults.yaml or config/GB200/defaults.yaml). The chip-specific env files are generated automatically from these YAML files during deployment — do not edit the generated files under Shoreline_files/generated/ directly.
Once the changes are made and saved, use the NVIDIA Mission Control autonomous hardware recovery Runbook Deployment section (from the NVIDIA Mission Control AHR installation documentation) to apply them via OpenTofu. This process will create a File object on NVIDIA Mission Control autonomous hardware recovery, which pushes the updated file automatically to all control and compute trays. Various tests, including firmware checks, prolog, and epilog checks, source the defaults.env file and utilize the expected values, now available as environment variables.
Reports of Testings#
NVIDIA Mission Control autonomous hardware recovery provides reports for baseline testing, reflecting the status of nodes (compute and switches) at each test stage. These reports help identify and troubleshoot root causes.
To access the NVIDIA Mission Control autonomous hardware recovery reports, click on Resources in the side menu, then select Reports.
The Landing page contains two tabs: Report Templates and Published Reports.
Report Templates provide templates for each stage of Baseline testing. These templates include bar graphs that display the PASS or FAIL status for different nodes during the tests. However, these templates are static and do not store any test data. This means that while you can view the templates, you cannot save or modify the test results within them.
To generate a report that records the test results along with timestamps, click Publish. This action will create a new report based on the template, which will capture the current status of the tests. The report will display PASS for tests that were successful and FAIL for those that did not pass, with each status reflecting the most up-to-date information. The report also includes links to additional reports at the top of the page. These links allow you to access the detailed results of the individual SUT and MUT tests that make up each stage, giving you a deeper insight into the performance and status of each test within the overall baseline testing process.
Note: Reports reflect updated information only after the SUT and MUT tests have been executed.
Guide to initiate Reporting for for Baseline Testing#
Navigate to the “DGX_SUPERPOD_BASELINE_TESTING_REPORT” under the Report Templates.
[Optional] While templates do not reflect the current status of the test suite, you can use it to view the current state before publishing the reports. Clicking the refresh button at the top of the report will load the current data.
Click on “Publish” to generate a timestamped instance of the template that can be easily viewed and shared. Additionally, it automatically publishes all linked reports at the top of the page, ensuring that all related data is included and accessible.
Retain the auto-generated name for the report which includes the timestamp or provide your own name.
Once the process starts, the published reports will begin generating in the background. This includes “DGX_SUPERPOD_BASELINE_TESTING_REPORTS” as well as all the SUT and MUT linked reports.
A pop-up notification will appear containing a hyperlink to access the published reports that are being currently generated.
When you publish the “DGX_SUPERPOD_BASELINE_TESTING_REPORTS”, it automatically triggers the publication of all “linked reports”, including the associated SUT and MUT reports, with the data captured at that given time.
All the reports will complete building in under a minute, and the “Linked Published Reports” will include the published reports for all the Linked Reports.
Navigating to Previously Published Reports#
Navigate to the Reports from the NVIDIA Mission Control autonomous hardware recovery Home Page
Click on “Published Reports”, and select the “DGX_SUPERPOD_BASELINE_TESTING_REPORT_timestamp” or any other report of interest.
You can also adjust the time range at the top of the screen to view reports generated within specific time frames. Options include viewing reports from the last 10 minutes, last 1 hour, or selecting a custom time range to explore older data beyond these periods.
Breakdown of a Published Report#
DGX_SUPERPOD_BASELINE_TESTING_REPORT#
“DGX_SUPERPOD_BASELINE_TESTING_REPORT”, is the entry point for the Baseline Testing reports. It provides a comprehensive overview of all the SUT/MUT tests for the compute nodes.
Each stage is represented by a separate cell, displaying the results for that specific SUT or MUT test.
To perform a deeper analysis or understand the tests in each stage, click on the relevant report listed under “Linked Published Reports” at the top of the page.
Similarly, all the reports for each stage are available. You can either find the report of interest from Published Reports, or traverse it from the parent report (DGX_SUPERPOD_BASELINE_TESTING_REPORT_<timestamp> )
Understanding the Published Reports#
The reports align up with the SUT and MUT tests. Each cell in “DGX_SUPERPOD_BASELINE_TESTING_REPORT” represents a specific testing stage such as SUT1, SUT2 etc. Within each of these “Linked Reports”, the cells represent individual tests such as Singlenode Healthchecks, HPL, NCCL etc. The layout of the graph for each of the cells is organized as follows:
The X-axis represents all the nodes.
The Y-axis is not defined, which groups all the nodes into a single bar in the bar chart.
For example, in the following visualization, each bar represents the number of nodes within a cluster. In this case, there are 32 nodes per cluster, as indicated by the number displayed on each bar. This provides a clear view of the test progress for each tray across different clusters.
You can click on any bar in the graph to view a detailed list of the resources that passed or failed the tests within that specific bar. This allows you to drill down and see the test results for each tray in a particular rack or test stage.
Alternatively, you can click on the legend to filter and display all the passed or failed resources across the entire cluster, providing a comprehensive view of the overall test status.
Root Cause Analysis#
The report for each stage shows the trays that have passed and failed the test. To understand the actual issue and access the logs, you can follow these steps:
Navigate to the report with PASS/FAIL values that you are interested to conduct an RCA. In this example, lets consider SUT1 report where there are a few failed tests for SINGLENODE_HEALTHCHECK_GPU_CPU.
Navigate to the report corresponding to SINGLENODE_HEALTHCHECK_GPU_CPU and scroll to the tests that are failing.
In this example, GPU Inforom Version has failed on 17 nodes. Click on the bar for one of the nodes to list the resources that the test failed on.
Click on the status (FAIL) which directly links you to the runbook where these tests failed. You can also do the same for tests that passed by clicking on the PASS status.
The errors in the runbook are outlined to the left of the screen. Navigate to the test that we are debugging (Inforom Version). Alternatively, you can also scroll through the run to find the failed tests.
Click on the “Command filter excluded x/y resources” to get detailed output for each resource.
Click on the Output to view the detailed logs
Firmware Reports#
For Firmware Checks, NVIDIA Mission Control autonomous hardware recovery offers a tabular report detailing the status of each node. The report includes:
Pass/Fail Status: Indicates whether the firmware check for each node passed or failed.
Expected Version: Shows the firmware version that was expected for the node.
Current Version: Displays the actual firmware version currently installed on the node.
Navigating to Tabular Report for Firmware Checks#
You can access the SINGLENODE_HEALTHCHECK_FIRMWARE_<timestamp> report either through the Runs (Check Job Status and Result) section or by navigating to the Runs History (see Root Cause Analysis).
Scroll to the last cell of the execution and click on the output of the cell.
You can scroll horizontally and vertically to view the complete output. Additionally, you have the option to download the cell output for further analysis.
You can also navigate to the Reports section and view the tabular output by clicking on the status bar. This includes both the expected firmware version and the current firmware version.
Resource Dashboard#
NVIDIA Mission Control autonomous hardware recovery dashboard provides a comprehensive view of the status of all resources in the cluster, displaying the progress of testing at various stages for each node (control, compute and switch nodes). It shows which tests are completed, which ones have passed, and which have failed. This allows users to easily track the overall health and status of the cluster, identify any issues, and assess the readiness of each resource.
Navigating to the Resource Dashboard#
Visit the NVIDIA Mission Control autonomous hardware recovery homepage, navigate to the ‘Resources’ menu, and click on ‘Dashboards’ to access the dashboard page.
The Landing page contains two tabs: Dashboards and Dashboard Views.
The Dashboards lists all the Dashboards available. All these dashboards reflect the current status of the cluster and the test status.
A Dashboard View is a snapshot of the Dashboard that captures the data at a specific point in time. This snapshot remains static, preserving the exact state and data of the Dashboard as it appeared at that moment, regardless of any future changes or updates to the live data.
DGX_SUPERPOD_BASELINE_TESTING_DASHBOARD#
The DGX_SUPERPOD_BASELINE_TESTING_DASHBOARD provides a detailed view of the cluster’s resources and the status of the baseline tests. Specifically, it tracks the progress of two key testing phases for each resource: SUT and MUT.
Resource Status: The dashboard displays all resources within the cluster, such as compute nodes, control nodes, and switch nodes, along with their associated status.
Hostname: For each resource, you will see the hostname, along with a Tag sequence that indicates the stage of both the SUT and MUT tests.
Test Stage Progress: The rows in the dashboard reflect the current status of each test stage. Each stage (SUT and MUT) has a corresponding tag name that visually represents its test progress, showing whether the stage has been successfully completed, is in progress, or has failed.
Snapshot of Cluster Health: The dashboard offers a comprehensive snapshot of the cluster’s readiness. It allows users to identify potential issues early, track the completion status of tests, and quickly assess which resources are ready and which ones may require attention.
The dashboard allows you to sort the resources by Name, or Progress Bar, making it easier to organize and view the status of your cluster based on your preferred criteria.
Name: Sort resources alphabetically by their hostname for quick access.
Progress Bar: Sort by test progress to focus on resources at different stages of testing or to identify incomplete tasks.
Creating a View / Snapshot#
To create a snapshot of the dashboard, follow these steps.
Click on the “Create View” button located at the top right corner of your screen.
Retain the auto-generated name for the dashboard which includes the timestamp or provide your own name.
Once the Dashboard View is created, a pop-up notification will appear with a hyperlink to access the Dashboard View.
The Dashboard View created can be downloaded as a CSV to further manipulate the data to generate reports.
NVIDIA Mission Control autonomous hardware recovery Active Node Updates#
Applies to all GPU platforms in this guide (GB300, GB200, B200, B300).
Active Node Updates Introduction#
The NVIDIA Mission Control autonomous hardware recovery Active Node Updates workflows provide manual failover procedures for updating the active headnode and Slurm controller node designations when the primary nodes go down. These runbooks must be executed manually by administrators to switch to backup nodes when hardware failures occur, ensuring continued system operations.
Important: These are manual procedures that must be initiated by administrators when primary nodes fail. The system does not automatically failover - users must run these runbooks to designate new active nodes.
Key Features#
Manual Failover: Switch active node designations when primary nodes fail
Resource Tag Management: Automatically manages ACTIVE_HEADNODE and ACTIVE_SLURM_CONTROLLER tags
System Validation: Verifies updated node assignments after changes
Active Headnode Update#
The ACTIVE_HEADNODE_UPDATE runbook allows administrators to change which node is designated as the active headnode in the system. This workflow removes the ACTIVE_HEADNODE tag from the current headnode and assigns it to a new specified node.
Workflow Components#
Untag Current Headnode: Removes the ACTIVE_HEADNODE tag from the currently designated headnode
Tag New Headnode: Assigns the ACTIVE_HEADNODE tag to the specified new headnode
Update Resource Definition: Updates the headnode resource definition to point to the new active node
Validation: Verifies the new headnode assignment is correct
Running the Active Headnode Update#
To execute the Active Headnode Update workflow:
Navigate to the “ACTIVE_HEADNODE_UPDATE” runbook in the Runbooks section
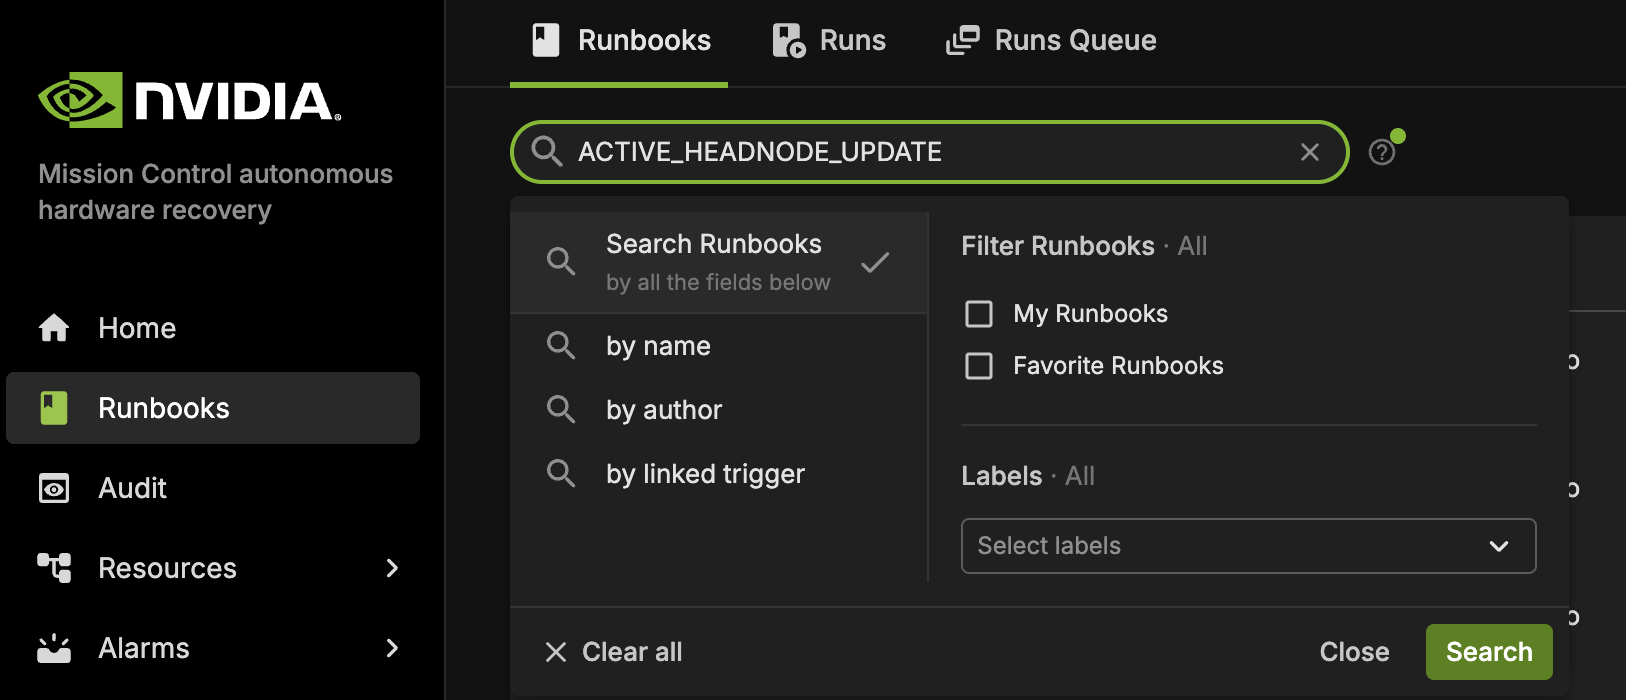
Configure the required parameter:
ACTIVE_HEADNODE: Input the hostname of the new active headnode
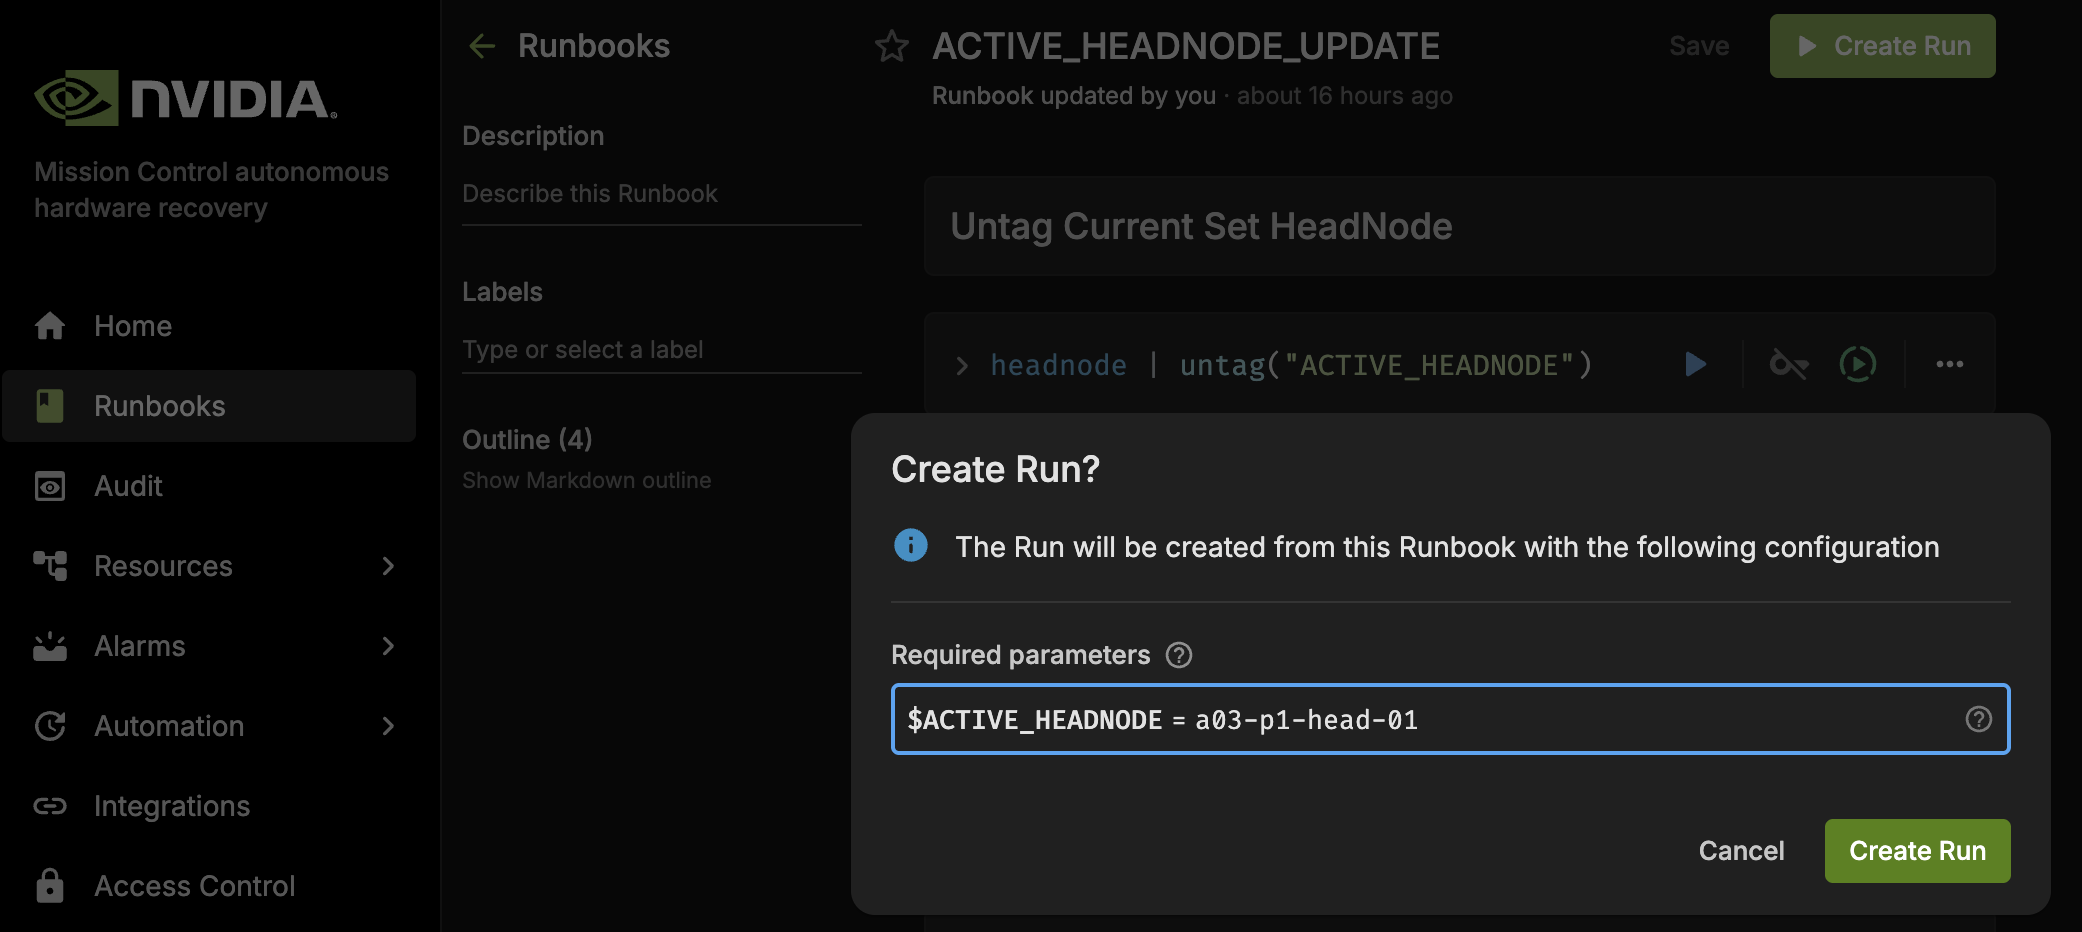
Select “Create Run” to initiate the workflow
Monitor the execution progress and results
The runbook will:
Remove the ACTIVE_HEADNODE tag from any currently tagged nodes
Apply the ACTIVE_HEADNODE tag with value “True” to the specified node
Update the headnode resource definition to reference the new active node
Display the updated headnode configuration for validation
Active Slurm Controller Update#
The ACTIVE_SLURM_CONTROLLER_UPDATE runbook allows administrators to change which node is designated as the active Slurm controller in the system. This workflow removes the ACTIVE_SLURM_CONTROLLER tag from the current controller and assigns it to a new specified node.
Workflow Components#
Untag Current Controller: Removes the ACTIVE_SLURM_CONTROLLER tag from the currently designated Slurm controller
Tag New Controller: Assigns the ACTIVE_SLURM_CONTROLLER tag to the specified new controller node
Update Resource Definition: Updates the slurm_controller resource definition to point to the new active node
Validation: Verifies the new Slurm controller assignment is correct
Running the Active Slurm Controller Update#
To execute the Active Slurm Controller Update workflow:
Navigate to the “ACTIVE_SLURM_CONTROLLER_UPDATE” runbook in the Runbooks section
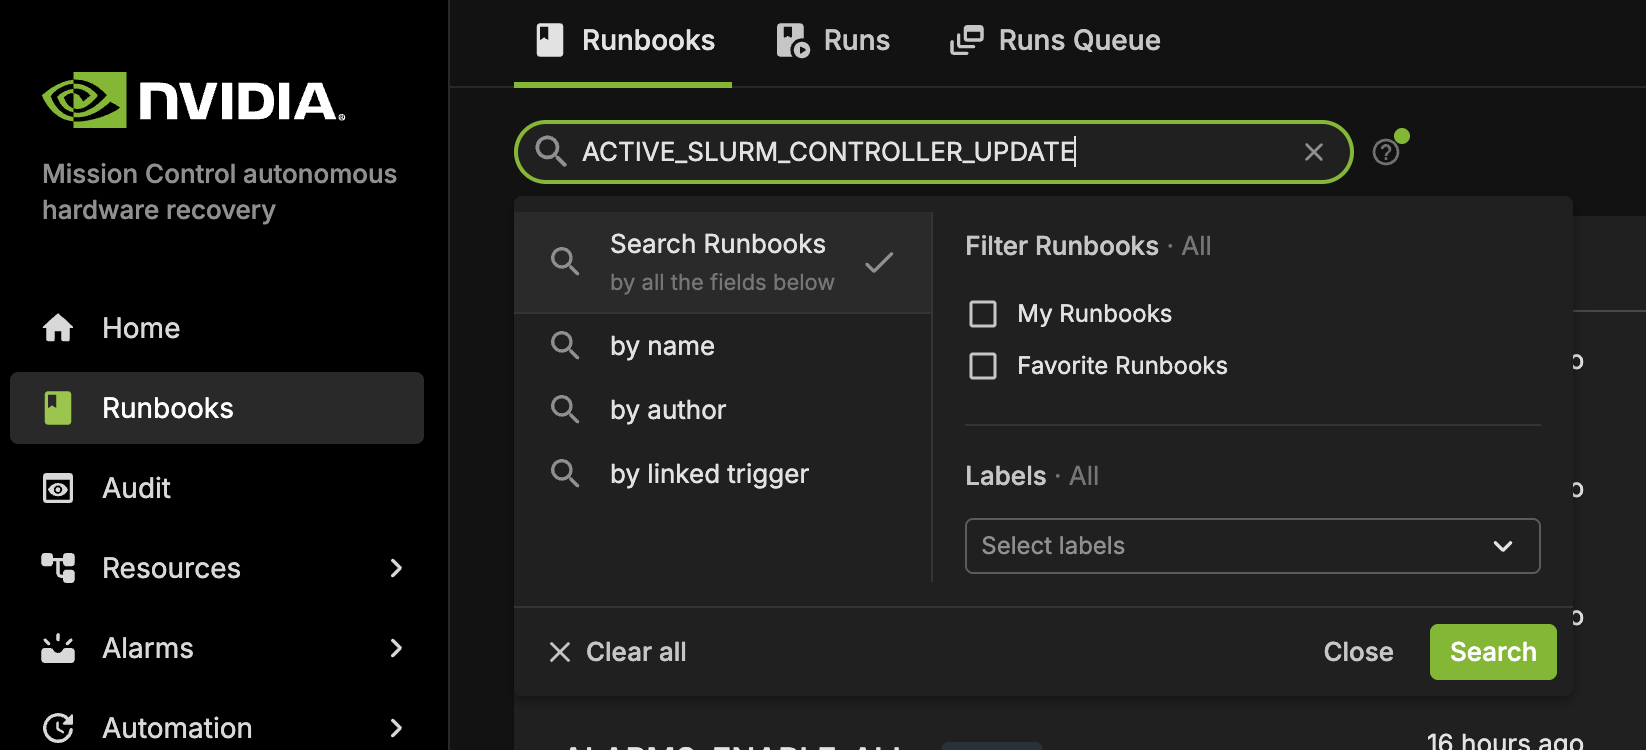
Configure the required parameter:
ACTIVE_SLURM_CONTROLLER: Input the hostname of the new active Slurm controller
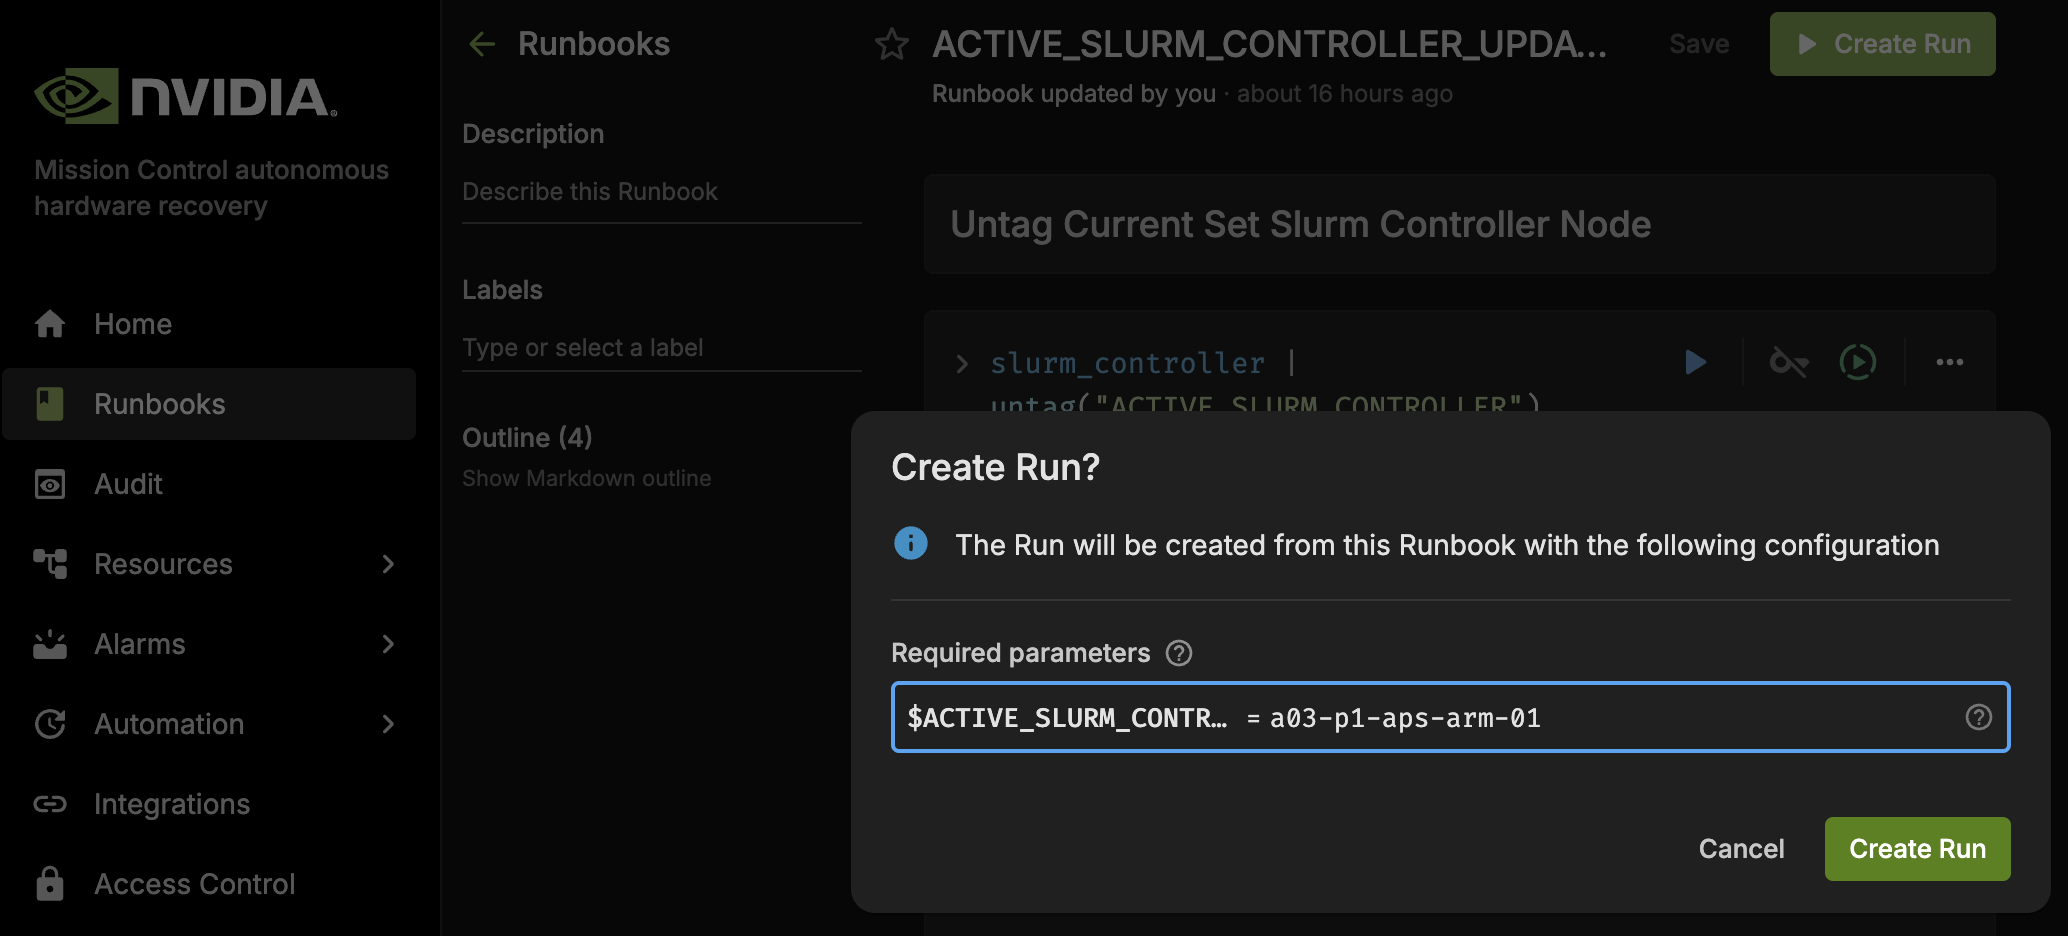
Select “Create Run” to initiate the workflow
Monitor the execution progress and results
The runbook will:
Remove the ACTIVE_SLURM_CONTROLLER tag from any currently tagged nodes
Apply the ACTIVE_SLURM_CONTROLLER tag with value “True” to the specified node
Update the slurm_controller resource definition to reference the new active node
Display the updated Slurm controller configuration for validation
Important Notes#
Manual Execution Required: These runbooks must be run manually when primary nodes fail - there is no automatic failover
Failover Scenario: Use these runbooks when the primary headnode or Slurm controller becomes unavailable
AHR Tag Management Only: These runbooks only update AHR’s understanding of active nodes - they do not perform actual service migration
Prerequisites: Ensure backup nodes are properly configured and accessible before running these workflows
Post-Execution: Verify that dependent systems recognize the new active node assignments
NVIDIA Mission Control autonomous hardware recovery UI Tips and Troubleshooting#
Selecting Attributes to Display#
You can customize parts of the UI, like Runbooks, to show only the attributes you’re interested in by using the column selector or attribute settings. This helps declutter the interface and focus on the most relevant data.
After executing a command (for example:
INPUT union headnode | export("INPUT_HEADNODE")
), you will see an output block like the one shown below.
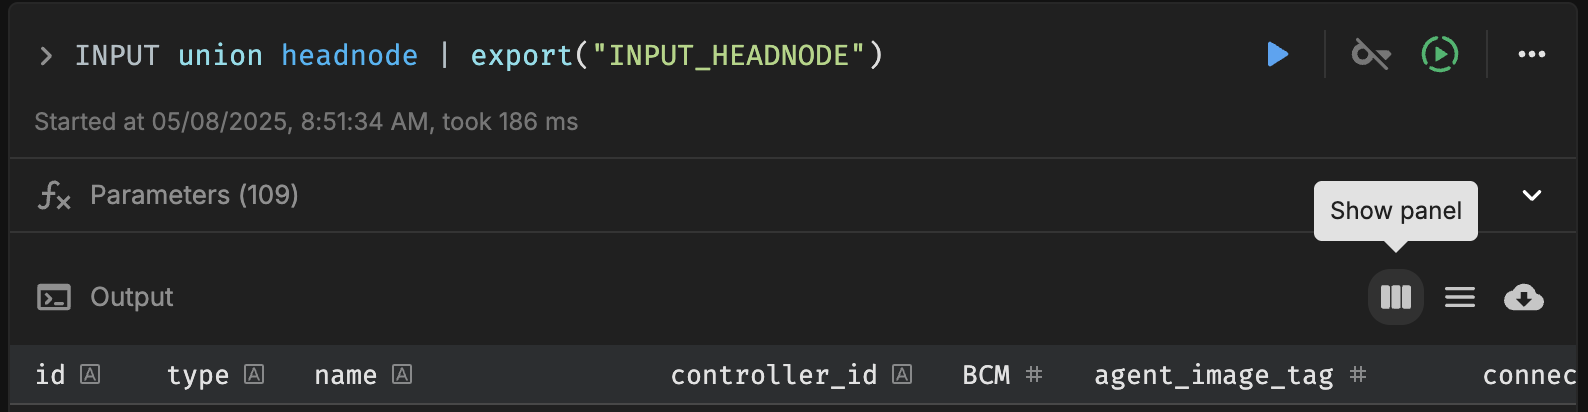
Click on the “Show panel” button in the Output section. This opens an interactive interface that allows you to select the attributes you’d like to view in the UI.
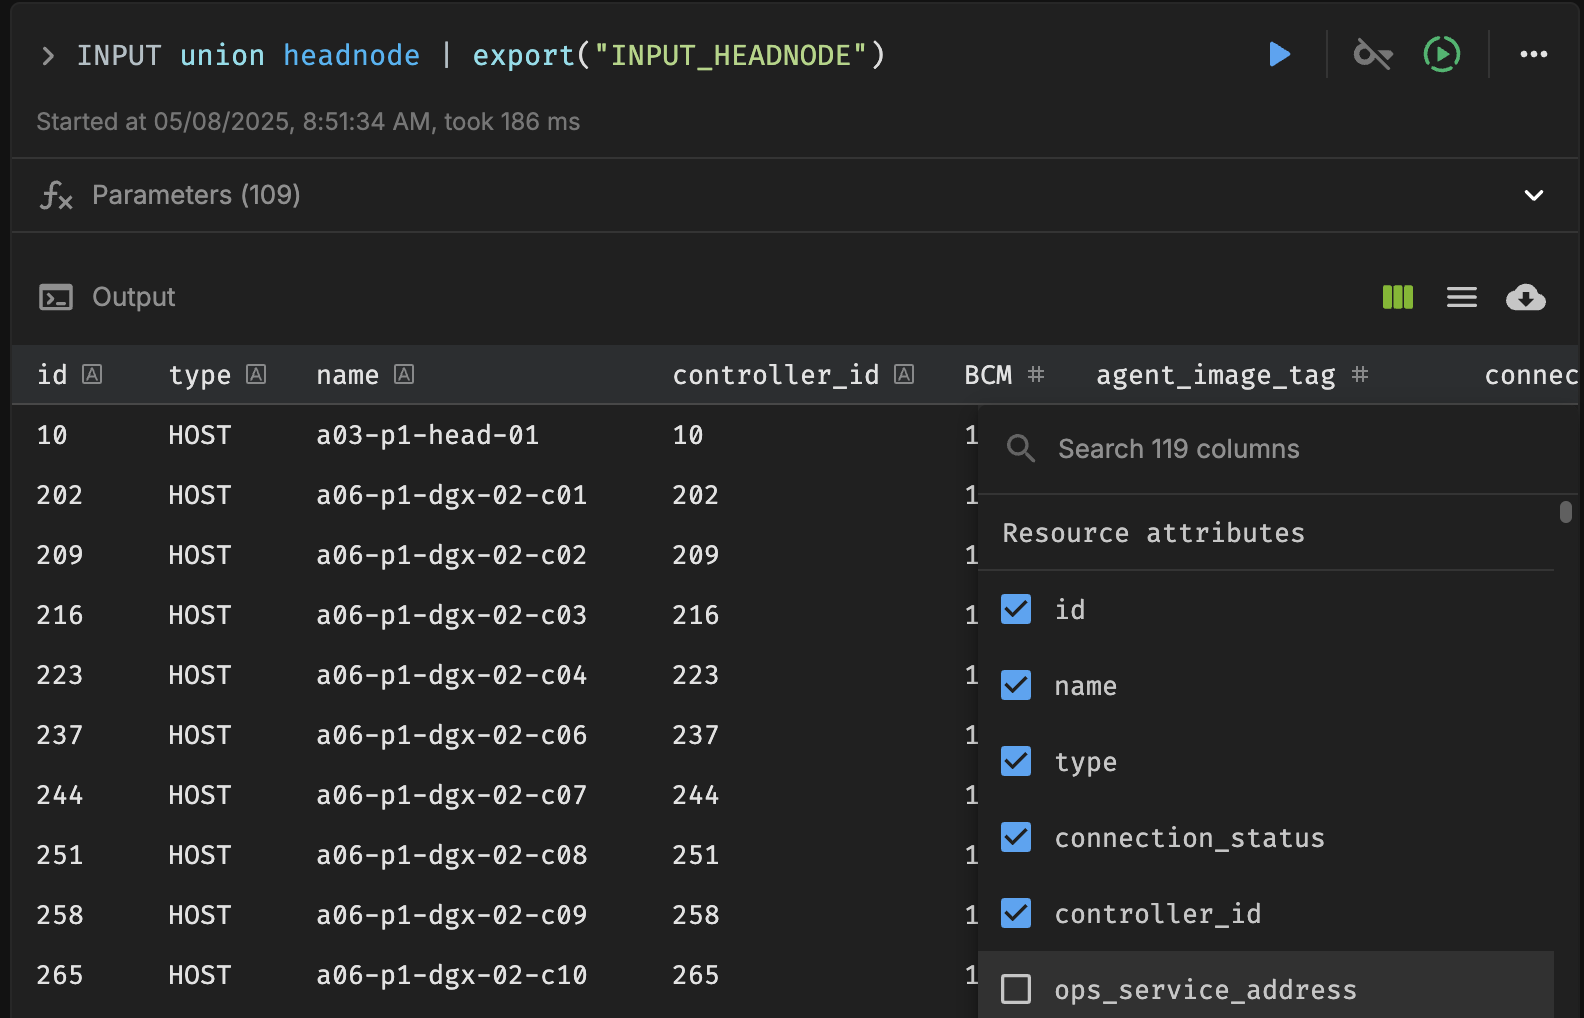
Viewing Logs for Excluded Resources#
To investigate why certain resources were excluded, open the Run associated with the Runbook, and click on the “Action filter excluded resources” section within the corresponding Cell. This will open a detailed log view explaining the reasons behind each exclusion.
For example, in the below screenshot, you can see that the action filter excluded 1 out of 16 resources:
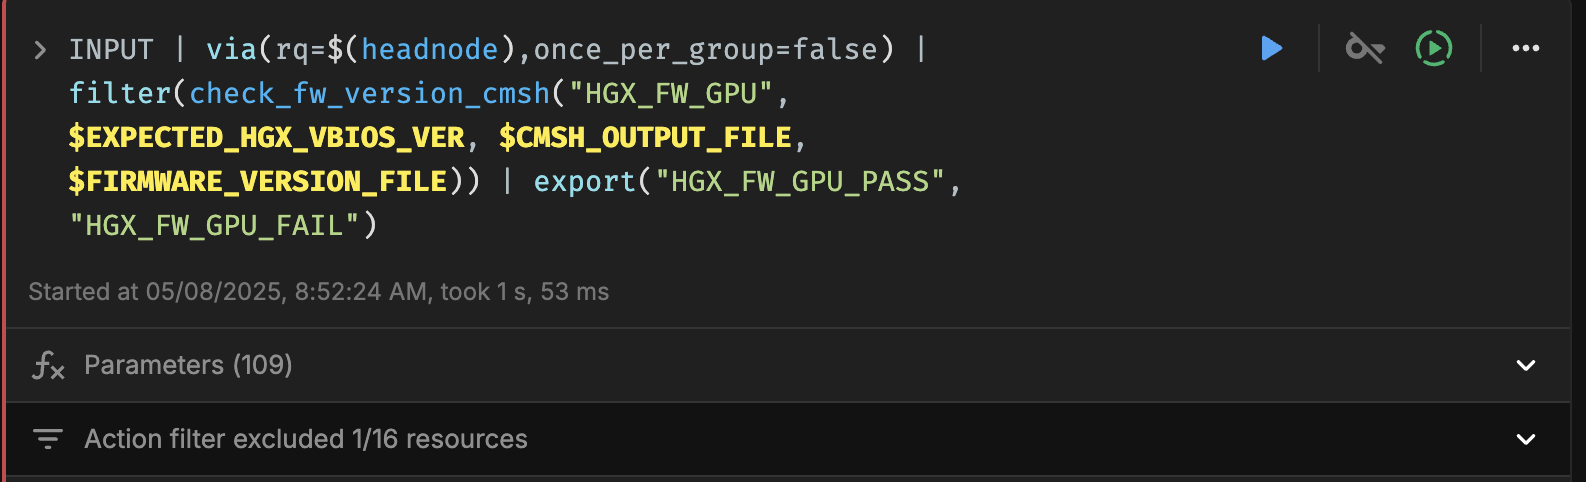
Once expanded, detailed logs will be visible, showing which resource was excluded and why, such as a version mismatch:
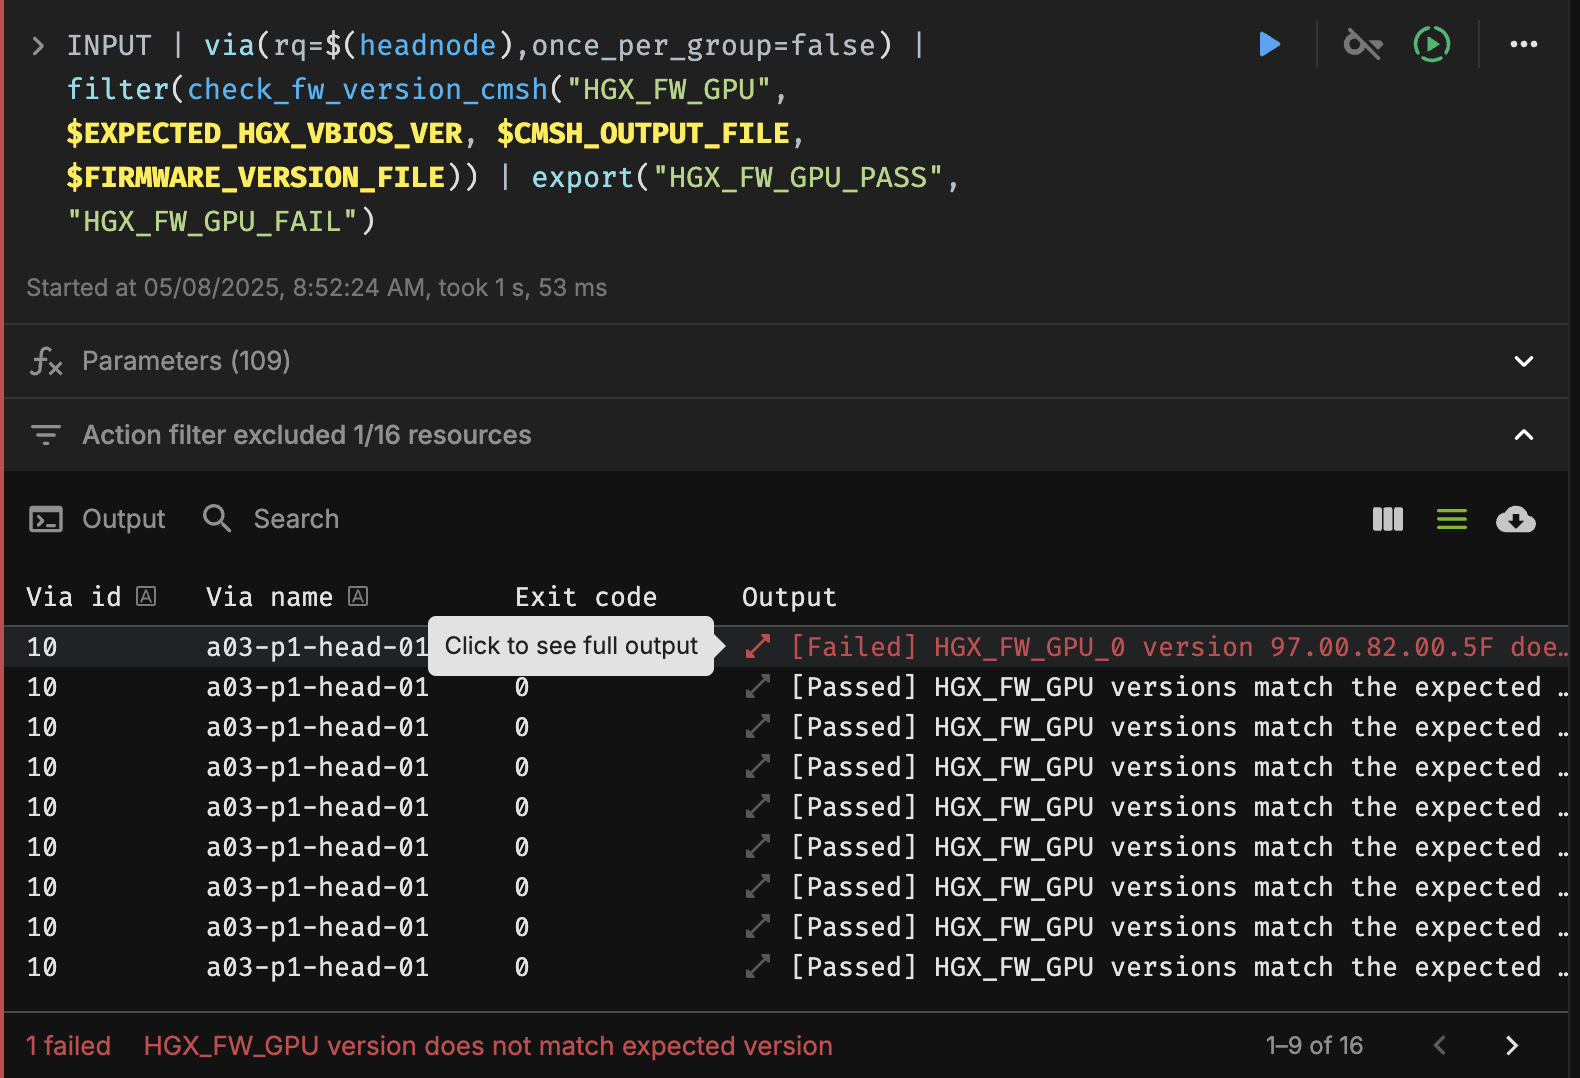
This log output helps in identifying failed checks, allowing targeted debugging.