ASIC Monitoring
Cumulus Linux provides an ASIC monitoring tool that collects and distributes data about the state of the ASIC. The monitoring tool polls for data at specific intervals and takes certain actions so that you can quickly identify and respond to problems, such as:
- Microbursts that result in longer packet latency
- Packet buffer congestion that might lead to packet drops
- Network problems with a particular switch, port, or traffic class
ASIC monitoring is currently supported on switches with Spectrum ASICs only.
What Type of Statistics Can You Collect?
You can collect the following type of statistics with the ASIC monitoring tool:
- A fine-grained history of queue lengths using histograms maintained by the ASIC
- Packet counts per port, priority and size
- Dropped packet, pause frame, and ECN-marked packet counts
- Buffer congestion occupancy per port, priority and buffer pool, and at input and output ports
Collecting Queue Lengths in Histograms
The Spectrum ASIC provides a mechanism to measure and report egress queue lengths in histograms (a graphical representation of data, which is divided into intervals or bins). You can configure the ASIC to measure up to 64 egress queues. Each queue is reported through a histogram with 10 bins, where each bin represents a range of queue lengths.
You configure the histogram with a minimum size boundary (Min) and a histogram size. You then derive the maximum size boundary (Max) by adding the minimum size boundary and the histogram size.
The 10 bins are numbered 0 through 9. Bin 0 represents queue lengths up to the Min specified, including queue length 0. Bin 9 represents queue lengths of Max and above. Bins 1 through 8 represent equal-sized ranges between the Min and Max, which is determined by dividing the histogram size by 8.
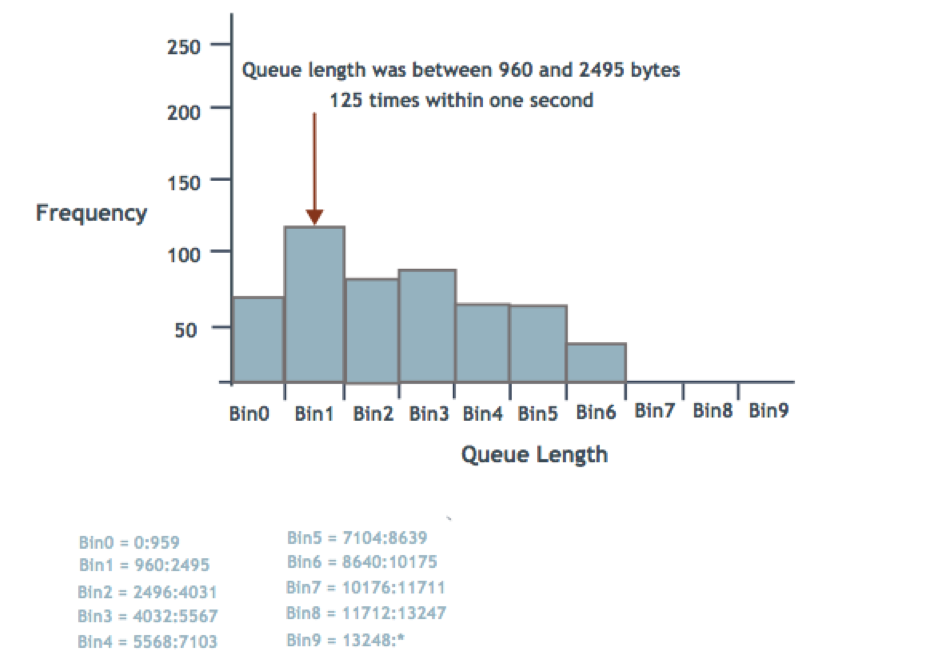
For example, consider the following histogram queue length ranges, in bytes:
- Min = 960
- Histogram size = 12288
- Max = 13248
- Range size = 1536
- Bin 0: 0:959
- Bin 1: 960:2495
- Bin 2: 2496:4031
- Bin 3: 4032:5567
- Bin 4: 5568:7103
- Bin 5: 7104:8639
- Bin 6: 8640:10175
- Bin 7: 10176:11711
- Bin 8: 11712:13247
- Bin 9: 13248:*
The following illustration demonstrates a histogram showing how many times the queue length for a port was in the ranges specified by each bin. The example shows that the queue length was between 960 and 2495 bytes 125 times within one second.
Configure ASIC Monitoring
The ASIC monitoring tool is managed by the asic-monitor service,
(which is managed by systemd). The asic-monitor service reads the
/etc/cumulus/datapath/monitor.conf configuration file to determine
what statistics to collect and when to trigger. The service always
starts; however, if the configuration file is empty, the service exits.
The monitor.conf configuration file provides information about the
type of data to collect, the switch ports to monitor, how and when to
start reading the ASIC (such as when a specific queue length or number
of packets dropped is reached), and what actions to take (create a
snapshot file, send a message to the /var/log/syslog file, or collect
more data).
To configure ASIC monitoring, edit the
/etc/cumulus/datapath/monitor.conf file and restart the asic-monitor
service. The asic-monitor service reads the new configuration file and
then runs until it is stopped.
The following procedure describes how to monitor queue lengths using a
histogram. The settings are configured to collect data every second and
write the results to a snapshot file. When the size of the queue reaches
500 bytes, the system sends a message to the /var/log/syslog file.
To monitor queue lengths using a histogram:
Open the
/etc/cumulus/datapath/monitor.conffile in a text editor.cumulus@switch:~$ sudo nano /etc/cumulus/datapath/monitor.confAt the end of the file, add the following line to specify the name of the histogram monitor (port group). The example uses
histogram_pg; however, you can use any name you choose. You must use the same name with all histogram settings.monitor.port_group_list = [histogram_pg]Add the following line to specify the ports you want to monitor. The following example sets swp1 through swp50.
monitor.histogram_pg.port_set = swp1-swp50Add the following line to set the data type to
histogram. This is the data type for histogram monitoring.monitor.histogram_pg.stat_type = histogramAdd the following line to set the trigger type to
timer. Currently, the only trigger type available is timer.monitor.histogram_pg.trigger_type = timerAdd the following line to set the frequency at which data collection starts. In the following example, the frequency is set to one second.
monitor.histogram_pg.timer = 1sAdd the following line to set the actions you want to take when data is collected. In the following example, the system writes the results of data collection to a snapshot file and sends a message to the
/var/log/syslogfile .monitor.histogram_pg.action_list = [snapshot,log]Add the following line to specify a name and location for the snapshot file. In the following example, the system writes the snapshot to a file called
histogram_statsin the/var/lib/cumulusdirectory and adds a suffix to the file name with the snapshot file count (see the following step).monitor.histogram_pg.snapshot.file = /var/lib/cumulus/histogram_statsAdd the following line to set the number of snapshots that are taken before the system starts overwriting the earliest snapshot files.
In the following example, because the snapshot file count is set to 64, the first snapshot file is namedhistogram_stats_0and the 64th snapshot is namedhistogram_stats_63. When the 65th snapshot is taken, the original snapshot file (histogram_stats_0) is overwritten and the sequence continues untilhistogram_stats_63is written. Then, the sequence restarts.monitor.histogram_pg.snapshot.file_count = 64Add the following line to include a threshold, which determines how to collect data. Setting a threshold is optional. In the following example, when the size of the queue reaches 500 bytes, the system sends a message to the
/var/log/syslogfile .monitor.histogram_pg.log.queue_bytes = 500Add the following lines to set the size, minimum boundary, and sampling time of the histogram. Adding the histogram size and the minimum boundary size together produces the maximum boundary size. These settings are used to represent the range of queue lengths per bin.
monitor.histogram_pg.histogram.minimum_bytes_boundary = 960
monitor.histogram_pg.histogram.histogram_size_bytes   = 12288
monitor.histogram_pg.histogram.sample_time_ns         = 1024
Save the file, then restart the
asic-monitorservice with the following command.cumulus@switch:~$ systemctl restart asic-monitor.serviceRestarting the
asic-monitorservice does not disrupt traffic or require you to restartswitchd. The service is enabled by default when you boot the switch and restarts when you restartswitchd.Important
Overhead is involved in collecting the data, which uses both the CPU and SDK process and can affect execution of
switchd. Snapshots and logs can occupy a lot of disk space if you do not limit their number.
To collect other data, such as all packets per port, buffer congestion, or packet drops due to error, follow the procedure above but change the port group list setting to include the port group name you want to use. For example, to monitor packet drops due to buffer congestion:
monitor.port_group_list = [buffers_pg]
monitor.buffers_pg.port_set  = swp1-swp50
monitor.buffers_pg.stat_type = buffer
...
Certain settings in the procedure above (such as the histogram size, boundary size, and sampling time) only apply to the histogram monitor. All ASIC monitor settings are described in ASIC Monitoring Settings.
Configuration Examples
Several configuration examples are provided below.
Queue Length Histograms
In the following example:
Queue length histograms are collected every second for swp1 through swp50.
The results are written to the
/var/lib/cumulus/histogram_statssnapshot file.The size of the histogram is set to 12288 bytes, the minimum boundary to 960 bytes, and the sampling time to 1024 nanoseconds.
A threshold is set so that when the size of the queue reaches 500 bytes, the system sends a message to the
/var/log/syslogfile.monitor.port_group_list = [histogram_pg] monitor.histogram_pg.port_set = swp1-swp50 monitor.histogram_pg.stat_type = histogram monitor.histogram_pg.cos_list = [0] monitor.histogram_pg.trigger_type = timer monitor.histogram_pg.timer = 1s monitor.histogram_pg.action_list = [snapshot,log] monitor.histogram_pg.snapshot.file = /var/lib/cumulus/histogram_stats monitor.histogram_pg.snapshot.file_count = 64 monitor.histogram_pg.log.queue_bytes = 500 monitor.histogram_pg.histogram.minimum_bytes_boundary = 960 monitor.histogram_pg.histogram.histogram_size_bytes = 12288 monitor.histogram_pg.histogram.sample_time_ns = 1024
Packet Drops Due to Errors
In the following example:
Packet drops on swp1 through swp50 are collected every two seconds.
If the number of packet drops is greater than 100, the results are written to the
/var/lib/cumulus/discard_stats snapshotfile and the system sends a message to the/var/log/syslogfile.monitor.port_group_list = [discards_pg] monitor.discards_pg.port_set = swp1-swp50 monitor.discards_pg.stat_type = packet monitor.discards_pg.action_list = [snapshot,log] monitor.discards_pg.trigger_type = timer monitor.discards_pg.timer = 2s monitor.discards_pg.log.packet_error_drops = 100 monitor.discards_pg.snapshot.packet_error_drops = 100 monitor.discards_pg.snapshot.file = /var/lib/cumulus/discard_stats monitor.discards_pg.snapshot.file_count = 16
Queue Length (Histogram) with Collect Actions
A collect action triggers the collection of additional information. You can daisy chain multiple monitors (port groups) into a single collect action.
In the following example:
Queue length histograms are collected for swp1 through swp50 every second.
The results are written to the
/var/lib/cumulus/histogram_statssnapshot file.When the queue length reaches 500 bytes, the system sends a message to the
/var/log/syslogfile and collects additional data; buffer occupancy and all packets per port.Buffer occupancy data is written to the
/var/lib/cumulus/buffer_statssnapshot file and all packets per port data is written to the/var/lib/cumulus/all_packet_statssnapshot file.In addition, packet drops on swp1 through swp50 are collected every two seconds. If the number of packet drops is greater than 100, the results are written to the
/var/lib/cumulus/discard_statssnapshot file and a message is sent to the/var/log/syslogfile.monitor.port_group_list = [histogram_pg,discards_pg] monitor.histogram_pg.port_set = swp1-swp50 monitor.histogram_pg.stat_type = buffer monitor.histogram_pg.cos_list = [0] monitor.histogram_pg.trigger_type = timer monitor.histogram_pg.timer = 1s monitor.histogram_pg.action_list = [snapshot,collect,log] monitor.histogram_pg.snapshot.file = /var/lib/cumulus/histogram_stats monitor.histogram_pg.snapshot.file_count = 64 monitor.histogram_pg.histogram.minimum_bytes_boundary = 960 monitor.histogram_pg.histogram.histogram_size_bytes = 12288 monitor.histogram_pg.histogram.sample_time_ns = 1024 monitor.histogram_pg.log.queue_bytes = 500 monitor.histogram_pg.collect.queue_bytes = 500 monitor.histogram_pg.collect.port_group_list = [buffers_pg,all_packet_pg] monitor.buffers_pg.port_set = swp1-swp50 monitor.buffers_pg.stat_type = buffer monitor.buffers_pg.action_list = [snapshot] monitor.buffers_pg.snapshot.file = /var/lib/cumulus/buffer_stats monitor.buffers_pg.snapshot.file_count = 8 monitor.all_packet_pg.port_set = swp1-swp50 monitor.all_packet_pg.stat_type = packet_all monitor.all_packet_pg.action_list = [snapshot] monitor.all_packet_pg.snapshot.file = /var/lib/cumulus/all_packet_stats monitor.all_packet_pg.snapshot.file_count = 8 monitor.discards_pg.port_set = swp1-swp50 monitor.discards_pg.stat_type = packet monitor.discards_pg.action_list = [snapshot,log] monitor.discards_pg.trigger_type = timer monitor.discards_pg.timer = 2s monitor.discards_pg.log.packet_error_drops = 100 monitor.discards_pg.snapshot.packet_error_drops = 100 monitor.discards_pg.snapshot.file = /var/lib/cumulus/discard_stats monitor.discards_pg.snapshot.file_count = 16
Certain actions require additional settings. For example, if the snapshot action
is specified, a snapshot file is also required. If the log action is specified,
a log threshold is also required. See action_list
for additional settings required for each action.
Example Snapshot File
A snapshot action writes a snapshot of the current state of the ASIC to a file. Because parsing the file and finding the information can be tedious, you can use a third-party analysis tool to analyze the data in the file. The following example shows a snapshot of queue lengths.
{"timestamp_info": {"start_datetime": "2017-03-16 21:36:40.775026", "end_datetime": "2017-03-16 21:36:40.775848"}, "buffer_info": null, "packet_info": null, "histogram_info": {"swp2": {"0": 55531}, "swp32": {"0": 48668}, "swp1": {"0": 64578}}}
Example Log Message
A log action writes out the ASIC state to the /var/log/syslog file. In
the following example, when the size of the queue reaches 500 bytes, the
system sends this message to the /var/log/syslog file:
2018-02-26T20:14:41.560840+00:00 cumulus asic-monitor-module INFO: 2018-02-26 20:14:41.559967: Egress queue(s) greater than 500 bytes in monitor port group histogram_pg.
ASIC Monitoring Settings
The following table provides descriptions of the ASIC monitor settings.
Setting | Description |
|---|---|
| Specifies the names of the monitors (port groups) you want to use to collect data, such as Example:
You must specify at least one port group. If the port group list is empty, systemd shuts down the asic-monitor service. |
| Specifies the range of ports monitored. You can specify GLOBs and comma-separated lists; for example, swp1-swp4,swp8,swp10-swp50. Example:
|
| Specifies the type of data that the port group collects.
|
| For histogram monitoring, each CoS (Class of Service) value in the list has its own histogram on each port.The global limit on the number of histograms is an average of one histogram per port. Example:
|
| Specifies the type of trigger that initiates data collection. Currently, the only option is Example:
|
| Specifies the frequency at which data is collected; for example, a setting of
Example:
|
| Specifies one or more actions that occur when data is collected:
You can use all three of these actions in one monitoring step. For example: Note: If an action appears in the action list but does not have the required settings (such as a threshold for the log action), the ASIC monitor stops and reports an error. |
| Specifies the name for the snapshot file. All snapshots use this name, with a sequential number appended to it. See the Example:
|
| Specifies the number of snapshots that can be created before the first snapshot file is overwritten. Example:
While more snapshots provide you with more data, they can occupy a lot of disk space on the switch. |
| For histogram monitoring Specifies a threshold for the histogram monitor. This is the length of the queue in bytes that initiates a specified action (snapshot, log, collect). Examples:
|
| For monitoring packet drops due to error Specifies a threshold for the packet drops due to error monitor. This is the number of packet drops due to error that initiates a specified action (snapshot, log, collect). Examples:
|
| For monitoring packet drops due to buffer congestion Specifies a threshold for the packet drops due to buffer congestion monitor. This is the number of packet drops due to buffer congestion that initiates a specified action (log or collect). Examples:
|
| For histogram monitoring The minimum boundary size for the histogram in bytes. On a Spectrum switch, this number must be a multiple of 96. Adding this number to the size of the histogram produces the maximum boundary size. These values are used to represent the range of queue lengths per bin. Example:
|
| For histogram monitoring The size of the histogram in bytes. Adding this number and the minimum_bytes_boundary value together produces the maximum boundary size. These values are used to represent the range of queue lengths per bin. Example:
|
| For histogram monitoring The sampling time of the histogram in nanoseconds. Example:
|