ASIC Monitoring
Cumulus Linux provides two ASIC monitoring tools that collect and distribute data about the state of the ASIC.
Enable ASIC Monitoring
To enable ASIC monitoring for histogram collection and high frequency telemetry, run the following commands.
cumulus@switch:~$ nv set system telemetry enable on
cumulus@switch:~$ nv config apply
The asic-monitor service manages both histogram collection and high frequency telemetry. systemd manages the asic-monitor service.
The asic-monitor service reads:
- The
/etc/cumulus/datapath/monitor.confconfiguration file to determine what statistics to collect and when to trigger. The service always starts; however, if the configuration file is empty, the service exits. - The
/etc/cumulus/telemetry/hft/hft_job.confand/etc/cumulus/telemetry/hft/hft.conffiles for high frequency telemetry.
Restarting the asic-monitor service does not disrupt traffic or require you to restart switchd.
Histogram Collection
The histogram collection monitoring tool polls for data at specific intervals and takes certain actions so that you can identify and respond to problems, such as:
- Microbursts that result in longer packet latency.
- Packet buffer congestion that might lead to packet drops.
- Network problems with a particular switch, port, or traffic class.
Cumulus Linux provides several histograms:
- Egress queue length shows information about egress buffer utilization over time.
- Ingress queue length shows information about ingress buffer utilization over time.
- Counter shows information about bandwidth utilization for a port over time.
- Latency shows information about packet latency over time.
- Packet drops due to errors (Linux only).
Cumulus Linux supports:
- The egress queue length histogram on Spectrum 1 and later.
- The ingress queue length histogram and the latency histogram on Spectrum-2 and later.
- The counter histogram (transmitted packet, transmitted byte, received packet, received byte, and CRC counters) on Spectrum-2 and later.
- The counter histogram (layer 1 received byte counters and layer 1 transmitted byte counters) on Spectrum-4 only.
Histogram Collection Example
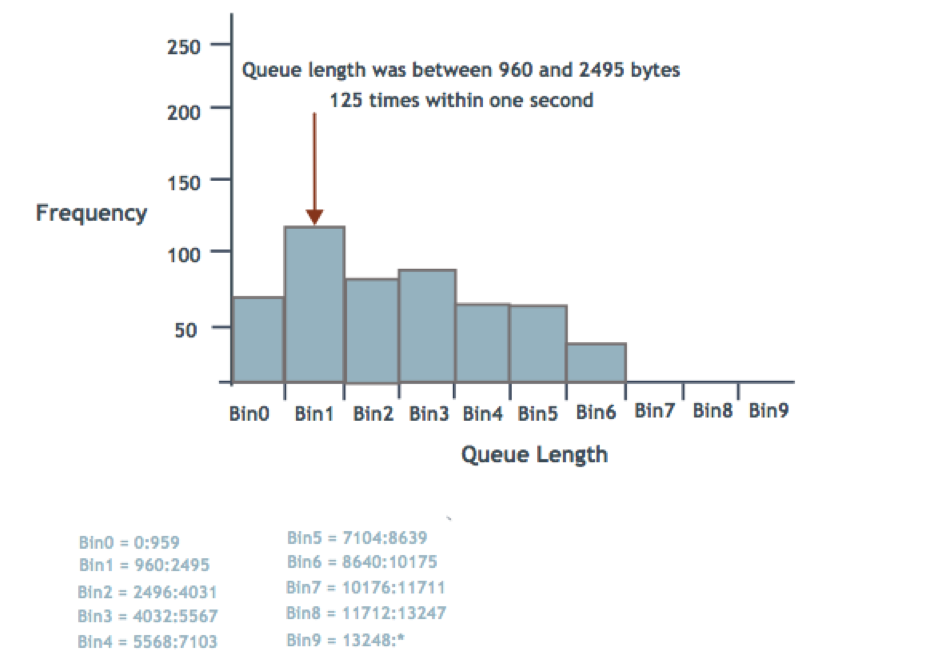
The NVIDIA Spectrum ASIC provides a mechanism to measure and report ingress and egress queue lengths, counters and latency in histograms (a graphical representation of data, which it divides into intervals or bins). Each queue reports through a histogram with 10 bins, where each bin represents a range of queue lengths.
You configure the histogram with a minimum size boundary (Min) and a histogram size. You then derive the maximum size boundary (Max) by adding the minimum size boundary and the histogram size.
The 10 bins have numbers 0 through 9. Bin 0 represents queue lengths up to the Min specified, including queue length 0. Bin 9 represents queue lengths of Max and above. Bins 1 through 8 represent equal-sized ranges between the Min and Max (by dividing the histogram size by 8).
For example, consider the following histogram queue length ranges, in bytes:
- Min = 960
- Histogram size = 12288
- Max = 13248
- Range size = 1536
- Bin 0: 0:959
- Bin 1: 960:2495
- Bin 2: 2496:4031
- Bin 3: 4032:5567
- Bin 4: 5568:7103
- Bin 5: 7104:8639
- Bin 6: 8640:10175
- Bin 7: 10176:11711
- Bin 8: 11712:13247
- Bin 9: 13248:*
The following illustration demonstrates a histogram showing how many times the queue length for a port was in the ranges specified by each bin. The example shows that the queue length was between 960 and 2495 bytes 125 times within one second.
Configure Histogram Collection
To configure Histogram Collection, you specify:
- The type of data to collect.
- The switch ports to monitor.
- For the egress queue length and latency histograms, you can specify the traffic class you want to monitor for a port or range of ports.
- For the ingress queue length histogram, you can specify the priority group you want to monitor for a port or range of ports.
- How and when to start reading the ASIC: at a specific queue length, number of packets or bytes received or transmitted, or number of nanoseconds latency.
- What actions to take: create a snapshot file, send a message to the
/var/log/syslogfile, or both.
Histogram Settings
Histogram settings include the type of data you want to collect, the ports you want the histogram to monitor, the sampling time of the histogram, the histogram size, and the minimum boundary size for the histogram.
- The ingress queue length histogram can monitor a specific priority group for a port or range of ports.
- The egress queue length histogram and the latency histogram can monitor a specific traffic class for a port or range of ports. Traffic class 0 through 7 is for unicast traffic and traffic class 8 through 15 is for multicast traffic.
- The counter histogram can monitor the following counter types:
- Received packet counters (
rx-packet) - Transmitted packet counters (
tx-packet) - Received byte counters (
rx-byte) - Transmitted byte counters (
tx-byte) - CRC counters (
crc) - Layer 1 received byte counters (
l1-rx-byte). The byte count includes layer 1IPG bytes. - Layer 1 transmitted byte counters (
l1-tx-byte). The byte count includes layer 1IPG bytes.
- Received packet counters (
- You can enable up to two counter histogram counter types for each physical interface. The counter histogram does not support bonds or virtual interfaces.
- The default minimum boundary size is 960 bytes. Adding this number to the size of the histogram produces the maximum boundary size. These values represent the range of queue lengths for each bin.
- The default value for the sampling time is 1024 nanoseconds.
When you configure minimum boundary and histogram sizes, Cumulus Linux rounds down the configured byte value to the nearest multiple of the switch ASIC cell size before programming it into hardware. The cell size is a fixed number of bytes on each switching ASIC:
- Spectrum-1: 96 bytes
- Spectrum-2 and Spectrum-3: 144 bytes
- Spectrum-4: 192 bytes
The histogram type can be egress-buffer, ingress-buffer, counter, or latency.
- To change global histogram settings, run the
nv set system telemetry histogram <type>command. - To enable histograms on interfaces or to change interface level settings, run the
nv set interface <interface> telemetry histogram <type>command.
The following example configures the egress queue length histogram and sets the minimum boundary size to 960, the histogram size to 12288, and the sampling interval to 1024. These settings apply to interfaces that have the egress-buffer histogram enabled and do not have different values configured for these settings at the interface level:
cumulus@switch:~$ nv set system telemetry histogram egress-buffer bin-min-boundary 960
cumulus@switch:~$ nv set system telemetry histogram egress-buffer histogram-size 12288
cumulus@switch:~$ nv set system telemetry histogram egress-buffer sample-interval 1024
cumulus@switch:~$ nv config apply
The following example enables the egress queue length histogram for traffic class 0 on swp1 through swp8 with the globally applied minimum boundary, histogram size, and sample interval. The example also enables the egress queue length histogram for traffic class 1 on swp9 through swp16 and sets the minimum boundary to 768 bytes, the histogram size to 9600 bytes, and the sampling interval to 2048 nanoseconds.
cumulus@switch:~$ nv set system telemetry enable on
cumulus@switch:~$ nv set interface swp1-8 telemetry histogram egress-buffer traffic-class 0
cumulus@switch:~$ nv set interface swp9-16 telemetry histogram egress-buffer traffic-class 1 bin-min-boundary 768
cumulus@switch:~$ nv set interface swp9-16 telemetry histogram egress-buffer traffic-class 1 histogram-size 9600
cumulus@switch:~$ nv set interface swp9-16 telemetry histogram egress-buffer traffic-class 1 sample-interval 2048
cumulus@switch:~$ nv config apply
The following example configures the ingress queue length histogram and sets the minimum boundary size to 960 bytes, the histogram size to 12288 bytes, and the sampling interval to 1024 nanoseconds. These settings apply to interfaces that have the ingress-buffer histogram enabled and do not have different values configured for these settings at the interface level:
cumulus@switch:~$ nv set system telemetry enable on
cumulus@switch:~$ nv set system telemetry histogram ingress-buffer bin-min-boundary 960
cumulus@switch:~$ nv set system telemetry histogram ingress-buffer histogram-size 12288
cumulus@switch:~$ nv set system telemetry histogram ingress-buffer sample-interval 1024
cumulus@switch:~$ nv config apply
The following example enables the ingress queue length histogram for priority group 0 on swp1 through swp8 with the globally applied minimum boundary, histogram size, and sample interval. The example also enables the ingress queue length histogram for priority group 1 on swp9 through swp16 and sets the minimum boundary to 768 bytes, the histogram size to 9600 bytes, and the sampling interval to 2048 nanoseconds.
cumulus@switch:~$ nv set interface swp1-8 telemetry histogram ingress-buffer priority-group 0
cumulus@switch:~$ nv set interface swp9-16 telemetry histogram ingress-buffer priority-group 1 bin-min-boundary 768
cumulus@switch:~$ nv set interface swp9-16 telemetry histogram ingress-buffer priority-group 1 histogram-size 9600
cumulus@switch:~$ nv set interface swp9-16 telemetry histogram ingress-buffer priority-group 1 sample-interval 2048
cumulus@switch:~$ nv config apply
The following example configures the counter histogram and sets the minimum boundary size to 960, the histogram size to 12288, and the sampling interval to 1024. The histogram monitors all counter types. These settings apply to interfaces that have the counter histogram enabled and do not have different values configured for these settings at the interface level:
cumulus@switch:~$ nv set system telemetry histogram counter bin-min-boundary 960
cumulus@switch:~$ nv set system telemetry histogram counter histogram-size 12288
cumulus@switch:~$ nv set system telemetry histogram counter sample-interval 1024
cumulus@switch:~$ nv config apply
The following example enables the counter histogram on swp1 through swp8 and uses the global settings for the minimum boundary size, histogram size, and the sampling interval. The histogram monitors all received packet counters on ports 1 through 8:
cumulus@switch:~$ nv set interface swp1-8 telemetry histogram counter counter-type rx-packet
cumulus@switch:~$ nv config apply
The following example configures the latency histogram and sets the minimum boundary size to 960 and the histogram size to 12288. These settings apply to interfaces that have the latency histogram enabled and do not have different values configured for these settings at the interface level:
cumulus@switch:~$ nv set system telemetry histogram latency bin-min-boundary 960
cumulus@switch:~$ nv set system telemetry histogram latency histogram-size 12288
cumulus@switch:~$ nv config apply
The following example enables the latency histogram for traffic class 0 on swp1 through swp8 with the globally applied minimum boundary and histogram size. The example also enables the latency histogram for traffic class 1 on swp9 through swp16 and sets the minimum boundary to 768 bytes and the histogram size to 9600 bytes.
cumulus@switch:~$ nv set system telemetry enable on
cumulus@switch:~$ nv set interface swp1-8 telemetry histogram latency traffic-class 0
cumulus@switch:~$ nv set interface swp9-16 telemetry histogram latency traffic-class 1 bin-min-boundary 768
cumulus@switch:~$ nv set interface swp9-16 telemetry histogram latency traffic-class 1 histogram-size 9600
cumulus@switch:~$ nv config apply
Edit settings in the /etc/cumulus/datapath/monitor.conf file, then restart the asic-monitor service with the systemctl restart asic-monitor.service command. The asic-monitor service reads the new configuration file and then runs until you stop the service with the systemctl stop asic-monitor.service command.
The following table describes the ASIC monitor settings.
| Setting | Description |
|---|---|
port_group_list | Specifies the names of the monitors (port groups) you want to use to collect data, such as histogram_pg. You can provide any name you want for the port group. You must use the same name for all the port group settings.Example: monitor.port_group_list = [histogram_pg,discards_pg,buffers_pg,all_packets_pg]Note: You must specify at least one port group. If the port group list is empty, systemd shuts down the asic-monitor service. |
<port_group_name>.port_set | Specifies the range of ports you want to monitor, such as swp4,swp8,swp10-swp50. To specify all ports, use the all_ports option.Example: monitor.histogram_pg.port_set = swp1-swp50 monitor.histogram_pg.port_set = all_ports |
<port_group_name>.stat_type | Specifies the type of data that the port group collects. For egress queue length histograms, specify histogram_tc. For example:monitor.histogram_pg.stat_type = histogram_tcFor ingress queue length histograms, specify histogram_pg. For example:monitor.histogram_pg.stat_type = histogram_pgFor counter histograms, specify histogram_counter. For example:monitor.histogram_pg.stat_type = histogram_counter. For latency histograms, specify histogram_latency. For example:monitor.histogram_pg.stat_type = histogram_latency. |
<port_group_name>.cos_list | For histogram monitoring, each CoS (Class of Service) value in the list has its own histogram on each port. The global limit on the number of histograms is an average of one histogram for each port. Example: monitor.histogram_pg.cos_list = [0] |
<port_group_name>.counter_type | Specifies the counter type for counter histogram monitoring. The counter types can be tx-pkt,rx-pkt,tx-byte,rx-byte.Example: monitor.histogram_pg.counter_type = [rx_byte] |
<port_group_name>.trigger_type | Specifies the type of trigger that initiates data collection. The only option is timer. At least one port group must have a configured timer, otherwise no data is ever collected. Example: monitor.histogram_pg.trigger_type = timer |
<port_group_name>.timer | Specifies the frequency at which data collects; for example, a setting of 1s indicates that data collects one time each second. You can set the timer to the following: 1 to 60 seconds: 1s, 2s, and so on up to 60s 1 to 60 minutes: 1m, 2m, and so on up to 60m 1 to 24 hours: 1h, 2h, and so on up to 24h 1 to 7 days: 1d, 2d and so on up to 7d Example: monitor.histogram_pg.timer = 4s |
<port_group_name>.histogram.minimum_bytes_boundary | For histogram monitoring. The minimum boundary size for the histogram in bytes. On a Spectrum switch, this number must be a multiple of 96. Adding this number to the size of the histogram produces the maximum boundary size. These values represent the range of queue lengths for each bin. Example: monitor.histogram_pg.histogram.minimum_bytes_boundary = 960 |
<port_group_name>.histogram.histogram_size_bytes | For histogram monitoring. The size of the histogram in bytes. Adding this number and the minimum_bytes_boundary value together produces the maximum boundary size. These values represent the range of queue lengths for each bin. Example: monitor.histogram_pg.histogram.histogram_size_bytes = 12288 |
<port_group_name>.histogram.sample_time_ns | For histogram monitoring. The sampling time of the histogram in nanoseconds. Example: monitor.histogram_pg.histogram.sample_time_ns = 1024 |
The following example configures the egress queue length histogram and sets the minimum boundary size to 960, the histogram size to 12288, and the sampling interval to 1024. The histogram collects data every second for traffic class 0 through 15 on all ports:
cumulus@switch:~$ sudo nano /etc/cumulus/datapath/monitor.conf
...
monitor.port_group_list                               = [histogram_pg]
monitor.histogram_pg.port_set                         = allports
monitor.histogram_pg.stat_type                        = histogram_tc
monitor.histogram_pg.cos_list                         = [0-15]
monitor.histogram_pg.trigger_type                     = timer
monitor.histogram_pg.timer                            = 1s
...
monitor.histogram_pg.histogram.minimum_bytes_boundary = 960
monitor.histogram_pg.histogram.histogram_size_bytes   = 12288
monitor.histogram_pg.histogram.sample_time_ns         = 1024
The following example configures the egress queue length histogram and sets the minimum boundary to 960 bytes, the histogram size to 12288 bytes, and the sampling interval to 1024 nanoseconds. The histogram collects data every second for traffic class 0 on swp1 through swp8, and for traffic class 1 on swp9 through swp16.
cumulus@switch:~$ sudo nano /etc/cumulus/datapath/monitor.conf
...
monitor.port_group_list                                = [histogram_gr1, histogram_gr2]
monitor.histogram_gr1.port_set                         = swp1-swp8
monitor.histogram_gr1.stat_type                        = histogram_tc
monitor.histogram_gr1.cos_list                         = [0]
monitor.histogram_gr1.trigger_type                     = timer
monitor.histogram_gr1.timer                            = 1s
...
monitor.histogram_gr1.histogram.minimum_bytes_boundary = 960
monitor.histogram_gr1.histogram.histogram_size_bytes   = 12288
monitor.histogram_gr1.histogram.sample_time_ns         = 1024
monitor.histogram_gr2.port_set                         = swp9-swp16
monitor.histogram_gr2.stat_type                        = histogram_tc
monitor.histogram_gr2.cos_list                         = [1]
monitor.histogram_gr2.trigger_type                     = timer
monitor.histogram_gr2.timer                            = 1s
…
monitor.histogram_gr2.histogram.minimum_bytes_boundary = 960
monitor.histogram_gr2.histogram.histogram_size_bytes   = 12288
monitor.histogram_gr2.histogram.sample_time_ns         = 1024
The following example configures the ingress queue length histogram and sets the minimum boundary size to 960 bytes, the histogram size to 12288 bytes, and the sampling interval to 1024 nanoseconds. The histogram collects data every second for priority group 1 through 15 on all ports.
cumulus@switch:~$ sudo nano /etc/cumulus/datapath/monitor.conf
...
monitor.port_group_list                               = [histogram_pg]
monitor.histogram_pg.port_set                         = allports
monitor.histogram_pg.stat_type                        = histogram_pg
monitor.histogram_pg.cos_list                         = [0-15]
monitor.histogram_pg.trigger_type                     = timer
monitor.histogram_pg.timer                            = 1s
...
monitor.histogram_pg.histogram.minimum_bytes_boundary = 960
monitor.histogram_pg.histogram.histogram_size_bytes   = 12288
monitor.histogram_pg.histogram.sample_time_ns         = 1024
The following example configures the ingress queue length histogram and sets the minimum boundary size to 960, the histogram size to 12288, and the sampling interval to 1024. The histogram monitors priority group 0 on ports 1 through 8 and priority group 1 on ports 9 through 16:
cumulus@switch:~$ sudo nano /etc/cumulus/datapath/monitor.conf
...
monitor.port_group_list                                = [histogram_gr1, histogram_gr2]
monitor.histogram_gr1.port_set                         = swp1-swp8
monitor.histogram_gr1.stat_type                        = histogram_pg
monitor.histogram_gr1.cos_list                         = [0]
monitor.histogram_gr1.trigger_type                     = timer
monitor.histogram_gr1.timer                            = 1s
...
monitor.histogram_gr1.histogram.minimum_bytes_boundary = 960
monitor.histogram_gr1.histogram.histogram_size_bytes   = 12288
monitor.histogram_gr1.histogram.sample_time_ns         = 1024
monitor.histogram_gr2.port_set                         = swp9-swp16
monitor.histogram_gr2.stat_type                        = histogram_pg
monitor.histogram_gr2.cos_list                         = [1]
monitor.histogram_gr2.trigger_type                     = timer
monitor.histogram_gr2.timer                            = 1s
…
monitor.histogram_gr2.histogram.minimum_bytes_boundary = 960
monitor.histogram_gr2.histogram.histogram_size_bytes   = 12288
monitor.histogram_gr2.histogram.sample_time_ns         = 1024
The following example configures the counter histogram and sets the minimum boundary size to 960, the histogram size to 12288, and the sampling interval to 1024. The histogram monitors all counter types:
cumulus@switch:~$ sudo nano /etc/cumulus/datapath/monitor.conf
...
monitor.port_group_list                               = [histogram_pg]
monitor.histogram_pg.port_set                         = allports
monitor.histogram_pg.stat_type                        = histogram_counter
monitor.histogram_pg.counter_type                     = [tx-pkt,rx-pkt,tx-byte,rx-byte]
monitor.histogram_pg.trigger_type                     = timer
monitor.histogram_pg.timer                            = 1s
...
monitor.histogram_pg.histogram.minimum_bytes_boundary = 960
monitor.histogram_pg.histogram.histogram_size_bytes   = 12288
monitor.histogram_pg.histogram.sample_time_ns         = 1024
The following example configures the counter histogram and sets the minimum boundary size to 960, the histogram size to 12288, and the sampling interval to 1024. The histogram monitors all received packets on ports 1 through 8:
cumulus@switch:~$ sudo nano /etc/cumulus/datapath/monitor.conf
...
monitor.port_group_list                               = [histogram_pg]
monitor.histogram_pg.port_set                         = swp1-swp8
monitor.histogram_pg.stat_type                        = histogram_counter
monitor.histogram_pg.counter_type                     = [tx-pkt]
monitor.histogram_pg.trigger_type                     = timer
monitor.histogram_pg.timer                            = 1s
...
monitor.histogram_pg.histogram.minimum_bytes_boundary = 960
monitor.histogram_pg.histogram.histogram_size_bytes   = 12288
monitor.histogram_pg.histogram.sample_time_ns         = 1024
The following example configures the latency histogram and sets the minimum boundary size to 960 and the histogram size to 12288. These settings apply to interfaces that have the latency histogram enabled and do not have different values configured for these settings at the interface level:
cumulus@switch:~$ sudo nano /etc/cumulus/datapath/monitor.conf
...
monitor.port_group_list                               = [latency_pg]
monitor.histogram_pg.port_set                         = allports
monitor.histogram_pg.stat_type                        = histogram_latency
monitor.histogram_pg.cos_list                         = [0-15]
monitor.histogram_pg.trigger_type                     = timer
monitor.histogram_pg.timer                            = 1s
...
monitor.histogram_pg.histogram.minimum_bytes_boundary = 960
monitor.histogram_pg.histogram.histogram_size_bytes   = 12288
The following example enables the latency histogram for traffic class 0 on swp1 through swp8 with the globally applied minimum boundary and histogram size. The example also enables the latency histogram for traffic class 1 on swp9 through swp16 and sets the minimum boundary to 768 bytes and the histogram size to 9600 bytes.
cumulus@switch:~$ sudo nano /etc/cumulus/datapath/monitor.conf
...
monitor.port_group_list                                = [histogram_gr1, histogram_gr2]
monitor.histogram_gr1.port_set                         = swp1-swp8
monitor.histogram_gr1.stat_type                        = histogram_latency
monitor.histogram_gr1.cos_list                         = [0]
monitor.histogram_gr1.trigger_type                     = timer
monitor.histogram_gr1.timer                            = 1s
...
monitor.histogram_gr1.histogram.minimum_bytes_boundary = 960
monitor.histogram_gr1.histogram.histogram_size_bytes   = 12288
monitor.histogram_gr2.port_set                         = swp9-swp16
monitor.histogram_gr2.stat_type                        = histogram_latency
monitor.histogram_gr2.cos_list                         = [1]
monitor.histogram_gr2.trigger_type                     = timer
monitor.histogram_gr2.timer                            = 1s
…
monitor.histogram_gr2.histogram.minimum_bytes_boundary = 960
monitor.histogram_gr2.histogram.histogram_size_bytes   = 12288
In the following example:
- Packet drops on swp1 through swp50 collect every two seconds.
- If the number of packet drops is greater than 100, the results write to the
/var/lib/cumulus/discard_statssnapshot file and the system sends a message to the/var/log/syslogfile.
monitor.port_group_list                            = [discards_pg]
monitor.discards_pg.port_set                       = swp1-swp50
monitor.discards_pg.stat_type                      = packet
monitor.discards_pg.action_list                    = [snapshot,log]
monitor.discards_pg.trigger_type                   = timer
monitor.discards_pg.timer                          = 2s
monitor.discards_pg.log.packet_error_drops         = 100
monitor.discards_pg.snapshot.packet_error_drops    = 100
monitor.discards_pg.snapshot.file                  = /var/lib/cumulus/discard_stats
monitor.discards_pg.snapshot.file_count            = 16
A collect action triggers the collection of additional information. You can daisy chain multiple monitors (port groups) into a single collect action.
In the following example:
- Queue length histograms collect for swp1 through swp50 every second.
- The results write to the
/var/run/cumulus/histogram_statssnapshot file. - When the queue length reaches 500 bytes, the system sends a message to the /var/log/syslog file and collects additional data; buffer occupancy and all packets for each port.
- Buffer occupancy data writes to the
/var/lib/cumulus/buffer_statssnapshot file and all packets for each port data writes to the/var/lib/cumulus/all_packet_statssnapshot file. - In addition, packet drops on swp1 through swp50 collect every two seconds. If the number of packet drops is greater than 100, the monitor writes the results to the
/var/lib/cumulus/discard_statssnapshot file and sends a message to the/var/log/syslogfile.
monitor.port_group_list                               = [histogram_pg,discards_pg]
monitor.histogram_pg.port_set                         = swp1-swp50
monitor.histogram_pg.stat_type                        = buffer
monitor.histogram_pg.cos_list                         = [0]
monitor.histogram_pg.trigger_type                     = timer
monitor.histogram_pg.timer                            = 1s
monitor.histogram_pg.action_list                      = [snapshot,collect,log]
monitor.histogram_pg.snapshot.file                    = /var/run/cumulus/histogram_stats
monitor.histogram_pg.snapshot.file_count              = 64
monitor.histogram_pg.histogram.minimum_bytes_boundary = 960
monitor.histogram_pg.histogram.histogram_size_bytes   = 12288
monitor.histogram_pg.histogram.sample_time_ns         = 1024
monitor.histogram_pg.log.queue_bytes                  = 500
monitor.histogram_pg.collect.queue_bytes              = 500
monitor.histogram_pg.collect.port_group_list          = [buffers_pg,all_packet_pg]
monitor.buffers_pg.port_set                           = swp1-swp50
monitor.buffers_pg.stat_type                          = buffer
monitor.buffers_pg.action_list                        = [snapshot]
monitor.buffers_pg.snapshot.file                      = /var/lib/cumulus/buffer_stats
monitor.buffers_pg.snapshot.file_count                = 8
monitor.all_packet_pg.port_set                        = swp1-swp50
monitor.all_packet_pg.stat_type                       = packet_all
monitor.all_packet_pg.action_list                     = [snapshot]
monitor.all_packet_pg.snapshot.file                   = /var/lib/cumulus/all_packet_stats
monitor.all_packet_pg.snapshot.file_count             = 8
monitor.discards_pg.port_set                          = swp1-swp50
monitor.discards_pg.stat_type                         = packet
monitor.discards_pg.action_list                       = [snapshot,log]
monitor.discards_pg.trigger_type                      = timer
monitor.discards_pg.timer                             = 2s
monitor.discards_pg.log.packet_error_drops            = 100
monitor.discards_pg.snapshot.packet_error_drops       = 100
monitor.discards_pg.snapshot.file                     = /var/lib/cumulus/discard_stats
monitor.discards_pg.snapshot.file_count               = 16
Bandwidth Gauge
Cumulus Linux supports the bandwidth gauge option on the Spectrum-4 switch only.
To track bandwidth usage for an interface, you can enable the bandwidth gauge option with the nv set interface <interface-id> telemetry bw-gauge enable on command:
cumulus@switch:~$ nv set interface swp1 telemetry bw-gauge enable on
cumulus@switch:~$ nv config apply
To disable the bandwidth gauge setting, run the nv set interface <interface-id> telemetry bw-gauge enable off command.
To show the bandwidth gauge setting for an interface, run the nv show interface <interface> telemetry bw-gauge command:
cumulus@switch:~$ nv show interface swp1 telemetry bw-gauge
        operational  applied
------  -----------  -------
enable  on           on
To show a summary of the bandwidth for an interface, run the nv show system telemetry bw-gauge interface command:
cumulus@switch:~$ nv show system telemetry bw-gauge interface
Interface  Tx (Mbps)  Rx (Mbps)
---------  ---------  ---------
swp1       4          4
Snapshots
To create a snapshot:
- Set how often to write to a snapshot file. The default value is 1 second.
- Provide the snapshot file name and location. The default location and file name is
/var/run/cumulus/histogram_stats. - Configure the number of snapshots to create before Cumulus Linux overwrites the first snapshot file. For example, if you set the snapshot file count to 30, the first snapshot file is
histogram_stats_0and the 30th snapshot ishistogram_stats_30. After the 30th snapshot, Cumulus Linux overwrites the original snapshot file (histogram_stats_0) and the sequence restarts. The default value is 64.
Snapshots provide you with more data; however, they can occupy a lot of disk space on the switch. To reduce disk usage, you can use a volatile partition for the snapshot files; for example, /var/run/cumulus/histogram_stats.
The following example creates the /var/run/cumulus/histogram_stats snapshot every 5 seconds. The number of snapshots that you can create before the first snapshot file is overwritten is set to 30.
cumulus@switch:~$ nv set system telemetry snapshot-file name /var/run/cumulus/histogram_stats
cumulus@switch:~$ nv set system telemetry snapshot-file count 30
cumulus@switch:~$ nv set system telemetry snapshot-interval 5
cumulus@switch:~$ nv config apply
Edit the snapshot.file settings in the /etc/cumulus/datapath/monitor.conf file, then restart the asic-monitor service with the systemctl restart asic-monitor.service command. The asic-monitor service reads the new configuration file and then runs until you stop the service with the systemctl stop asic-monitor.service command.
| Setting | Description |
|---|---|
<port_group_name>.action_list | Specifies one or more actions that occur when data collects:snapshot writes a snapshot of the data collection results to a file. If you specify this action, you must also specify a snapshot file (described below). You can also specify a threshold that initiates the snapshot action.Example: monitor.histogram_pg.action_list = [snapshot] collect gathers additional data. If you specify this action, you must also specify the port groups for the additional data you want to collect.Example: monitor.histogram_pg.action_list = [collect log sends a message to the /var/log/syslog file. If you specify this action, you must also specify a threshold that initiates the log action.Example: monitor.histogram_pg.action_list = [log]You can use all three of these actions in one monitoring step. For example monitor.histogram_pg.action_list = [snapshot,collect,log]Note: If an action appears in the action list but does not have the required settings (such as a threshold for the log action), the ASIC monitor stops and reports an error. |
<port_group_name>.snapshot.file | Specifies the name for the snapshot file. All snapshots use this name, with a sequential number appended to it. See the snapshot.file_count setting.Example: monitor.histogram_pg.snapshot.file = /var/run/cumulus/histogram_stats |
<port_group_name>.snapshot.file_count | Specifies the number of snapshots you can create before Cumulus Linux overwrites the first snapshot file. In the following example, because the snapshot file count is set to 64, the first snapshot file is histogram_stats_0 and the 64th snapshot is histogram_stats_63. After the 65th snapshot, Cumulus Linux overwrites the original snapshot file (histogram_stats_0) and the sequence restarts.Example: monitor.histogram_pg.snapshot.file_count = 64Note: While more snapshots provide you with more data, they can occupy a lot of disk space on the switch. |
- To show an ingress queue snapshot, run the
nv show interface <interface> telemetry histogram ingress-buffer priority-group <value> snapshotcommand - To show an egress queue snapshot, run the
nv show interface <interface> telemetry histogram egress-buffer traffic-class <type> snapshot - To show a counter snapshot, run the
nv show interface <interface> telemetry histogram counter counter-type <type> snapshot - To show a latency snapshot, run the
nv show interface <interface> telemetry histogram latency traffic-class <type> snapshot
The following example shows an ingress queue snapshot:
cumulus@switch:~$ nv show interface swp1 telemetry histogram ingress-buffer priority-group 0 snapshot
Sl.No  Date-Time            Bin-0   Bin-1    Bin-2    Bin-3    Bin-4    Bin-5    Bin-6    Bin-7     Bin-8     Bin-9
-----  -------------------  ------  -------  -------  -------  -------  -------  -------  --------  --------  ---------
0      -                    (<864)  (<2304)  (<3744)  (<5184)  (<6624)  (<8064)  (<9504)  (<10944)  (<12384)  (>=12384)
1      2023-12-13 11:02:44  980318  0        0        0        0        0        0        0         0         0
2      2023-12-13 11:02:43  980318  0        0        0        0        0        0        0         0         0
3      2023-12-13 11:02:42  980318  0        0        0        0        0        0        0         0         0
4      2023-12-13 11:02:41  980318  0        0        0        0        0        0        0         0         0
5      2023-12-13 11:02:40  980488  0        0        0        0        0        0        0         0         0
6      2023-12-13 11:02:39  980149  0        0        0        0        0        0        0         0         0
7      2023-12-13 11:02:38  979809  0        0        0        0        0        0        0         0         0
8      2023-12-13 11:02:37  980488  0        0        0        0        0        0        0         0         0
9      2023-12-13 11:02:36  980318  0        0        0        0        0        0        0         0         0
Parsing the snapshot file and finding the information you need can be tedious; use a third-party analysis tool to analyze the data in the file.
Log files
In addition to snapshots, you can configure the switch to send log messages to the /var/log/syslog file when the queue length reaches a specified number of bytes, the number of counters reach a specified value, or the latency reaches a specific number of nanoseconds.
The following example sends a message to the /var/log/syslog file after the ingress queue length for priority group 1 on swp9 through swp16 reaches 5000 bytes:
cumulus@switch:~$ nv set interface swp9-16 telemetry histogram ingress-buffer priority-group 1 threshold action log
cumulus@switch:~$ nv set interface swp9-16 telemetry histogram ingress-buffer priority-group 1 threshold value 5000
cumulus@switch:~$ nv config apply
The following example sends a message to the /var/log/syslog file after the number of received packets on swp1 through swp8 reaches 500:
cumulus@switch:~$ nv set interface swp1-8 telemetry histogram counter counter-type rx-packet threshold log
cumulus@switch:~$ nv set interface swp1-8 telemetry histogram counter counter-type rx-packet threshold value 500
cumulus@switch:~$ nv config apply
The following example sends a message to the /var/log/syslog file after packet latency for traffic class 0 on swp1 through swp8 reaches 500 nanoseconds:
cumulus@switch:~$ nv set interface swp1-8 telemetry histogram latency traffic-class 0 threshold action log
cumulus@switch:~$ nv set interface swp1-8 telemetry histogram latency traffic-class 0 threshold value 500
cumulus@switch:~$ nv config apply
Set the log options in the /etc/cumulus/datapath/monitor.conf file, then restart the asic-monitor service with the systemctl restart asic-monitor.service command. The asic-monitor service reads the new configuration file and then runs until you stop the service with the systemctl stop asic-monitor.service command.
| Setting | Description |
|---|---|
<port_group_name>.log.action_list | Set this option to log to create a log message when the queue length or counter number reaches the threshold set. |
<port_group_name>.log.queue_bytes | Specifies the length of the queue in bytes after which the switch sends a log message. |
<port_group_name>.log.count | Specifies the number of counters to reach after which the switch sends a log message. |
<port_group_name>.log.value | Specifies the number of latency nanoseconds to reach after which the switch sends a log message. |
The following example sends a message to the /var/log/syslog file after the ingress queue length reaches 5000 bytes:
...
monitor.histogram_pg.action_list  = [log]
...
monitor.histogram_pg.log.queue_bytes  = 5000
The following example sends a message to the /var/log/syslog file after the number of packets reaches 500:
...
monitor.histogram_pg.action_list  = [log]
...
monitor.histogram_pg.log.count  = 500
The following example sends a message to the /var/log/syslog file after packet latency reaches 500 nanoseconds:
...
monitor.histogram_pg.action_list  = [log]
...
monitor.histogram_pg.log.value  = 500
The following shows an example syslog message:
2018-02-26T20:14:41.560840+00:00 cumulus asic-monitor-module INFO: 2018-02-26 20:14:41.559967: Egress queue(s) greater than 500 bytes in monitor port group histogram_pg.
When collecting data, the switch uses both the CPU and SDK process, which can affect switchd. Snapshots and logs can occupy a lot of disk space if you do not limit their number.
Show Histogram Information
To show a list of the interfaces with enabled histograms, run the nv show system telemetry histogram interface command:
cumulus@switch:~$ nv show system telemetry histogram interface
Interface         ingress-buffer          egress-buffer            counter
---------------------------------------------------------------------------------------
swp1              0,1,2                   -                        tx-byte,rx-byte
swp2              -                       0,1,8                    tx-byte,tx-byte
To show the egress queue depth histogram samples collected at the configured interval for a traffic class for a port, run the nv show interface <interface> telemetry histogram egress-buffer traffic-class <traffic-class> command.
cumulus@switch:~$ nv show interface swp1 telemetry histogram egress-buffer traffic-class 0
Time         0-863     864:2303    2304:3743.  3744:5183   5184:6623   6624:8063   8064:9503 9. 504:10943   10944:12383
12384:*
----------------------------------------------------------------------------------------------------------------------------------------------------------------------------
08:56:19     978065        0           0           0          0            0           0             0          0
08:56:20     978532        0           0           0          0            0           0             0          0
To show the ingress queue depth histogram samples collected at the configured interval for a priority group for a port, run the nv show interface <interface> telemetry histogram ingress-buffer priority-group <priority-group> command.
cumulus@switch:~$ nv show interface swp1 telemetry histogram ingress-buffer priority-group 0
Time      0-863     864:2303    2304:3743  3744:5183   5184:6623   6624:8063   8064:9503 9. 504:10943   10944:12383
12384:*
----------------------------------------------------------------------------------------------------------------------------------------------------------------------------
08:56:19  978065        0          0           0           0            0           0           0             0
08:56:20  978532        0          0           0           0            0           0           0             0
High Frequency Telemetry
High frequency telemetry enables you to collect counters at very short sampling intervals (single digit milliseconds to microseconds). The data can help you detect short duration events like microbursts, and provides information about where in time the events happen and for how long.
High frequency telemetry data provides time-series data that traditional histograms cannot provide. This data can help you understand the shape of the traffic pattern and identify any spikes or dips, or jitter in the traffic.
Cumulus Linux collects high frequency telemetry data in a json format file. You can upload the file to an external location, then process the data, plot it into a time-series graph and see how the network behaves with high precision.
- Cumulus Linux supports high frequency telemetry on Spectrum-4 switches only.
- Cumulus Linux does not support high frequency telemetry on ports using 8 lanes. On the Spectrum-4 switch, swp1 through swp64 use all 8 lanes; to run high frequency telemetry, you must break out these ports.
- To correlate counters from different switches, the switches must have the same time (Cumulus Linux adds timestamps in the metadata of the counters it collects). You can use either NTP or PTP; however, NVIDIA recommends using PTP because the timestamp is accurate between switches in the fabric at the microsecond level.
- The collected data is available on the switch until you trigger the next data collection job or until you reboot the switch.
Cumulus Linux provides two options to configure high frequency telemetry; you can run NVUE commands or use the Cumulus Linux job management tool (cl-hft-tool). You can see all the cl-hft-tool command options with cl-hft-tool -h. Cumulus Linux recommends that you use NVUE commands.
To configure high frequency telemetry:
- Enable telemetry with the
nv set system telemetry enable oncommand. - Configure data collection.
- Configure data export.
- Configure the schedule.
Configure Data Collection
High frequency telemetry uses profiles for data collection. A profile is a set of configurations. Cumulus Linux provides a default profile called standard. You can create a maximum of four new profiles (four profiles in addition to the default profile).
You cannot delete or modify a profile if data collection jobs are already running or scheduled.
To configure data collection:
- Set the sampling interval in microseconds for the profile. You can specify a value between 100 and 12750. The value must be a multiple of 50. The default value is 5000 microseconds.
- Specify the type of data you want to collect for the profile. You can collect transmitted bytes, received bytes, and current traffic class buffer occupancy. The
standardprofile collects all three data types. - Set the egress queue priorities (traffic class 0-15) for the profile if the data types you want to collect include current traffic class buffer occupancy. The
standardprofile setting is 3.
Use commas (no spaces) to separate the list of traffic classes. For example, to set traffic class 1, 3, and 6, specify 1,3,6.
The following example configures profile1 and sets the sampling interval to 1000, the traffic class to 0, 3, and 7, and the type of data to collect to traffic class buffer occupancy (tc-occupancy):
cumulus@switch:~$ nv set system telemetry hft profile profile1 sample-interval 1000
cumulus@switch:~$ nv set system telemetry hft profile profile1 counter tc-occupancy
cumulus@switch:~$ nv set system telemetry hft profile profile1 traffic-class 0,3,7
cumulus@switch:~$ nv config apply
The following example configures profile2 and sets the sampling interval to 1000, and the type of data to collect to received bytes (rx-byte) and transmitted bytes (tx-byte).
You must specify the nv set system telemetry hft profile <profile-id> counter command for each data type you want to collect.
cumulus@switch:~$ nv set system telemetry hft profile profile2 sample-interval 1000
cumulus@switch:~$ nv set system telemetry hft profile profile2 counter rx-byte
cumulus@switch:~$ nv set system telemetry hft profile profile2 counter tx-byte
cumulus@switch:~$ nv config apply
To delete a profile, run the nv unset system telemetry hft profile <profile-id> command.
The following example configures profile1 and sets the sampling interval to 1000, the traffic class to 0, 3, and 7, and the type of data to collect to traffic class buffer occupancy (tc_curr_occupancy):
cumulus@switch:~$ cl-hft-tool profile-add --name profile1 --counter tc_curr_occupancy --tc 0,3,7 --interval 1000
The following example configures profile2, and sets the sampling interval to 1000 and the type of data to collect to received bytes (if_in_octets) and transmitted bytes (if_out_octets):
cumulus@switch:~$ cl-hft-tool profile-add --name profile2 --counter if_in_octets,if_out_octets --interval 1000
To delete a profile, run the cl-hft-tool profile-delete --name <profile-id> command:
cumulus@switch:~$ cl-hft-tool profile-delete --name profile1
To delete all profiles, run the cl-hft-tool profile-delete --name all command.
Configure Data Export
You can save the collected data locally to a json file in the /var/run/cumulus/hft directory, then export the json file to an external location with NVUE commands (or the API). The json format file includes the data for each sampling interval and a timestamp for the collected data.
- The collected data is available on the switch until you trigger the next data collection or until you reboot the switch.
- You must configure data export (the target) before you can configure a schedule.
To save the collected data locally to a json file, run the nv set system telemetry hft target local command:
cumulus@switch:~$ nv set system telemetry hft target local
cumulus@switch:~$ nv config apply
The following example saves the collected data locally to a json file:
cumulus@switch:~$ cl-hft-tool target-add --target local
To delete a target, run the cl-hft-tool target-delete --target local command:
cumulus@switch:~$ cl-hft-tool target-delete --target local
To export a json file to an external location, run the NVUE nv action upload system telemetry hft job <job-id> <remote-url> command. Cumulus Linux supports FTP, SCP, and SFTP. You can see the list of jobs with the nv show system telemetry hft job command.
cumulus@switch:~$ nv action upload system telemetry hft job 1 scp://root@host1:/home/telemetry/
Configure the Job Schedule
To configure the schedule for a data collection profile, set:
- The start date and time. You can also start data collection immediately with the
nowoption. - The session duration in seconds. The default value is 20 seconds.
- The ports on which you want to collect the data. You can specify a range of ports, multiple comma separated ports, or
allfor all the ports. The default value isall.
- You can schedule a maximum of 25 sessions (jobs). These 25 jobs are active jobs whose states are either
running(collecting counters now) orpending(scheduled to collect data in a future date and time). The switch can keep data for 10 jobs (in acompleted,cancelled, orfailedstate) in addition to the 25 maximum active jobs. - You must configure data export (the target) before you can configure the schedule.
- The switch ASIC can only run one high frequency telemetry job at a time; You cannot schedule two jobs to run at the same time.
- There might be a delay of two to three seconds between the scheduled time and the actual data sampling start time in the ASIC.
The following example configures profile1 to start on 2024-07-17 at 10:00:00, run for 30 seconds, and collect data on swp1s0 through swp9s0.
Specify the date and time in YYYY-MM-DD HH:MM:SS format.
cumulus@switch:~$ nv action schedule system telemetry hft job 2024–07-17 10:00:00 duration 30 profile profile1 ports swp1s0-swp9s0
Action executing ...
Job schedule successfull.
HFT job schedule successful: job-id 1

Action succeeded
You can provide a short reason why you are collecting the data. If the description contains more than one word, you must enclose the description in quotes. A description is optional.
cumulus@switch:~$ nv action schedule system telemetry hft job 2024-07-17 10:00:00 duration 30 profile profile1 ports swp1s0-swp9s0 description "bandwidth profiling"
Action executing ...
Job schedule successfull.
HFT job schedule successful: job-id 1

Action succeeded
You can specify now for the date and/or time to configure the current date and time of day. The following example configures profile2 to start today at 10:00:00, run for 30 seconds, and collect data on swp2s0.
cumulus@switch:~$ nv action schedule system telemetry hft job now 10:00:00 duration 30 profile profile2 ports swp2s0
Action executing ...
Job schedule successfull.
HFT job schedule successful: job-id 2

Action succeeded
The following example configures profile2 to start immediately, run for 30 seconds, and collect data on swp2s0.
cumulus@switch:~$ nv action schedule system telemetry hft job now now duration 30 profile profile2 ports swp2s0
Action executing ...
Job schedule successfull.
HFT job schedule successful: job-id 2

Action succeeded
The following example configures profile1 to start on 2024-07-17 at 10:00:00, run for 30 seconds, and collect data on swp1s0 through swp9s0.
Specify the date and time in YYYY-MM-DD-HH:MM:SS format.
cumulus@switch:~$ cl-hft-tool job-schedule --time 2024–07-17-10:00:00 --duration 30 --profile profile1 --ports swp1s0-swp9s0
You can provide a short reason why you are collecting the data. If the description contains more than one word, you must enclose the description in quotes. A description is optional.
cumulus@switch:~$ cl-hft-tool job-schedule --time 2024–07-17-10:00:00 --duration 30 --profile profile1 --ports swp1s0-swp9s0 --description "bandwidth profiling"
Cancel Data Collection
You can cancel a specific or all data collection jobs, or a specific or all jobs for a profile.
To cancel a scheduled telemetry job, run the nv action cancel system telemetry hft job <job-id> profile <profile-id> command. Run the nv show system telemetry hft job command to see the list of job IDs.
The following example cancels all jobs for profile profile1:
cumulus@switch:~$ nv action cancel system telemetry hft job all profile profile1
Action executing ...
Action succeeded
The following example cancels job 6:
cumulus@switch:~$ nv action cancel system telemetry hft job 6
Action executing ...
Action succeeded
To cancel a scheduled telemetry job, run the cl-hft-tool job-cancel --job <job-id> command.
The following example cancels job 6:
cumulus@switch:~$ cl-hft-tool job-cancel --job 6
Show Session Information
To show a summary of high frequency telemetry configuration and data:
cumulus@switch:~$ nv show system telemetry hft
profile
==========
    Profile        traffic-class  counter       sample-interval
    -------------  -------------  ------------  ---------------
    standard       3              rx-byte       5000
                                  tc-occupancy
                                  tx-byte
    user_profile1  0              rx-byte       1000
                   1              tc-occupancy
                   2              tx-byte

job
======
    Job  Counter                       duration  sample-interval  Start Time            Traffic Class  Status     Description
    ---  ----------------------------  --------  ---------------  --------------------  -------------  ---------  -----------
    1    tx-byte,rx-byte,tc-occupancy  20        5000             2024-07-30T05:34:23Z  3              completed  NA
    2    tx-byte,rx-byte,tc-occupancy  20        1000             2024-07-30T05:35:17Z  0-2            completed  NA
...
To show the high frequency telemetry profiles configured on the switch:
cumulus@switch:~$ nv show system telemetry hft profile
Profile        traffic-class  counter       sample-interval
-------------  -------------  ------------  ---------------
standard       3              rx-byte       5000
                              tc-occupancy
                              tx-byte
user_profile1  0              rx-byte       1000
               1              tc-occupancy
               2              tx-byte
To show the settings for a specific profile:
cumulus@switch:~$ nv show system telemetry hft profile profile1
                 operational  applied
---------------  -----------  -------
sample-interval  1000         1000
[traffic-class]  0            0
[traffic-class]  1            1
[traffic-class]  2            2
[traffic-class]  3            3
[traffic-class]  4            4
[traffic-class]  5            5
[traffic-class]  6            6
[traffic-class]  7            7
[traffic-class]  8            8
[traffic-class]  9            9
[counter]        rx-byte      rx-byte
[counter]        tx-byte      tx-byte
To show configured targets:
cumulus@switch:~$ nv show system telemetry hft target
applied
-------
local
To show information for all data collection jobs:
cumulus@switch:~$ nv show system telemetry hft job
Job  Counter                       duration  sample-interval  Start Time            Traffic Class  Status     Description
---  ----------------------------  --------  ---------------  --------------------  -------------  ---------  -----------
1    tx-byte,rx-byte,tc-occupancy  20        5000             2024-07-30T05:34:23Z  3              completed  NA
2    tx-byte,rx-byte,tc-occupancy  20        1000             2024-07-30T05:35:17Z  0-2            completed  NA
To show information about a specific data collection job:
cumulus@switch:~$ nv show system telemetry hft job 1
duration      : 20                sample_interval : 5000
status        : completed         start_time      : 2024-07-30T05:34:23Z
traffic_class : 3                 counter         : tx-byte,rx-byte,tc-occupancy
description   : NA
target        : /var/run/cumulus/hft
port          : swp9s0