NetQ Components
Cumulus NetQ contains the following applications and key components:
- Telemetry data collection and aggregation
- NetQ switch agents
- NetQ host agents
- Telemetry data aggregation
- Database
- Data streaming
- Network services
- User interfaces
While these functions apply to both the on-premises and in-cloud solutions, where the functions reside varies, as shown here.
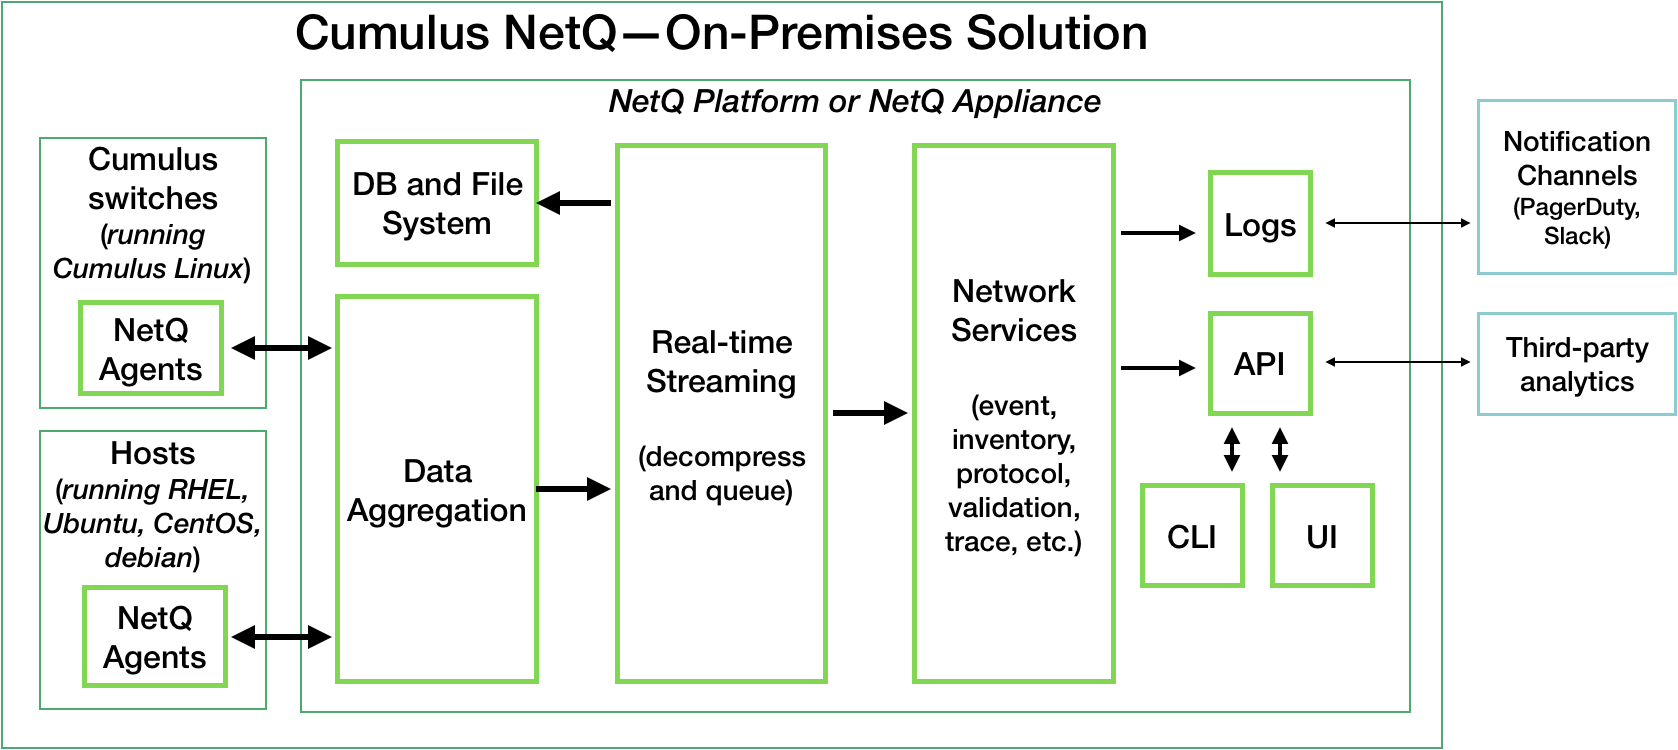
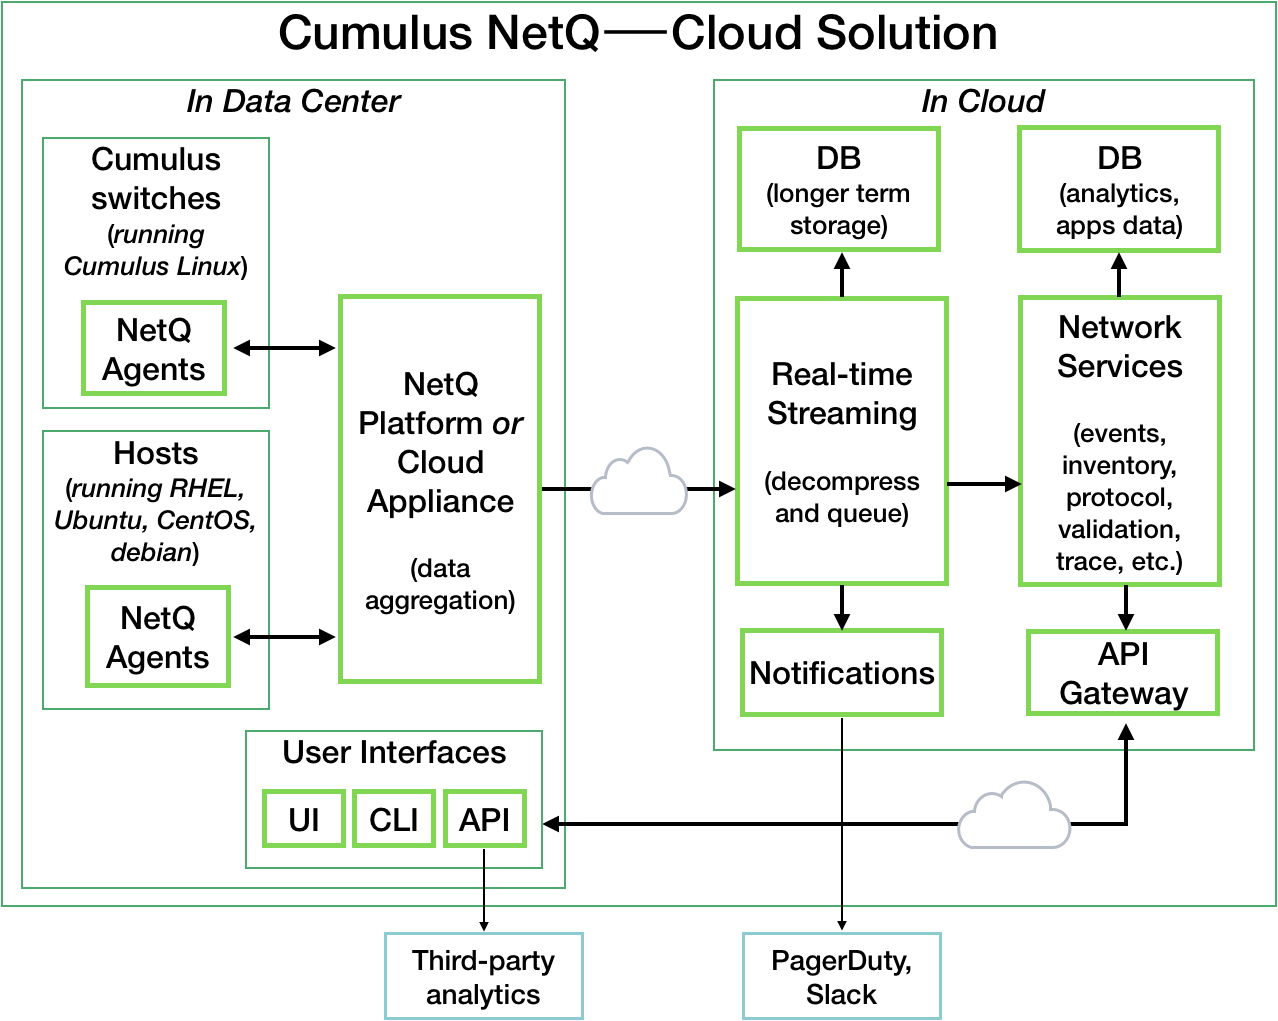
NetQ interfaces with event notification applications, third-party analytics tools.
Each of the NetQ components used to gather, store and process data about the network state are described here.
NetQ Agents
NetQ Agents are software installed and running on every monitored node in the network — including Cumulus® Linux® switches, Linux bare metal hosts, and virtual machines. The NetQ Agents push network data regularly and event information immediately to the NetQ Platform.
Switch Agents
The NetQ Agents running on Cumulus Linux or SONiC switches gather the following network data via Netlink:
- Interfaces
- IP addresses (v4 and v6)
- IP routes (v4 and v6)
- Links
- Bridge FDB (MAC Address table)
- ARP Entries/Neighbors (IPv4 and IPv6)
for the following protocols:
- Bridging protocols: LLDP, STP, MLAG
- Routing protocols: BGP, OSPF
- Network virtualization: EVPN, VXLAN
The NetQ Agent is supported on Cumulus Linux 3.3.2 and later and SONiC 202012 and later.
Host Agents
The NetQ Agents running on hosts gather the same information as that for switches, plus the following network data:
- Network IP and MAC addresses
- Container IP and MAC addresses
The NetQ Agent obtains container information by listening to the Kubernetes orchestration tool.
The NetQ Agent is supported on hosts running Ubuntu 16.04, Red Hat® Enterprise Linux 7, and CentOS 7 Operating Systems.
NetQ Core
The NetQ core performs the data collection, storage, and processing for delivery to various user interfaces. It is comprised of a collection of scalable components running entirely within a single server. The NetQ software queries this server, rather than individual devices enabling greater scalability of the system. Each of these components is described briefly here.
Data Aggregation
The data aggregation component collects data coming from all of the NetQ Agents. It then filters, compresses, and forwards the data to the streaming component. The server monitors for missing messages and also monitors the NetQ Agents themselves, providing alarms when appropriate. In addition to the telemetry data collected from the NetQ Agents, the aggregation component collects information from the switches and hosts, such as vendor, model, version, and basic operational state.
Data Stores
Two types of data stores are used in the NetQ product. The first stores the raw data, data aggregations, and discrete events needed for quick response to data requests. The second stores data based on correlations, transformations and processing of the raw data.
Real-time Streaming
The streaming component processes the incoming raw data from the aggregation server in real time. It reads the metrics and stores them as a time series, and triggers alarms based on anomaly detection, thresholds, and events.
Network Services
The network services component monitors protocols and services operation individually and on a networkwide basis and stores status details.
User Interfaces
NetQ data is available through several user interfaces:
- NetQ CLI (command line interface)
- NetQ UI (graphical user interface)
- NetQ RESTful API (representational state transfer application programming interface)
The CLI and UI query the RESTful API for the data to present. Standard integrations can be configured to integrate with third-party notification tools.