NetQ Operation
In either in-band or out-of-band deployments, NetQ offers networkwide configuration and device management, proactive monitoring capabilities, and performance diagnostics for complete management of your network. Each component of the solution provides a critical element to make this possible.
The NetQ Agent
From a software perspective, a network switch has software associated with the hardware platform, the operating system, and communications. For data centers, the software on a network switch is similar to the diagram shown here.
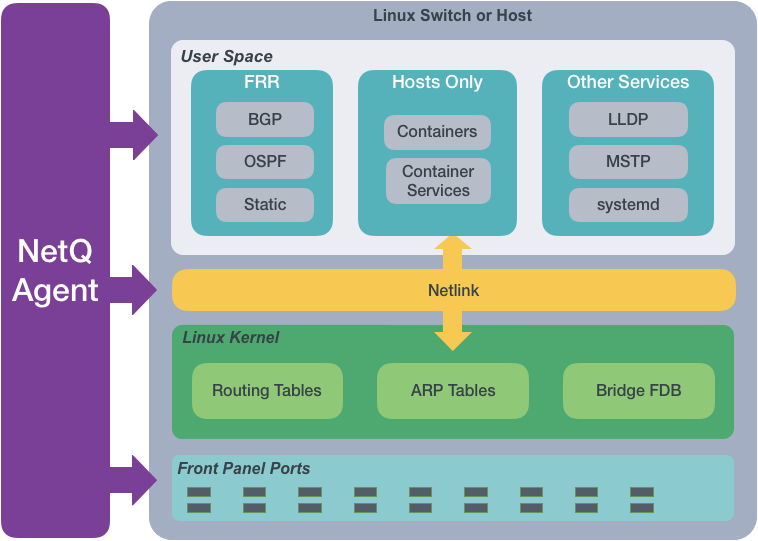
The NetQ Agent interacts with the various components and software on switches and hosts and provides the gathered information to the NetQ Platform. You can view the data using the NetQ CLI or UI.
The NetQ Agent polls the user space applications for information about the performance of the various routing protocols and services that are running on the switch. Cumulus Linux supports BGP and OSPF routing protocols as well as static addressing through FRRouting (FRR). Cumulus Linux also supports LLDP and MSTP among other protocols, and a variety of services such as systemd and sensors. SONiC supports BGP and LLDP.
For hosts, the NetQ Agent also polls for performance of containers managed with Kubernetes. All of this information is used to provide the current health of the network and verify it is configured and operating correctly.
For example, if the NetQ Agent learns that an interface has gone down, a new BGP neighbor has been configured, or a container has moved, it provides that information to the NetQ Platform. That information can then be used to notify users of the operational state change through various channels. By default, data is logged in the database, but you can use the CLI (netq show events) or configure the Event Service in NetQ to send the information to a third-party notification application as well. NetQ supports PagerDuty and Slack integrations.
The NetQ Agent interacts with the Netlink communications between the Linux kernel and the user space, listening for changes to the network state, configurations, routes and MAC addresses. NetQ uses this information to enable notifications about these changes so that network operators and administrators can respond quickly when changes are not expected or favorable.
For example, if a new route is added or a MAC address removed, NetQ Agent records these changes and sends that information to the NetQ Platform. Based on the configuration of the Event Service, these changes can be sent to a variety of locations for end user response.
The NetQ Agent also interacts with the hardware platform to obtain performance information about various physical components, such as fans and power supplies, on the switch. Operational states and temperatures are measured and reported, along with cabling information to enable management of the hardware and cabling, and proactive maintenance.
For example, as thermal sensors in the switch indicate that it is becoming very warm, various levels of alarms are generated. These are then communicated through notifications according to the Event Service configuration.
The NetQ Platform
Once the collected data is sent to and stored in the NetQ database, you can:
- Validate configurations, identifying misconfigurations in your current network, in the past, or prior to deployment,
- Monitor communication paths throughout the network,
- Notify users of issues and management information,
- Anticipate impact of connectivity changes,
- and so forth.
Validate Configurations
The NetQ CLI enables validation of your network health through two sets of commands: netq check and netq show. They extract the information from the Network Service component and Event service. The Network Service component is continually validating the connectivity and configuration of the devices and protocols running on the network. Using the netq check and netq show commands displays the status of the various components and services on a networkwide and complete software stack basis. For example, you can perform a networkwide check on all sessions of BGP with a single netq check bgp command. The command lists any devices that have misconfigurations or other operational errors in seconds. When errors or misconfigurations are present, using the netq show bgp command displays the BGP configuration on each device so that you can compare and contrast each device, looking for potential causes. netq check and netq show commands are available for numerous components and services as shown in the following table.
| Component or Service | Check | Show | Component or Service | Check | Show |
|---|---|---|---|---|---|
| Agents | X | X | LLDP | X | |
| BGP | X | X | MACs | X | |
| CLAG (MLAG) | X | X | MTU | X | |
| Events | X | NTP | X | X | |
| EVPN | X | X | OSPF | X | X |
| Interfaces | X | X | Sensors | X | X |
| Inventory | X | Services | X | ||
| IPv4/v6 | X | VLAN | X | X | |
| Kubernetes | X | VXLAN | X | X |
Monitor Communication Paths
The trace engine validates the available communication paths between two network devices. The corresponding netq trace command enables you to view all of the paths between the two devices and if there are any breaks in the paths. This example shows two successful paths between server12 and leaf11, all with an MTU of 9152. The first command shows the output in path by path tabular mode. The second command shows the same output as a tree.
cumulus@switch:~$ netq trace 10.0.0.13 from 10.0.0.21
Number of Paths: 2
Number of Paths with Errors: 0
Number of Paths with Warnings: 0
Path MTU: 9152
Id  Hop Hostname    InPort          InTun, RtrIf    OutRtrIf, Tun   OutPort
--- --- ----------- --------------- --------------- --------------- ---------------
1   1   server12                                                    bond1.1002
    2   leaf12      swp8                            vlan1002        peerlink-1
    3   leaf11      swp6            vlan1002                        vlan1002
--- --- ----------- --------------- --------------- --------------- ---------------
2   1   server12                                                    bond1.1002
    2   leaf11      swp8                                            vlan1002
--- --- ----------- --------------- --------------- --------------- ---------------


cumulus@switch:~$ netq trace 10.0.0.13 from 10.0.0.21 pretty
Number of Paths: 2
Number of Paths with Errors: 0
Number of Paths with Warnings: 0
Path MTU: 9152
 hostd-12 bond1.1002 -- swp8 leaf12 <vlan1002> peerlink-1 -- swp6 <vlan1002> leaf11 vlan1002
          bond1.1002 -- swp8 leaf11 vlan1002
To better understand the output in greater detail:
- Path 1 traverses the network from server12 out bond1.1002 into leaf12 interface swp8 out VLAN1002 peerlink-1 into VLAN1002 interface swp6 on leaf11
- Path 2 traverses the network from server12 out bond1.1002 into VLAN1002 interface swp8 on leaf11
If the MTU does not match across the network, or any of the paths or parts of the paths have issues, that data appears in the summary at the top of the output and shown in red along the paths, giving you a starting point for troubleshooting.
View Historical State and Configuration
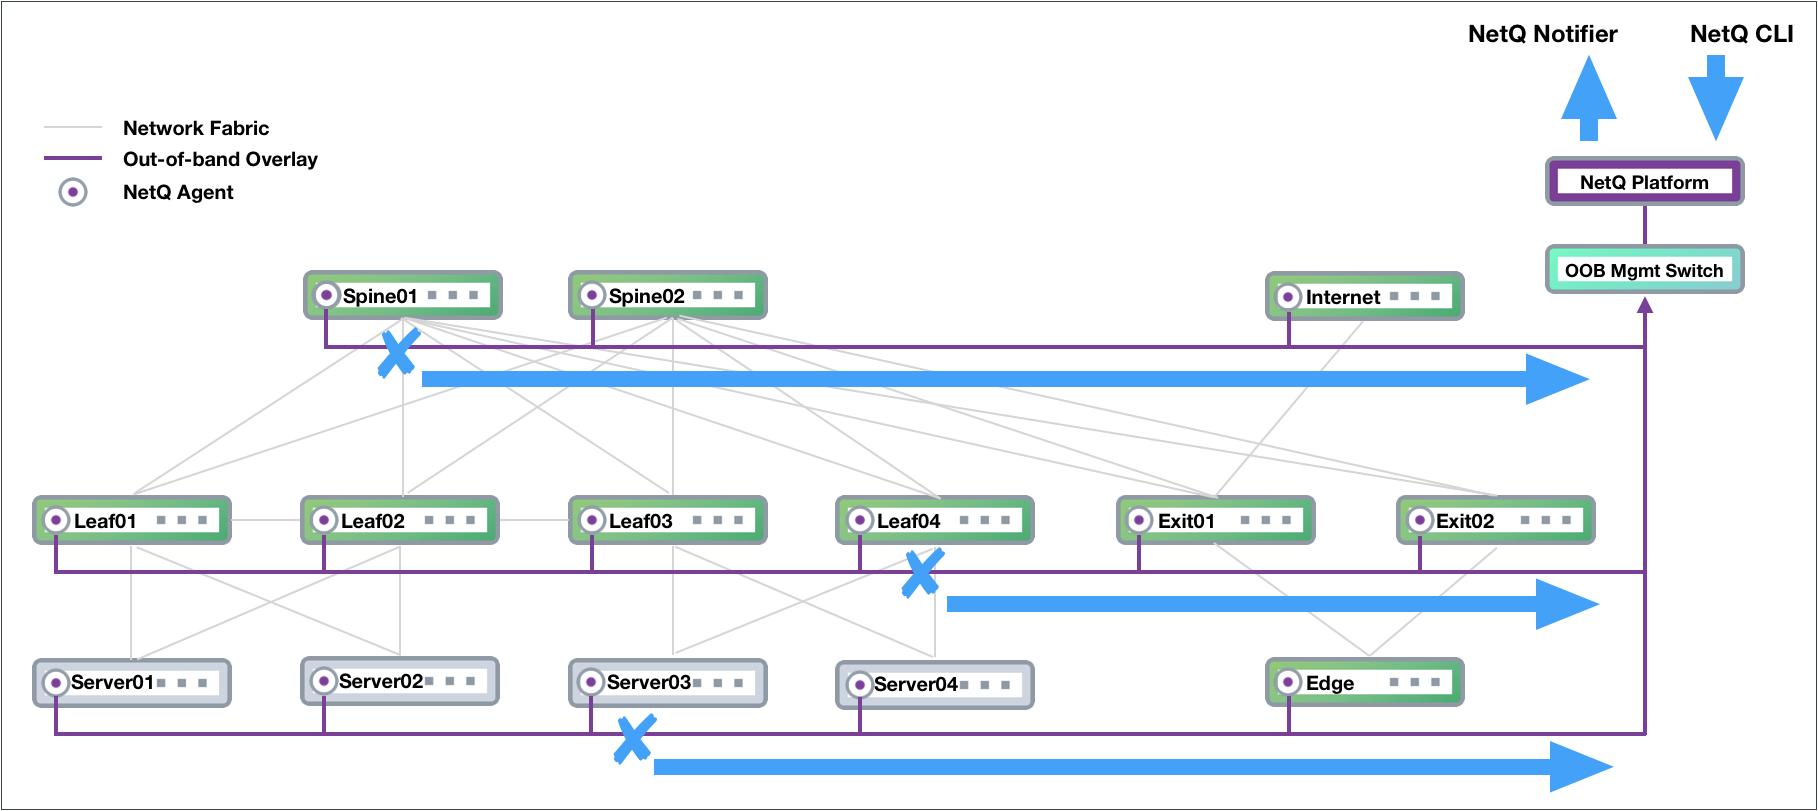
You can run all check, show and trace commands for the current status and for a prior point in time. For example, this is useful when you receive messages from the night before, but are not seeing any problems now. You can use the netq check command to look for configuration or operational issues around the time that NetQ timestamped the messages. Then use the netq show commands to see information about the configuration at that time of the device in question or if there were any changes in a given timeframe. Optionally, you can use the netq trace command to see what the connectivity looked like between any problematic nodes at that time. This example shows problems occurred on spine01, leaf04, and server03 last night. The network administrator received notifications and wants to investigate. Below the diagram are the commands to run to determine the cause of a BGP error on spine01. Note that the commands use the around option to see the results for last night and that you can run them from any switch in the network.
cumulus@switch:~$ netq check bgp around 30m
Total Nodes: 25, Failed Nodes: 3, Total Sessions: 220 , Failed Sessions: 24,
Hostname          VRF             Peer Name         Peer Hostname     Reason                                        Last Changed
----------------- --------------- ----------------- ----------------- --------------------------------------------- -------------------------
exit-1            DataVrf1080     swp6.2            firewall-1        BGP session with peer firewall-1 swp6.2: AFI/ 1d:2h:6m:21s
                                                                      SAFI evpn not activated on peer
exit-1            DataVrf1080     swp7.2            firewall-2        BGP session with peer firewall-2 (swp7.2 vrf  1d:1h:59m:43s
                                                                      DataVrf1080) failed,
                                                                      reason: Peer not configured
exit-1            DataVrf1081     swp6.3            firewall-1        BGP session with peer firewall-1 swp6.3: AFI/ 1d:2h:6m:21s
                                                                      SAFI evpn not activated on peer
exit-1            DataVrf1081     swp7.3            firewall-2        BGP session with peer firewall-2 (swp7.3 vrf  1d:1h:59m:43s
                                                                      DataVrf1081) failed,
                                                                      reason: Peer not configured
exit-1            DataVrf1082     swp6.4            firewall-1        BGP session with peer firewall-1 swp6.4: AFI/ 1d:2h:6m:21s
                                                                      SAFI evpn not activated on peer
exit-1            DataVrf1082     swp7.4            firewall-2        BGP session with peer firewall-2 (swp7.4 vrf  1d:1h:59m:43s
                                                                      DataVrf1082) failed,
                                                                      reason: Peer not configured
exit-1            default         swp6              firewall-1        BGP session with peer firewall-1 swp6: AFI/SA 1d:2h:6m:21s
                                                                      FI evpn not activated on peer
exit-1            default         swp7              firewall-2        BGP session with peer firewall-2 (swp7 vrf de 1d:1h:59m:43s
...

cumulus@switch:~$ netq exit-1 show bgp
Matching bgp records:
Hostname          Neighbor                     VRF             ASN        Peer ASN   PfxRx        Last Changed
----------------- ---------------------------- --------------- ---------- ---------- ------------ -------------------------
exit-1            swp3(spine-1)                default         655537     655435     27/24/412    Fri Feb 15 17:20:00 2019
exit-1            swp3.2(spine-1)              DataVrf1080     655537     655435     14/12/0      Fri Feb 15 17:20:00 2019
exit-1            swp3.3(spine-1)              DataVrf1081     655537     655435     14/12/0      Fri Feb 15 17:20:00 2019
exit-1            swp3.4(spine-1)              DataVrf1082     655537     655435     14/12/0      Fri Feb 15 17:20:00 2019
exit-1            swp4(spine-2)                default         655537     655435     27/24/412    Fri Feb 15 17:20:00 2019
exit-1            swp4.2(spine-2)              DataVrf1080     655537     655435     14/12/0      Fri Feb 15 17:20:00 2019
exit-1            swp4.3(spine-2)              DataVrf1081     655537     655435     14/12/0      Fri Feb 15 17:20:00 2019
exit-1            swp4.4(spine-2)              DataVrf1082     655537     655435     13/12/0      Fri Feb 15 17:20:00 2019
exit-1            swp5(spine-3)                default         655537     655435     28/24/412    Fri Feb 15 17:20:00 2019
exit-1            swp5.2(spine-3)              DataVrf1080     655537     655435     14/12/0      Fri Feb 15 17:20:00 2019
exit-1            swp5.3(spine-3)              DataVrf1081     655537     655435     14/12/0      Fri Feb 15 17:20:00 2019
exit-1            swp5.4(spine-3)              DataVrf1082     655537     655435     14/12/0      Fri Feb 15 17:20:00 2019
exit-1            swp6(firewall-1)             default         655537     655539     73/69/-      Fri Feb 15 17:22:10 2019
exit-1            swp6.2(firewall-1)           DataVrf1080     655537     655539     73/69/-      Fri Feb 15 17:22:10 2019
exit-1            swp6.3(firewall-1)           DataVrf1081     655537     655539     73/69/-      Fri Feb 15 17:22:10 2019
exit-1            swp6.4(firewall-1)           DataVrf1082     655537     655539     73/69/-      Fri Feb 15 17:22:10 2019
exit-1            swp7                         default         655537     -          NotEstd      Fri Feb 15 17:28:48 2019
exit-1            swp7.2                       DataVrf1080     655537     -          NotEstd      Fri Feb 15 17:28:48 2019
exit-1            swp7.3                       DataVrf1081     655537     -          NotEstd      Fri Feb 15 17:28:48 2019
exit-1            swp7.4                       DataVrf1082     655537     -          NotEstd      Fri Feb 15 17:28:48 2019
Manage Network Events
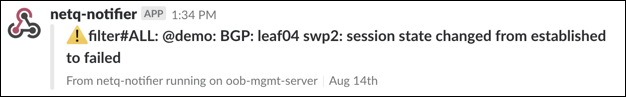
The NetQ notifier manages the events that occur for the devices and components, protocols and services that it receives from the NetQ Agents. The notifier enables you to capture and filter events that occur to manage the behavior of your network. This is especially useful when an interface or routing protocol goes down and you want to get them back up and running as quickly as possible, preferably before anyone notices or complains. You can improve resolution time significantly by creating filters that focus on topics appropriate for a particular group of users. You can easily create filters around events related to BGP and MLAG session states, interfaces, links, NTP and other services, fans, power supplies, and physical sensor measurements.
For example, for operators responsible for routing, you can create an integration with a notification application that notifies them of routing issues as they occur. This is an example of a Slack message received on a netq-notifier channel indicating that the BGP session on switch leaf04 interface swp2 has gone down.
Timestamps in NetQ
Every event or entry in the NetQ database is stored with a timestamp of when the event was captured by the NetQ Agent on the switch or server. This timestamp is based on the switch or server time where the NetQ Agent is running, and is pushed in UTC format. It is important to ensure that all devices are NTP synchronized to prevent events from being displayed out of order or not displayed at all when looking for events that occurred at a particular time or within a time window.
Interface state, IP addresses, routes, ARP/ND table (IP neighbor) entries and MAC table entries carry a timestamp that represents the time the event happened (such as when a route is deleted or an interface comes up) - except the first time the NetQ agent is run. If the network has been running and stable when a NetQ agent is brought up for the first time, then this time reflects when the agent was started. Subsequent changes to these objects are captured with an accurate time of when the event happened.
Data that is captured and saved based on polling, and just about all other data in the NetQ database, including control plane state (such as BGP or MLAG), has a timestamp of when the information was captured rather than when the event actually happened, though NetQ compensates for this if the data extracted provides additional information to compute a more precise time of the event. For example, BGP uptime can be used to determine when the event actually happened in conjunction with the timestamp.
When retrieving the timestamp, command outputs display the time in three ways:
- For non-JSON output when the timestamp represents the Last Changed time, time is displayed in actual date and time when the time change occurred
- For non-JSON output when the timestamp represents an Uptime, time is displayed as days, hours, minutes, and seconds from the current time
- For JSON output, time is displayed in microseconds that have passed since the Epoch time (January 1, 1970 at 00:00:00 GMT)
This example shows the difference between the timestamp displays.
cumulus@switch:~$ netq show bgp
Matching bgp records:
Hostname          Neighbor                     VRF             ASN        Peer ASN   PfxRx        Last Changed
----------------- ---------------------------- --------------- ---------- ---------- ------------ -------------------------
exit-1            swp3(spine-1)                default         655537     655435     27/24/412    Fri Feb 15 17:20:00 2019
exit-1            swp3.2(spine-1)              DataVrf1080     655537     655435     14/12/0      Fri Feb 15 17:20:00 2019
exit-1            swp3.3(spine-1)              DataVrf1081     655537     655435     14/12/0      Fri Feb 15 17:20:00 2019
exit-1            swp3.4(spine-1)              DataVrf1082     655537     655435     14/12/0      Fri Feb 15 17:20:00 2019
exit-1            swp4(spine-2)                default         655537     655435     27/24/412    Fri Feb 15 17:20:00 2019
exit-1            swp4.2(spine-2)              DataVrf1080     655537     655435     14/12/0      Fri Feb 15 17:20:00 2019
exit-1            swp4.3(spine-2)              DataVrf1081     655537     655435     14/12/0      Fri Feb 15 17:20:00 2019
exit-1            swp4.4(spine-2)              DataVrf1082     655537     655435     13/12/0      Fri Feb 15 17:20:00 2019
...

cumulus@switch:~$ netq show agents
Matching agents records:
Hostname          Status           NTP Sync Version                              Sys Uptime                Agent Uptime              Reinitialize Time          Last Changed
----------------- ---------------- -------- ------------------------------------ ------------------------- ------------------------- -------------------------- -------------------------
border01          Fresh            yes      3.2.0-cl4u30~1601410518.104fb9ed     Mon Sep 21 17:04:54 2020  Tue Sep 29 21:24:58 2020  Tue Sep 29 21:24:58 2020   Thu Oct  1 16:07:38 2020
border02          Fresh            yes      3.2.0-cl4u30~1601410518.104fb9ed     Mon Sep 21 17:04:57 2020  Tue Sep 29 21:24:58 2020  Tue Sep 29 21:24:58 2020   Thu Oct  1 16:07:33 2020
fw1               Fresh            yes      3.2.0-cl4u30~1601410518.104fb9ed     Mon Sep 21 17:04:44 2020  Tue Sep 29 21:24:48 2020  Tue Sep 29 21:24:48 2020   Thu Oct  1 16:07:26 2020
fw2               Fresh            yes      3.2.0-cl4u30~1601410518.104fb9ed     Mon Sep 21 17:04:42 2020  Tue Sep 29 21:24:48 2020  Tue Sep 29 21:24:48 2020   Thu Oct  1 16:07:22 2020
leaf01            Fresh            yes      3.2.0-cl4u30~1601410518.104fb9ed     Mon Sep 21 16:49:04 2020  Tue Sep 29 21:24:49 2020  Tue Sep 29 21:24:49 2020   Thu Oct  1 16:07:10 2020
leaf02            Fresh            yes      3.2.0-cl4u30~1601410518.104fb9ed     Mon Sep 21 17:03:14 2020  Tue Sep 29 21:24:49 2020  Tue Sep 29 21:24:49 2020   Thu Oct  1 16:07:30 2020
leaf03            Fresh            yes      3.2.0-cl4u30~1601410518.104fb9ed     Mon Sep 21 17:03:37 2020  Tue Sep 29 21:24:49 2020  Tue Sep 29 21:24:49 2020   Thu Oct  1 16:07:24 2020
leaf04            Fresh            yes      3.2.0-cl4u30~1601410518.104fb9ed     Mon Sep 21 17:03:35 2020  Tue Sep 29 21:24:58 2020  Tue Sep 29 21:24:58 2020   Thu Oct  1 16:07:13 2020
oob-mgmt-server   Fresh            yes      3.1.1-ub18.04u29~1599111022.78b9e43  Mon Sep 21 16:43:58 2020  Mon Sep 21 17:55:00 2020  Mon Sep 21 17:55:00 2020   Thu Oct  1 16:07:31 2020
server01          Fresh            yes      3.2.0-ub18.04u30~1601393774.104fb9e  Mon Sep 21 17:19:57 2020  Tue Sep 29 21:13:07 2020  Tue Sep 29 21:13:07 2020   Thu Oct  1 16:07:16 2020
server02          Fresh            yes      3.2.0-ub18.04u30~1601393774.104fb9e  Mon Sep 21 17:19:57 2020  Tue Sep 29 21:13:07 2020  Tue Sep 29 21:13:07 2020   Thu Oct  1 16:07:24 2020
server03          Fresh            yes      3.2.0-ub18.04u30~1601393774.104fb9e  Mon Sep 21 17:19:56 2020  Tue Sep 29 21:13:07 2020  Tue Sep 29 21:13:07 2020   Thu Oct  1 16:07:12 2020
server04          Fresh            yes      3.2.0-ub18.04u30~1601393774.104fb9e  Mon Sep 21 17:19:57 2020  Tue Sep 29 21:13:07 2020  Tue Sep 29 21:13:07 2020   Thu Oct  1 16:07:17 2020
server05          Fresh            yes      3.2.0-ub18.04u30~1601393774.104fb9e  Mon Sep 21 17:19:57 2020  Tue Sep 29 21:13:10 2020  Tue Sep 29 21:13:10 2020   Thu Oct  1 16:07:25 2020
server06          Fresh            yes      3.2.0-ub18.04u30~1601393774.104fb9e  Mon Sep 21 17:19:57 2020  Tue Sep 29 21:13:10 2020  Tue Sep 29 21:13:10 2020   Thu Oct  1 16:07:21 2020
server07          Fresh            yes      3.2.0-ub18.04u30~1601393774.104fb9e  Mon Sep 21 17:06:48 2020  Tue Sep 29 21:13:10 2020  Tue Sep 29 21:13:10 2020   Thu Oct  1 16:07:28 2020
server08          Fresh            yes      3.2.0-ub18.04u30~1601393774.104fb9e  Mon Sep 21 17:06:45 2020  Tue Sep 29 21:13:10 2020  Tue Sep 29 21:13:10 2020   Thu Oct  1 16:07:31 2020
spine01           Fresh            yes      3.2.0-cl4u30~1601410518.104fb9ed     Mon Sep 21 17:03:34 2020  Tue Sep 29 21:24:58 2020  Tue Sep 29 21:24:58 2020   Thu Oct  1 16:07:20 2020
spine02           Fresh            yes      3.2.0-cl4u30~1601410518.104fb9ed     Mon Sep 21 17:03:33 2020  Tue Sep 29 21:24:58 2020  Tue Sep 29 21:24:58 2020   Thu Oct  1 16:07:16 2020
spine03           Fresh            yes      3.2.0-cl4u30~1601410518.104fb9ed     Mon Sep 21 17:03:34 2020  Tue Sep 29 21:25:07 2020  Tue Sep 29 21:25:07 2020   Thu Oct  1 16:07:20 2020
spine04           Fresh            yes      3.2.0-cl4u30~1601410518.104fb9ed     Mon Sep 21 17:03:32 2020  Tue Sep 29 21:25:07 2020  Tue Sep 29 21:25:07 2020   Thu Oct  1 16:07:33 2020

cumulus@switch:~$ netq show agents json
{
    "agents":[
        {
            "hostname":"border01",
            "status":"Fresh",
            "ntpSync":"yes",
            "version":"3.2.0-cl4u30~1601410518.104fb9ed",
            "sysUptime":1600707894.0,
            "agentUptime":1601414698.0,
            "reinitializeTime":1601414698.0,
            "lastChanged":1601568519.0
        },
        {
            "hostname":"border02",
            "status":"Fresh",
            "ntpSync":"yes",
            "version":"3.2.0-cl4u30~1601410518.104fb9ed",
            "sysUptime":1600707897.0,
            "agentUptime":1601414698.0,
            "reinitializeTime":1601414698.0,
            "lastChanged":1601568515.0
        },
        {
            "hostname":"fw1",
            "status":"Fresh",
            "ntpSync":"yes",
            "version":"3.2.0-cl4u30~1601410518.104fb9ed",
            "sysUptime":1600707884.0,
            "agentUptime":1601414688.0,
            "reinitializeTime":1601414688.0,
            "lastChanged":1601568506.0
        },
        {
            "hostname":"fw2",
            "status":"Fresh",
            "ntpSync":"yes",
            "version":"3.2.0-cl4u30~1601410518.104fb9ed",
            "sysUptime":1600707882.0,
            "agentUptime":1601414688.0,
            "reinitializeTime":1601414688.0,
            "lastChanged":1601568503.0
        },
        {
            "hostname":"leaf01",
            "status":"Fresh",
            "ntpSync":"yes",
            "version":"3.2.0-cl4u30~1601410518.104fb9ed",
            "sysUptime":1600706944.0,
            "agentUptime":1601414689.0,
            "reinitializeTime":1601414689.0,
            "lastChanged":1601568522.0
        },
        {
            "hostname":"leaf02",
            "status":"Fresh",
            "ntpSync":"yes",
            "version":"3.2.0-cl4u30~1601410518.104fb9ed",
            "sysUptime":1600707794.0,
            "agentUptime":1601414689.0,
            "reinitializeTime":1601414689.0,
            "lastChanged":1601568512.0
        },
        {
            "hostname":"leaf03",
            "status":"Fresh",
            "ntpSync":"yes",
            "version":"3.2.0-cl4u30~1601410518.104fb9ed",
            "sysUptime":1600707817.0,
            "agentUptime":1601414689.0,
            "reinitializeTime":1601414689.0,
            "lastChanged":1601568505.0
        },
        {
            "hostname":"leaf04",
            "status":"Fresh",
            "ntpSync":"yes",
            "version":"3.2.0-cl4u30~1601410518.104fb9ed",
            "sysUptime":1600707815.0,
            "agentUptime":1601414698.0,
            "reinitializeTime":1601414698.0,
            "lastChanged":1601568525.0
        },
        {
            "hostname":"oob-mgmt-server",
            "status":"Fresh",
            "ntpSync":"yes",
            "version":"3.1.1-ub18.04u29~1599111022.78b9e43",
            "sysUptime":1600706638.0,
            "agentUptime":1600710900.0,
            "reinitializeTime":1600710900.0,
            "lastChanged":1601568511.0
        },
        {
            "hostname":"server01",
            "status":"Fresh",
            "ntpSync":"yes",
            "version":"3.2.0-ub18.04u30~1601393774.104fb9e",
            "sysUptime":1600708797.0,
            "agentUptime":1601413987.0,
            "reinitializeTime":1601413987.0,
            "lastChanged":1601568527.0
        },
        {
            "hostname":"server02",
            "status":"Fresh",
            "ntpSync":"yes",
            "version":"3.2.0-ub18.04u30~1601393774.104fb9e",
            "sysUptime":1600708797.0,
            "agentUptime":1601413987.0,
            "reinitializeTime":1601413987.0,
            "lastChanged":1601568504.0
        },
        {
            "hostname":"server03",
            "status":"Fresh",
            "ntpSync":"yes",
            "version":"3.2.0-ub18.04u30~1601393774.104fb9e",
            "sysUptime":1600708796.0,
            "agentUptime":1601413987.0,
            "reinitializeTime":1601413987.0,
            "lastChanged":1601568522.0
        },
        {
            "hostname":"server04",
            "status":"Fresh",
            "ntpSync":"yes",
            "version":"3.2.0-ub18.04u30~1601393774.104fb9e",
            "sysUptime":1600708797.0,
            "agentUptime":1601413987.0,
            "reinitializeTime":1601413987.0,
            "lastChanged":1601568497.0
        },
        {
            "hostname":"server05",
            "status":"Fresh",
            "ntpSync":"yes",
            "version":"3.2.0-ub18.04u30~1601393774.104fb9e",
            "sysUptime":1600708797.0,
            "agentUptime":1601413990.0,
            "reinitializeTime":1601413990.0,
            "lastChanged":1601568506.0
        },
        {
            "hostname":"server06",
            "status":"Fresh",
            "ntpSync":"yes",
            "version":"3.2.0-ub18.04u30~1601393774.104fb9e",
            "sysUptime":1600708797.0,
            "agentUptime":1601413990.0,
            "reinitializeTime":1601413990.0,
            "lastChanged":1601568501.0
        },
        {
            "hostname":"server07",
            "status":"Fresh",
            "ntpSync":"yes",
            "version":"3.2.0-ub18.04u30~1601393774.104fb9e",
            "sysUptime":1600708008.0,
            "agentUptime":1601413990.0,
            "reinitializeTime":1601413990.0,
            "lastChanged":1601568508.0
        },
        {
            "hostname":"server08",
            "status":"Fresh",
            "ntpSync":"yes",
            "version":"3.2.0-ub18.04u30~1601393774.104fb9e",
            "sysUptime":1600708005.0,
            "agentUptime":1601413990.0,
            "reinitializeTime":1601413990.0,
            "lastChanged":1601568511.0
        },
        {
            "hostname":"spine01",
            "status":"Fresh",
            "ntpSync":"yes",
            "version":"3.2.0-cl4u30~1601410518.104fb9ed",
            "sysUptime":1600707814.0,
            "agentUptime":1601414698.0,
            "reinitializeTime":1601414698.0,
            "lastChanged":1601568502.0
        },
        {
            "hostname":"spine02",
            "status":"Fresh",
            "ntpSync":"yes",
            "version":"3.2.0-cl4u30~1601410518.104fb9ed",
            "sysUptime":1600707813.0,
            "agentUptime":1601414698.0,
            "reinitializeTime":1601414698.0,
            "lastChanged":1601568497.0
        },
        {
            "hostname":"spine03",
            "status":"Fresh",
            "ntpSync":"yes",
            "version":"3.2.0-cl4u30~1601410518.104fb9ed",
            "sysUptime":1600707814.0,
            "agentUptime":1601414707.0,
            "reinitializeTime":1601414707.0,
            "lastChanged":1601568501.0
        },
        {
            "hostname":"spine04",
            "status":"Fresh",
            "ntpSync":"yes",
            "version":"3.2.0-cl4u30~1601410518.104fb9ed",
            "sysUptime":1600707812.0,
            "agentUptime":1601414707.0,
            "reinitializeTime":1601414707.0,
            "lastChanged":1601568514.0
        }
    ],
    "truncatedResult":false
}
Restarting a NetQ Agent on a device does not update the timestamps for existing objects to reflect this new restart time. NetQ preserves their timestamps relative to the original start time of the Agent. A rare exception is if you reboot the device between the time it takes the Agent to stop and restart; in this case, the time is still relative to the start time of the Agent.
Exporting NetQ Data
You can export data from the NetQ Platform in a couple of ways:
- Use the
jsonoption to output command results to JSON format for parsing in other applications - Use the UI to export data from the full screen cards
Example Using the CLI
You can check the state of BGP on your network with netq check bgp:
cumulus@leaf01:~$ netq check bgp
Total Nodes: 25, Failed Nodes: 3, Total Sessions: 220 , Failed Sessions: 24,
Hostname          VRF             Peer Name         Peer Hostname     Reason                                        Last Changed
----------------- --------------- ----------------- ----------------- --------------------------------------------- -------------------------
exit01            DataVrf1080     swp6.2            firewall01        BGP session with peer firewall01 swp6.2: AFI/ Tue Feb 12 18:11:16 2019
                                                                      SAFI evpn not activated on peer
exit01            DataVrf1080     swp7.2            firewall02        BGP session with peer firewall02 (swp7.2 vrf  Tue Feb 12 18:11:27 2019
                                                                      DataVrf1080) failed,
                                                                      reason: Peer not configured
exit01            DataVrf1081     swp6.3            firewall01        BGP session with peer firewall01 swp6.3: AFI/ Tue Feb 12 18:11:16 2019
                                                                      SAFI evpn not activated on peer
exit01            DataVrf1081     swp7.3            firewall02        BGP session with peer firewall02 (swp7.3 vrf  Tue Feb 12 18:11:27 2019
                                                                      DataVrf1081) failed,
                                                                      reason: Peer not configured
...
When you show the output in JSON format, this same command looks like this:
cumulus@leaf01:~$ netq check bgp json
{
    "failedNodes":[
        {
            "peerHostname":"firewall01",
            "lastChanged":1549995080.0,
            "hostname":"exit01",
            "peerName":"swp6.2",
            "reason":"BGP session with peer firewall01 swp6.2: AFI/SAFI evpn not activated on peer",
            "vrf":"DataVrf1080"
        },
        {
            "peerHostname":"firewall02",
            "lastChanged":1549995449.7279999256,
            "hostname":"exit01",
            "peerName":"swp7.2",
            "reason":"BGP session with peer firewall02 (swp7.2 vrf DataVrf1080) failed, reason: Peer not configured",
            "vrf":"DataVrf1080"
        },
        {
            "peerHostname":"firewall01",
            "lastChanged":1549995080.0,
            "hostname":"exit01",
            "peerName":"swp6.3",
            "reason":"BGP session with peer firewall01 swp6.3: AFI/SAFI evpn not activated on peer",
            "vrf":"DataVrf1081"
        },
        {
            "peerHostname":"firewall02",
            "lastChanged":1549995449.7349998951,
            "hostname":"exit01",
            "peerName":"swp7.3",
            "reason":"BGP session with peer firewall02 (swp7.3 vrf DataVrf1081) failed, reason: Peer not configured",
            "vrf":"DataVrf1081"
        },
...

    ],
    "summary": {
        "checkedNodeCount": 25,
        "failedSessionCount": 24,
        "failedNodeCount": 3,
        "totalSessionCount": 220
    }
}
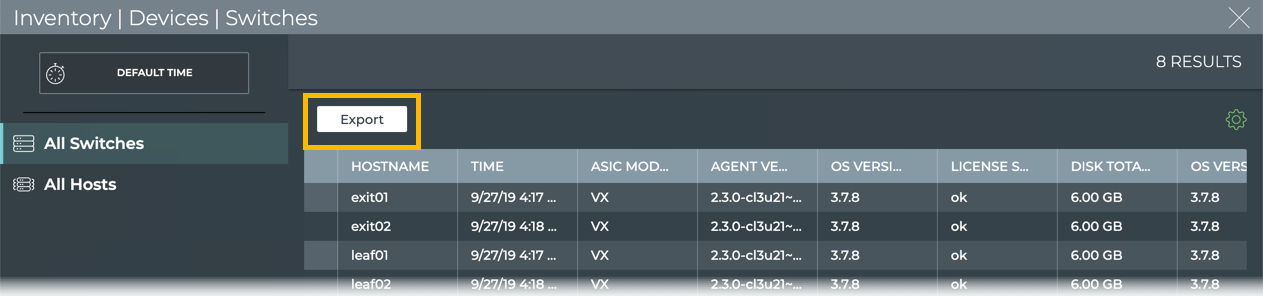
Example Using the UI
Open the full screen Switch Inventory card, select the data to export, and click Export.
Important File Locations
To aid in troubleshooting issues with NetQ, the following configuration and log files can provide insight into root causes of issues:
| File | Description |
|---|---|
/etc/netq/netq.yml | The NetQ configuration file. This file appears only if you installed either the netq-apps package or the NetQ Agent on the system. |
/var/log/netqd.log | The NetQ daemon log file for the NetQ CLI. This log file appears only if you installed the netq-apps package on the system. |
/var/log/netq-agent.log | The NetQ Agent log file. This log file appears only if you installed the NetQ Agent on the system. |