Access Data with Cards
Cards present information about your network for monitoring and troubleshooting. This is where you can expect to spend most of your time. Each card describes a particular aspect of the network. Cards are available in multiple sizes, from small to full screen. The level of the content on a card varies with the size of the card, with the highest level of information on the smallest card to the most detailed information on the full-screen card. Cards are collected onto a workbench where you see all the data relevant to a task or set of tasks. You can add and remove cards from a workbench, move between cards and card sizes, change the time period of the data shown on a card, and make copies of cards to show different levels of data at the same time.
Card Sizes
The various sizes of cards enable you to view your content at just the right level. For each aspect that you are monitoring there is typically a single card that presents increasing amounts of data over its four sizes. For example, a snapshot of your total inventory might be sufficient, but to monitor the distribution of hardware vendors might require a bit more space.
Card Size Summary
| Card Size | Small | Medium | Large | Full Screen |
|---|---|---|---|---|
| Primary Purpose |
|
|
|
|
Small Cards
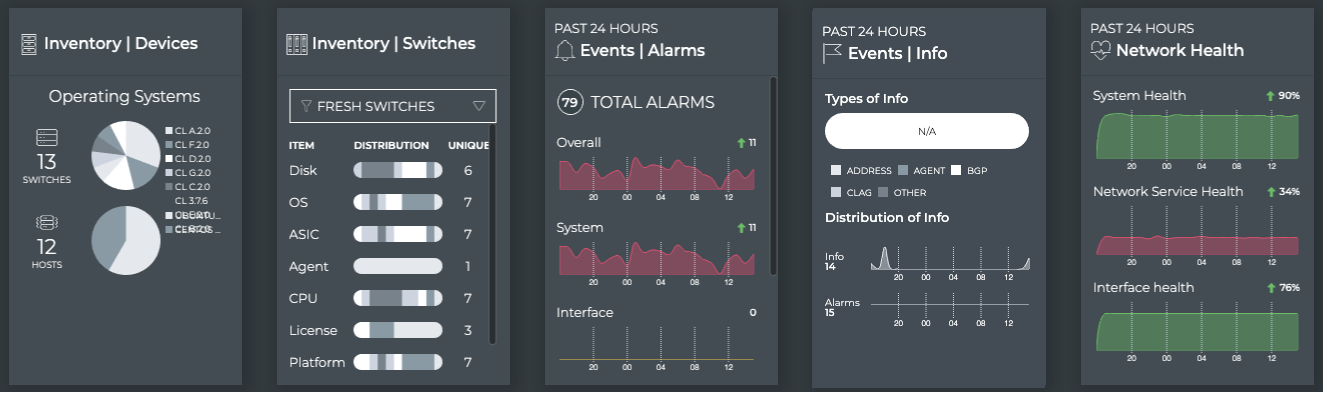
Small cards are most effective at providing a quick view of the performance or statistical value of a given aspect of your network. They commonly comprise an icon to identify the aspect being monitored, summary performance or statistics in the form of a graph and/or counts, and often an indication of any related events. Other content items might be present. Some examples include a Devices Inventory card, a Switch Inventory card, an Alarm Events card, an Info Events card, and a Network Health card, as shown here:

Medium Cards
Medium cards are most effective at providing the key measurements for a given aspect of your network. They are commonly comprised of an icon to identify the aspect being monitored, one or more key measurements that make up the overall performance. Often additional information is also included, such as related events or components. Some examples include a Devices Inventory card, a Switch Inventory card, an Alarm Events card, an Info Events card, and a Network Health card, as shown here. Compare these with their related small- and large-sized cards.
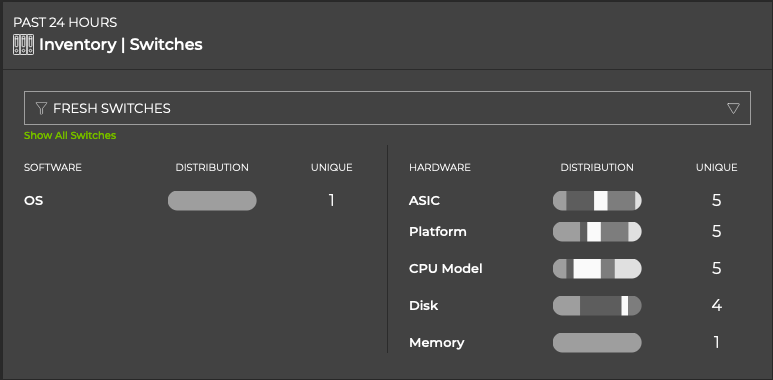
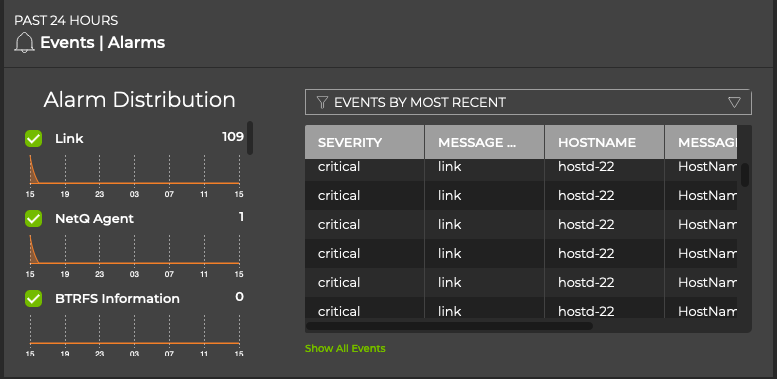
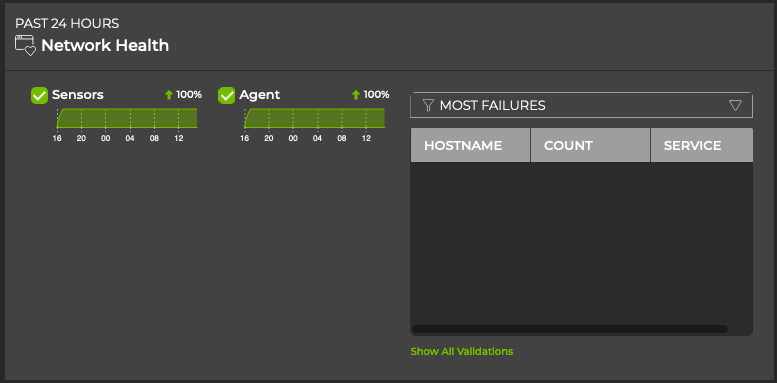
Large Cards
Large cards are most effective at providing the detailed information for monitoring specific components or functions of a given aspect of your network. These can aid in isolating and resolving existing issues or preventing potential issues. They are commonly comprised of detailed statistics and graphics. Some large cards also have tabs for additional detail about a given statistic or other related information. Some examples include a Devices Inventory card, an Alarm Events card, and a Network Health card, as shown here. Compare these with their related small- and medium-sized cards.
Full-Screen Cards
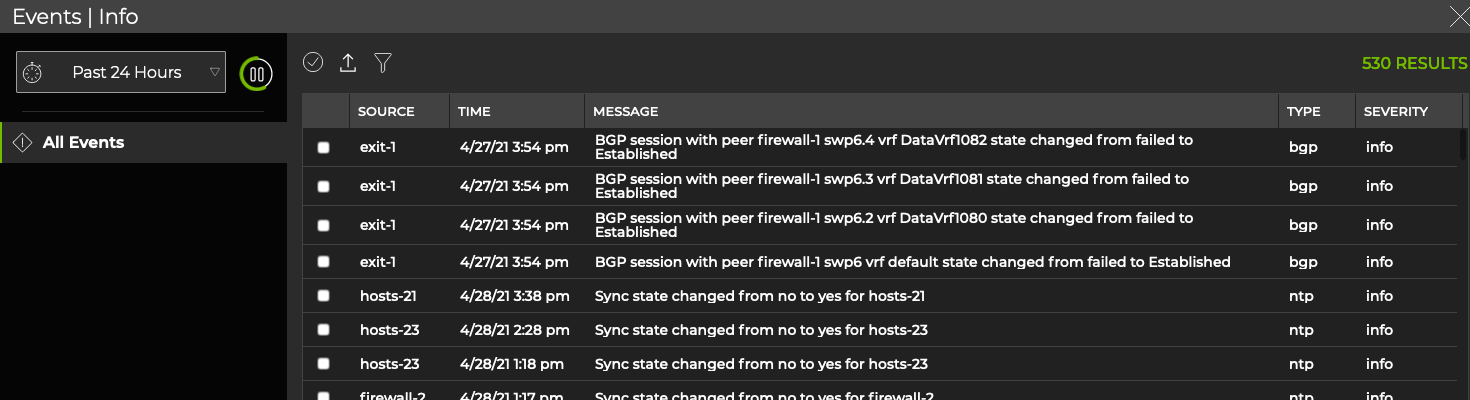
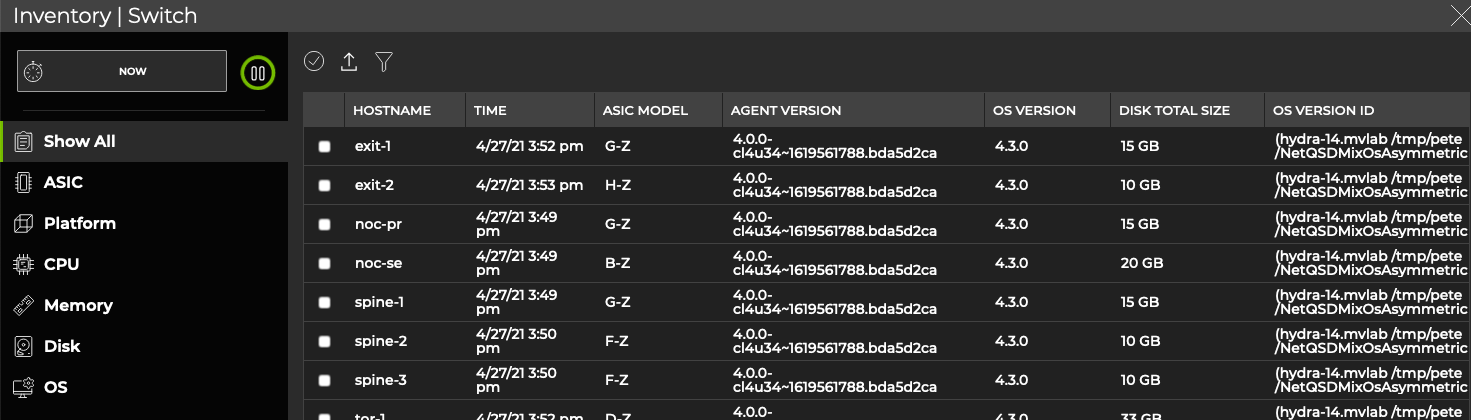
Full-screen cards are most effective for viewing all available data about an aspect of your network all in one place. When you cannot find what you need in the small, medium, or large cards, it is likely on the full-screen card. Most full-screen cards display data in a grid, or table; however, some contain visualizations. Some examples include All Events card and All Switches card, as shown here.
Card Workflows
The UI provides a number of card workflows. Card workflows focus on a particular aspect of your network and are a linked set of each size card — a small card, a medium card, one or more large cards, and one or more full screen cards. The following card workflows are available:
- Network Health: networkwide view of network health
- Devices|Switches: health of a given switch
- Inventory|Devices: information about all switches and hosts in the network
- Inventory|Switches: information about the components on a given switch
- Events|Alarms: information about all critical severity events in the system
- Events|Info: information about all warning, info, and debug events in the system
- Network Services: information about the network services and sessions
- Validation Request (and Results): networkwide validation of network protocols and services
- Trace Request (and Results): find available paths between two devices in the network fabric
- Network Snapshot: view and compare the network state at various times
Access a Card Workflow
You can access a card workflow in multiple ways:
- For workbenches available from the main menu, open the workbench that contains the card flow
- Open a prior search
- Add it to a workbench
- Search for it
If you have multiple cards open on your workbench already, you might need to scroll down to see the card you have just added.
To open the card workflow through an existing workbench:
Click
 in the workbench task bar.
Select the relevant workbench.
The workbench opens, hiding your previous workbench.
To open the card workflow from Recent Actions:
Click
 in the application header.
Look for an “Add: <card name>” item.
If it is still available, click the item.
The card appears on the current workbench, at the bottom.
To access the card workflow by adding the card:
Click
 in the workbench task bar.
Follow the instructions in Add Cards to Your Workbench or Add Switch Cards to Your Workbench.
The card appears on the current workbench, at the bottom.
To access the card workflow by searching for the card:
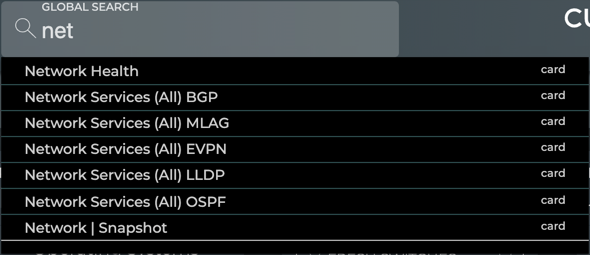
Click in the Global Search field.
Begin typing the name of the card.
Select it from the list.
The card appears on a current workbench, at the bottom.
Card Interactions
Every card contains a standard set of interactions, including the ability to switch between card sizes, and change the time period of the presented data. Most cards also have additional actions that can be taken, in the form of links to other cards, scrolling, and so forth. The four sizes of cards for a particular aspect of the network are connected into a flow; however, you can have duplicate cards displayed at the different sizes. Cards with tabular data provide filtering, sorting, and export of data. The medium and large cards have descriptive text on the back of the cards.
To access the time period, card size, and additional actions, hover over the card. These options appear, covering the card header, enabling you to select the desired option.
Add Cards to Your Workbench
You can add one or more cards to a workbench at any time. To add Devices|Switches cards, refer to Add Switch Cards to Your Workbench. For all other cards, follow the steps in this section.
To add one or more cards:
Click
to open the Cards modal.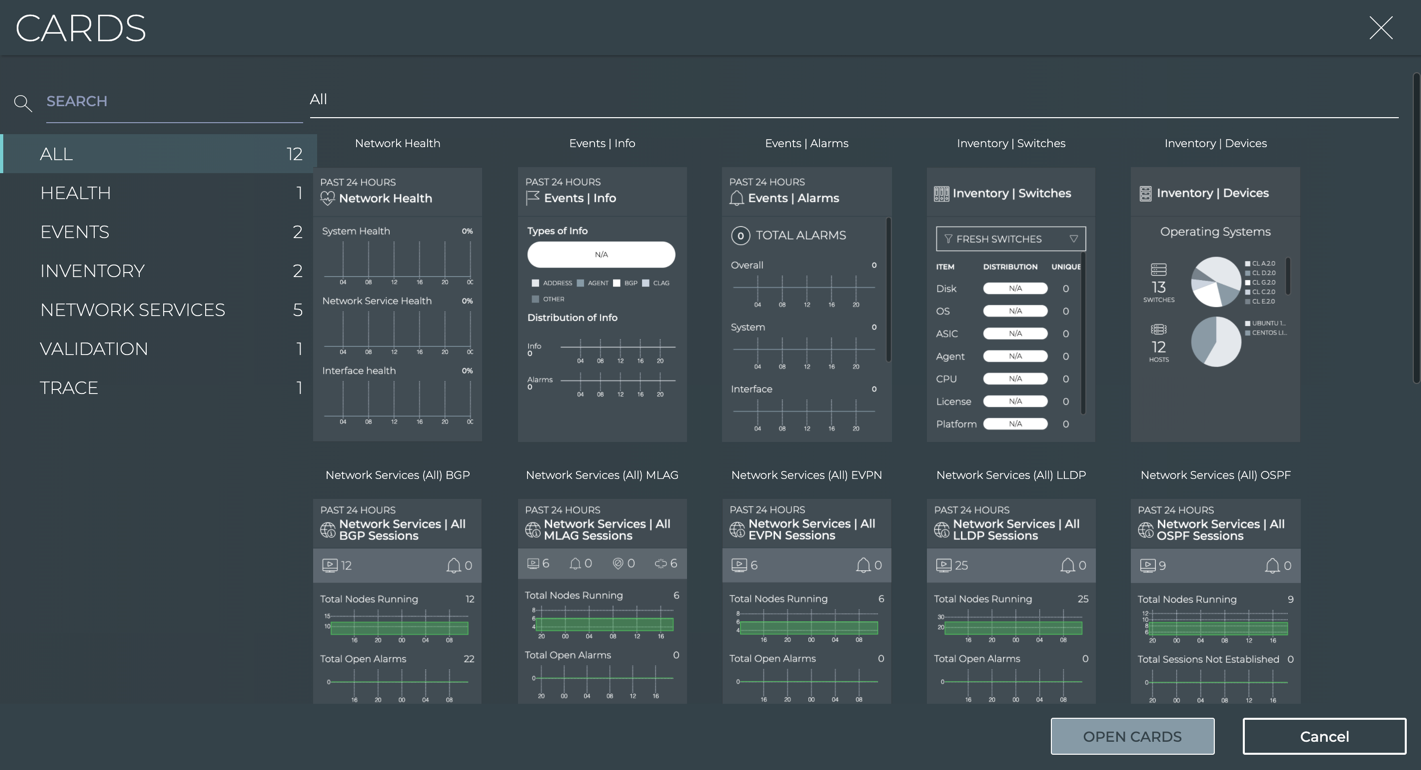
Scroll down until you find the card you want to add, select the category of cards, or use Search to find the card you want to add.
This example uses the category tab to narrow the search for a card.
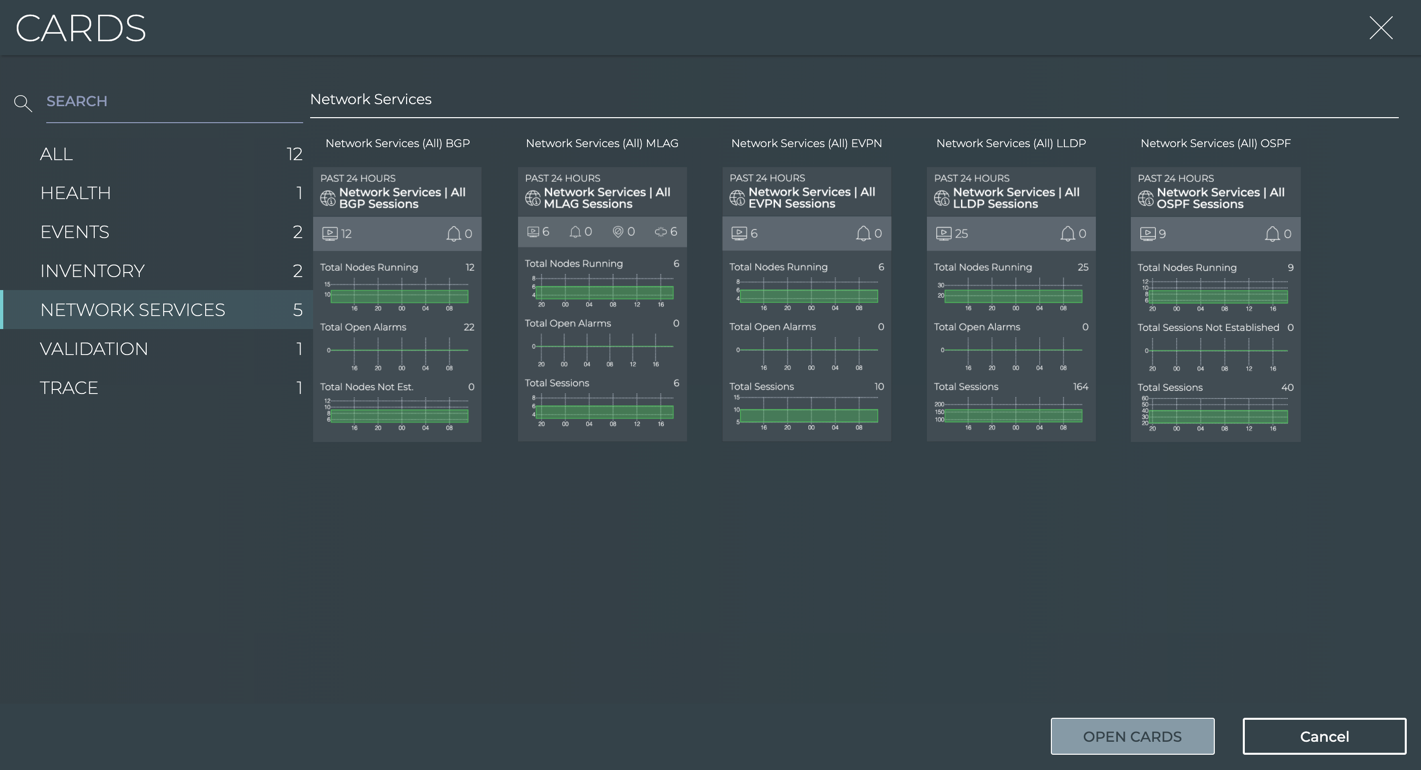
Click on each card you want to add.
As you select each card, it is grayed out and a
 appears on top of it. If you have selected one or more cards using the category option, you can selected another category without losing your current selection. Note that the total number of cards selected for addition to your workbench is noted at the bottom.
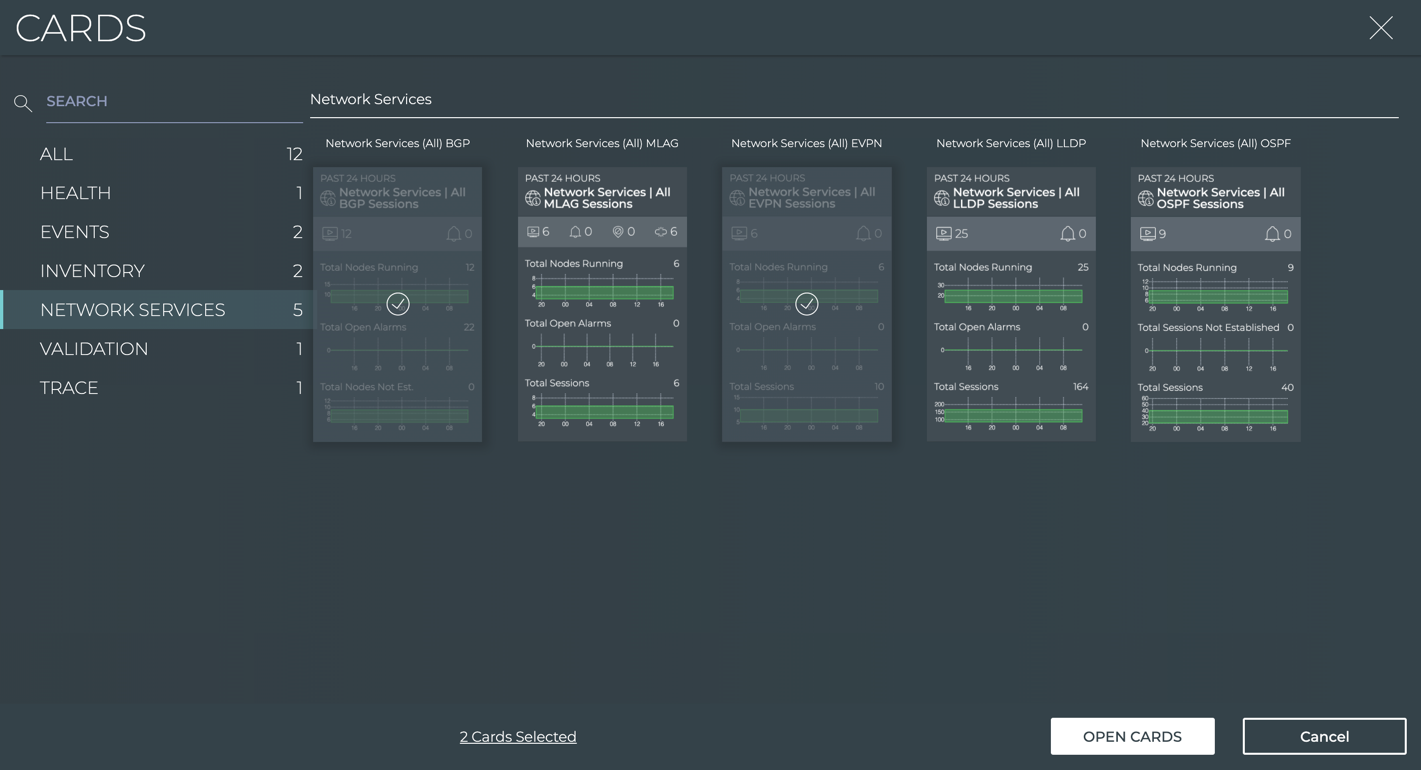
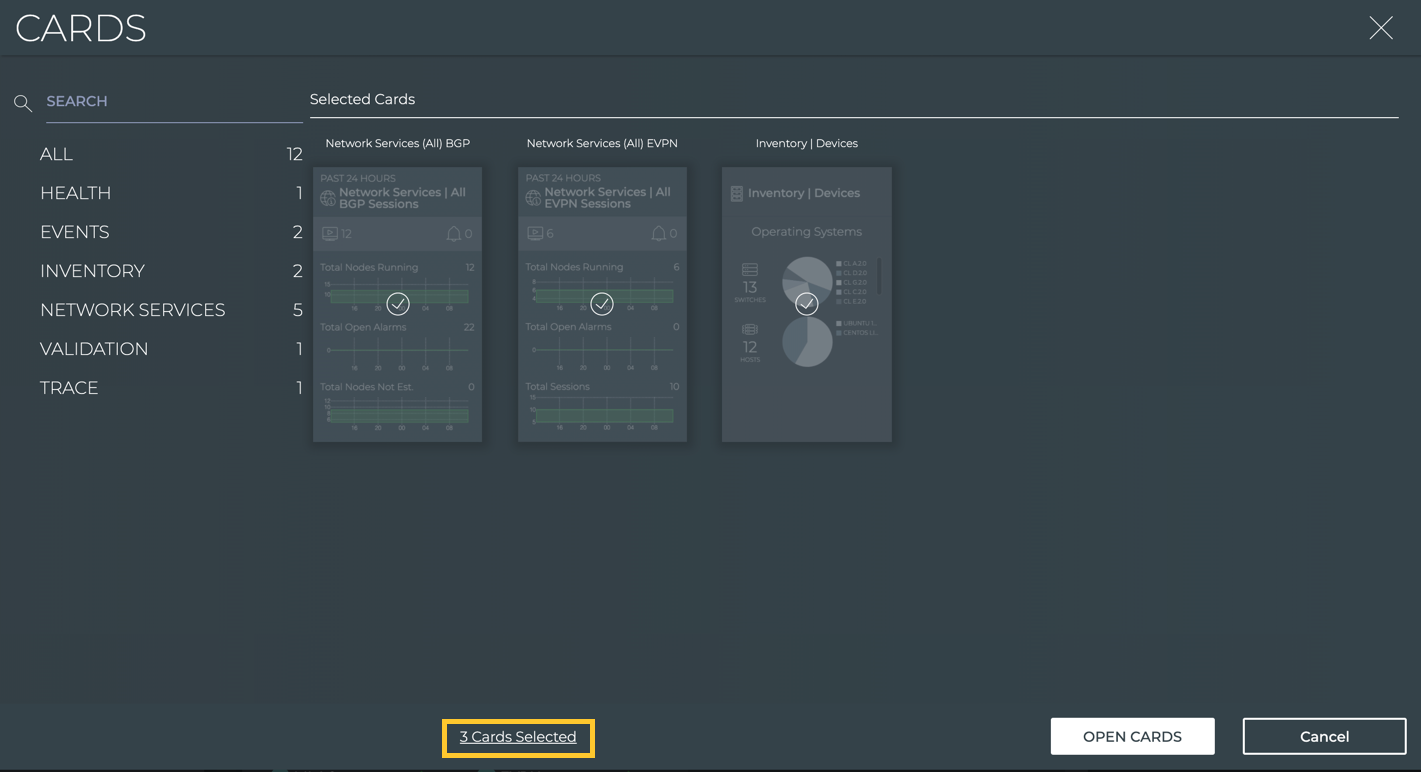
Also note that if you change your mind and do not want to add a particular card you have selected, simply click on it again to remove it from the cards to be added. Note the total number of cards selected decreases with each card you remove.
When you have selected all of the cards you want to add to your workbench, you can confirm which cards have been selected by clicking the Cards Selected link. Modify your selection as needed.
Click Open Cards to add the selected cards, or Cancel to return to your workbench without adding any cards.
The cards are placed at the end of the set of cards currently on the workbench. You might need to scroll down to see them. By default, the medium size of the card is added to your workbench for all except the Validation and Trace cards. These are added in the large size by default. You can rearrange the cards as described in Reposition a Card on Your Workbench.
Add Switch Cards to Your Workbench
You can add switch cards to a workbench at any time. For all other cards, follow the steps in Add Cards to Your Workbench. You can either add the card through the Switches icon on a workbench header or by searching for it through Global Search.
To add a switch card using the icon:
Click
 , then select Open a switch card to open the Open Switch Card modal.
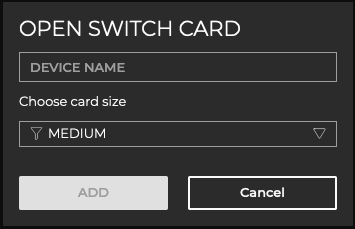
Begin entering the hostname of the switch you want to monitor.
Select the device from the suggestions that appear.
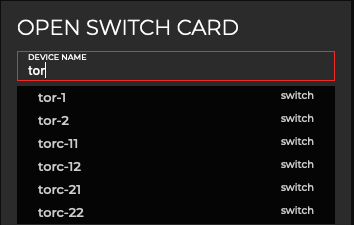
If you attempt to enter a hostname that is unknown to NetQ, a red border appears around the entry field and you are unable to select Add. Try checking for spelling errors. If you feel your entry is valid, but not an available choice, consult with your network administrator.
Optionally select the small or large size to display instead of the medium size.
Click Add to add the switch card to your workbench, or Cancel to return to your workbench without adding the switch card.
To open the switch card by searching:
Click in Global Search.
Begin typing the name of a switch.
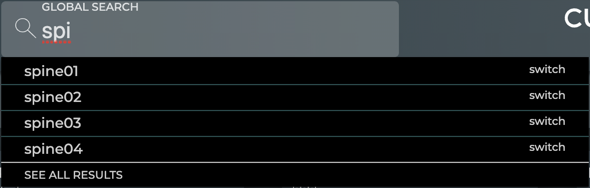
Select it from the options that appear.
Remove Cards from Your Workbench
Removing cards is handled one card at a time.
To remove a card:
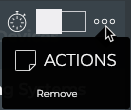
Hover over the card you want to remove.
Click
 (More Actions menu).
Click Remove.
The card is removed from the workbench, but not from the application.
Change the Time Period for the Card Data
All cards have a default time period for the data shown on the card, typically the last 24 hours. You can change the time period to view the data during a different time range to aid analysis of previous or existing issues.
To change the time period for a card:
Hover over any card.
Click
 in the header.
Select a time period from the dropdown list.
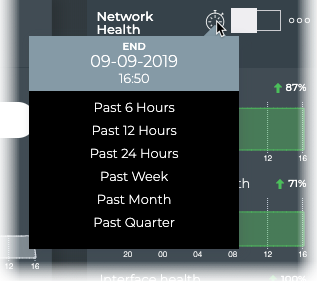
Changing the time period in this manner only changes the time period for the given card.
Switch to a Different Card Size
You can switch between the different card sizes at any time. Only one size is visible at a time. To view the same card in different sizes, open a second copy of the card.
To change the card size:
Hover over the card.
Hover over the Card Size Picker and move the cursor to the right or left until the desired size option is highlighted.
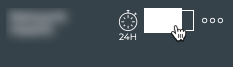
One-quarter width opens a small card. One-half width opens a medium card. Three-quarters width opens a large card. Full width opens a full-screen card.
Click the Picker. The card changes to the selected size, and might move its location on the workbench.
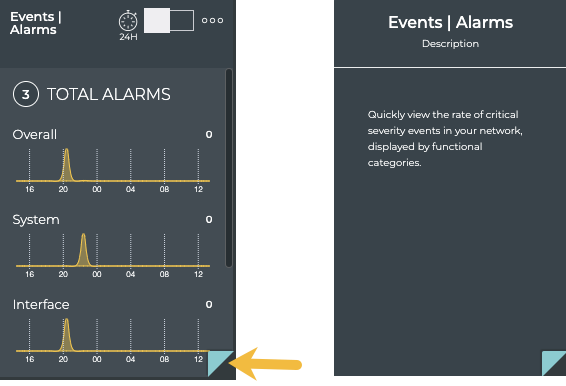
View a Description of the Card Content
When you hover over a medium or large card, the bottom right corner turns up and is highlighted. Clicking the corner turns the card over where a description of the card and any relevant tabs are described. Hover and click the corner again to turn it back to the front side.
Reposition a Card on Your Workbench
You can move cards around on the workbench.
Click and drag the card to the left, right, above, or below another card, to where you want to place the card.
Release your hold on the card when the other card becomes highlighted with a dotted line.
Table Settings
You can manipulate the data in a data grid in a full-screen card in several ways. The available options are displayed above each table. The options vary depending on the card and what is selected in the table.
| Icon | Action | Description |
|---|---|---|
| Select All | Selects all items in the list. | |
| Clear All | Clears all existing selections in the list. | |
| Add Item | Adds item to the list. | |
| Edit | Edits the selected item. | |
| Delete | Removes the selected items. | |
| Filter | Filters the list using available parameters. Refer to Filter Table Data for more detail. | |
| Generate/Delete AuthKeys | Creates or removes NetQ CLI authorization keys. | |
| Open Cards | Opens the corresponding validation or trace card(s). | |
| Assign role | Opens role assignment options for switches. | |
| Export | Exports selected data into either a .csv or JSON-formatted file. Refer to Export Data for more detail. |
When there are numerous items in a table, NetQ loads up to 25 by default and provides the rest in additional table pages. In this case, pagination is shown under the table.
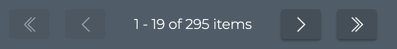
From there, you can:
- View the total number of items in the list
- Move forward or backward one page at a time (
 ,
,  )
) - Go to the first or last page in the list (
 ,
,  )
)
Change Order of Columns
You can rearrange the columns within a table. Click and hold on a column header, then drag it to the location where you want it.
Sort Table Data by Column
You can sort tables (with up to 10,000 rows) by a given column for tables on full-screen cards. The data is sorted in ascending or descending order; A to Z, Z to A, 1 to n, or n to 1.
To sort table data by column:
Open a full-screen card.
Hover over a column header.
Click the header to toggle between ascending and descending sort order.
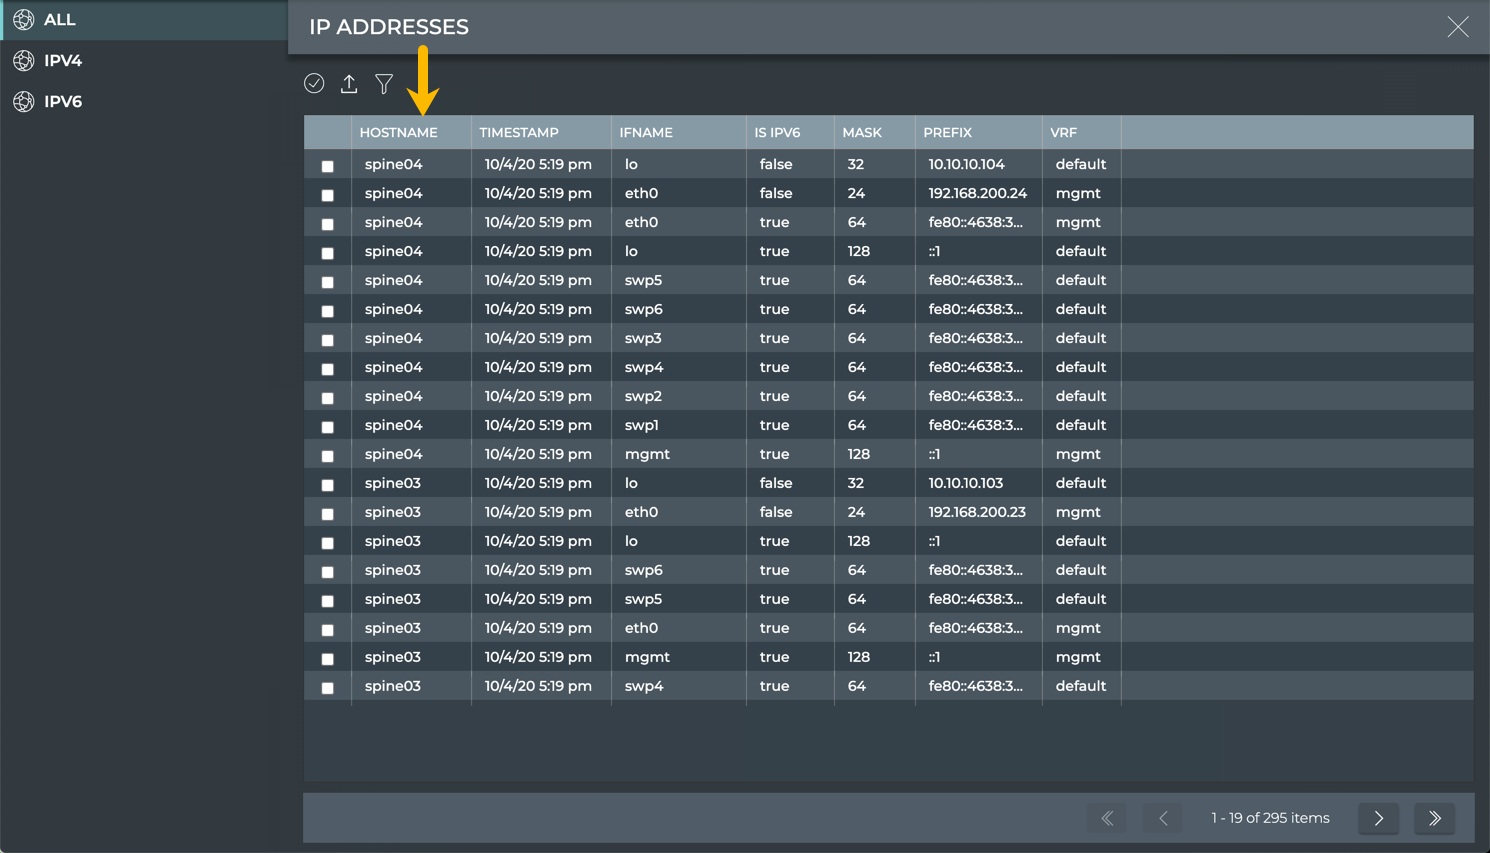
For example, this IP Addresses table is sorted by hostname in a descending order. Click the Hostname header to sort the data in ascending order. Click the IfName header to sort the same table by interface name.

Sorted by descending hostname
Sorted by ascending hostname
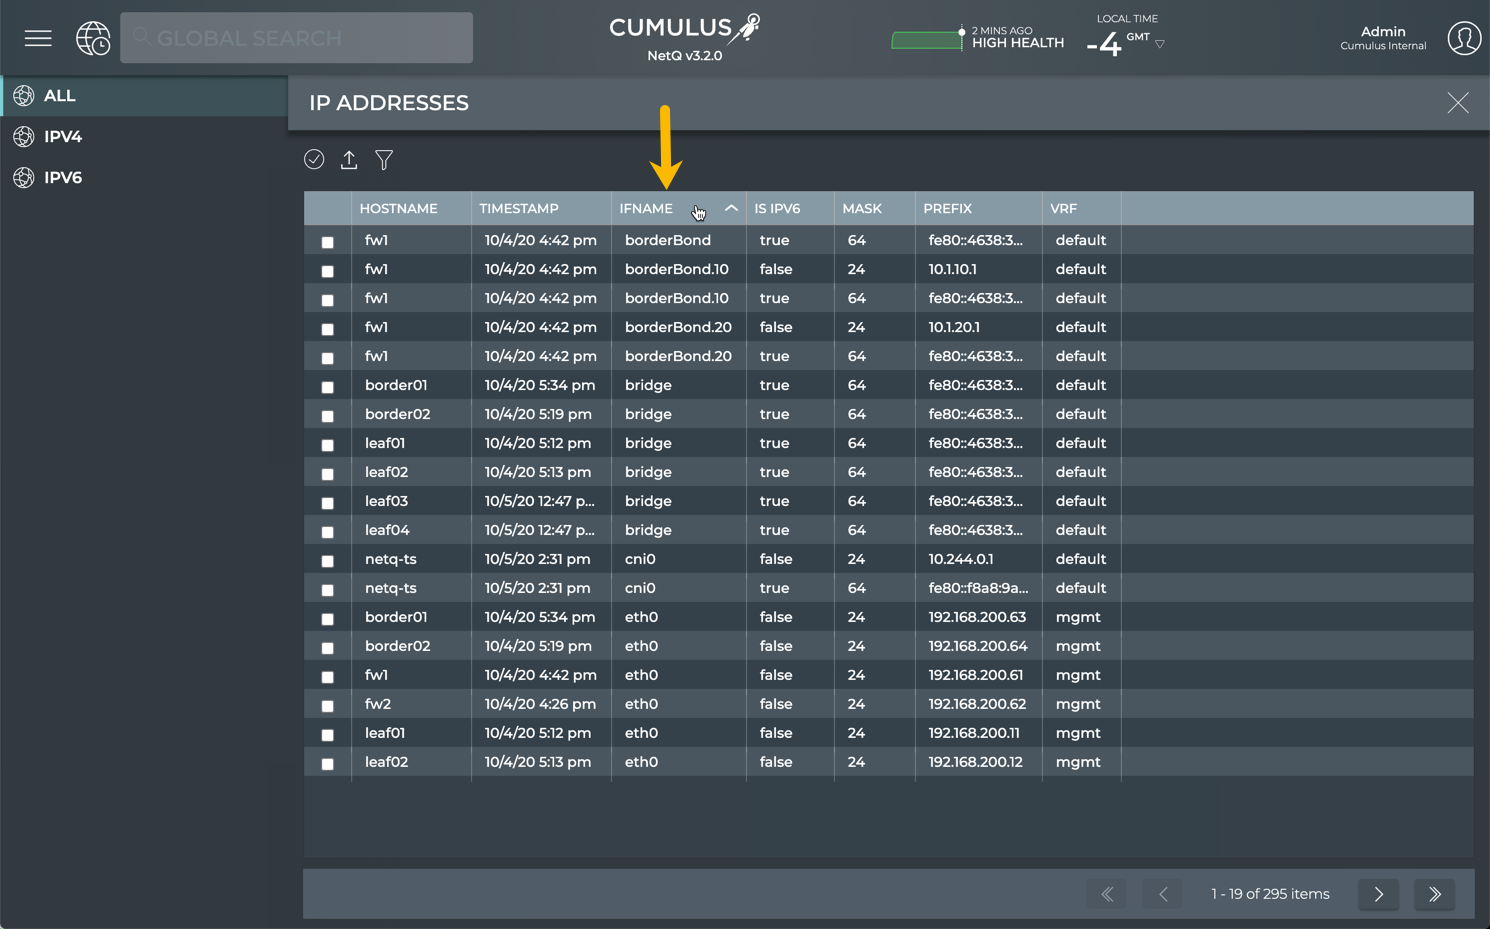
Sorted by descending interface name
Filter Table Data
The filter option associated with tables on full-screen cards can be used to filter the data by any parameter (column name). The parameters available vary according to the table you are viewing. Some tables offer the ability to filter on more than one parameter.
Some tables only allow a single filter to be applied; you select the parameter and set the value. You can use partial values.
For example, to set the filter to show only BGP sessions using a particular VRF:
Open the full-screen Network Services | All BGP Sessions card.
Click the All Sessions tab.
Click
 above the table.
Select VRF from the Field dropdown.
Enter the name of the VRF of interest. In our example, we chose vrf1.
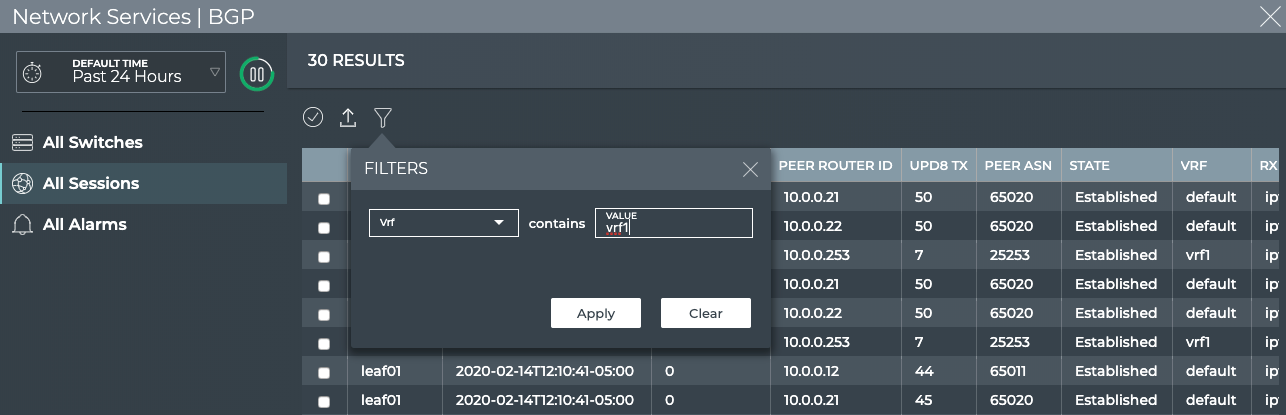
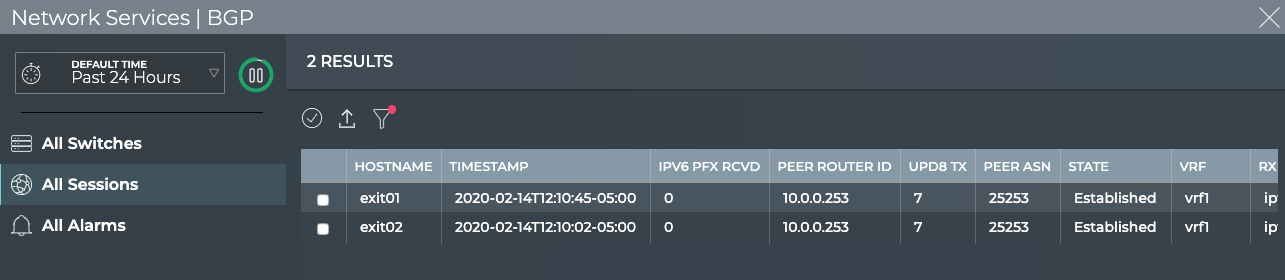
Click Apply.
The filter icon displays a red dot to indicate filters are applied.
To remove the filter, click
(with the red dot).Click Clear.
Close the Filters dialog by clicking
 .
.
Filter Table Data with Multiple Filters
Some tables offer filtering by multiple parameters. In such cases, the Filter dialog is slightly different. For example, to filter the list of IP addresses in your system by hostname and interface:
Click
 .
.Select IP Addresses under Network.
Click
above the table.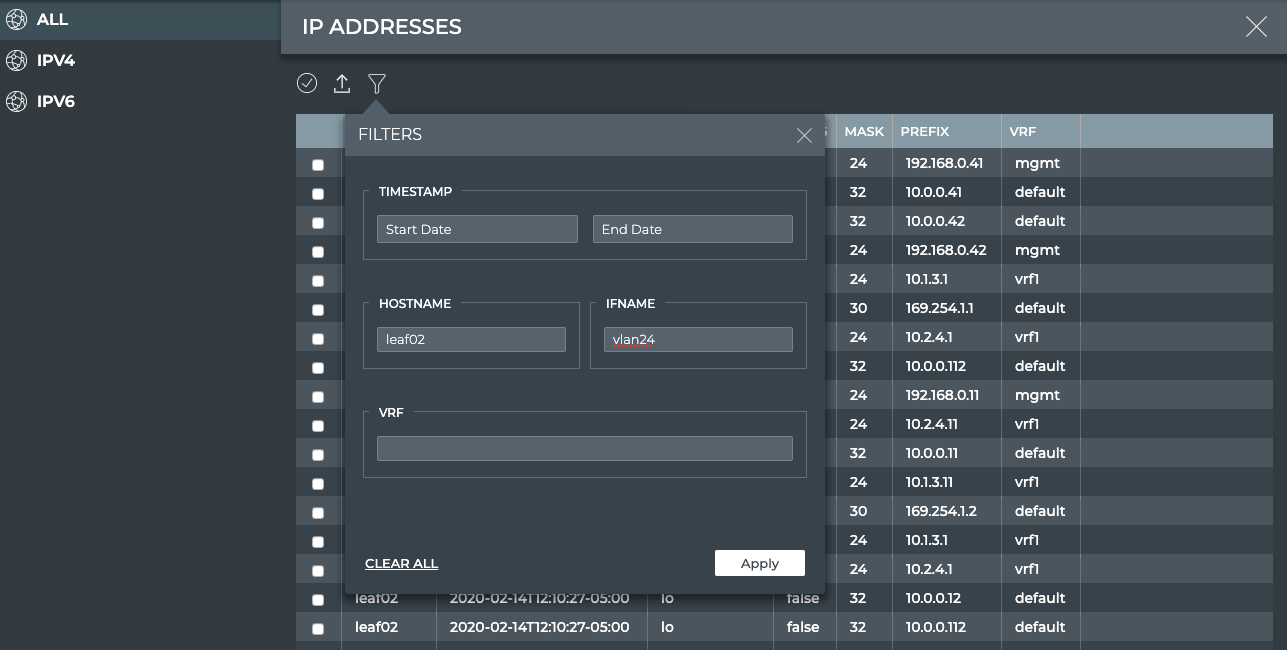
Enter a hostname and interface name in the respective fields.
Click Apply.
The filter icon displays a red dot to indicate filters are applied, and each filter is presented above the table.
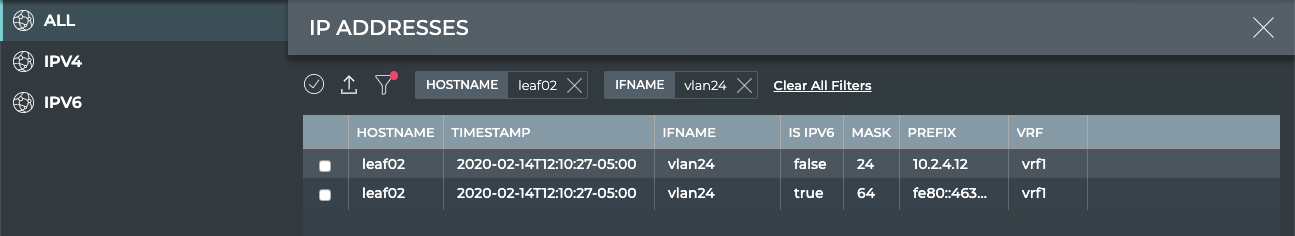
To remove a filter, simply click
on the filter, or to remove all filters at once, click Clear All Filters.
Export Data
You can export tabular data from a full-screen card to a CSV- or JSON-formatted file.
To export all data:
Click
 above the table.
Select the export format.
Click Export to save the file to your downloads directory.
To export selected data:
Select the individual items from the list by clicking in the checkbox next to each item.
Click
above the table.Select the export format.
Click Export to save the file to your downloads directory.