Monitor System and TCA Events
NetQ offers multiple ways to view your event status. The NetQ UI provides a graphical and tabular view and the NetQ CLI provides a tabular view of system and threshold-based (TCA) events. System events include events associated with network protocols and services operation, hardware and software status, and system services. TCA events include events associated with digital optics, ACL and forwarding resources, interface statistics, resource utilization, and sensors. You can view all events across the entire network or all events on a device. For each of these, you can filter your view of events based on event type, severity, and timeframe.
Refer to Configure System Event Notifications and Configure Threshold-Based Event Notifications for information about configuring and managing these events.
Refer to the NetQ UI Card Reference for details of the cards used with the following procedures.
Monitor All System and TCA Events Networkwide
You can monitor all system and TCA events across the network with the NetQ UI and the NetQ CLI.
Click
 (main menu).
Click Events under the Network column.
You can filter the list by any column data (click
 ) and export a page of events at a time (click
  ).
).
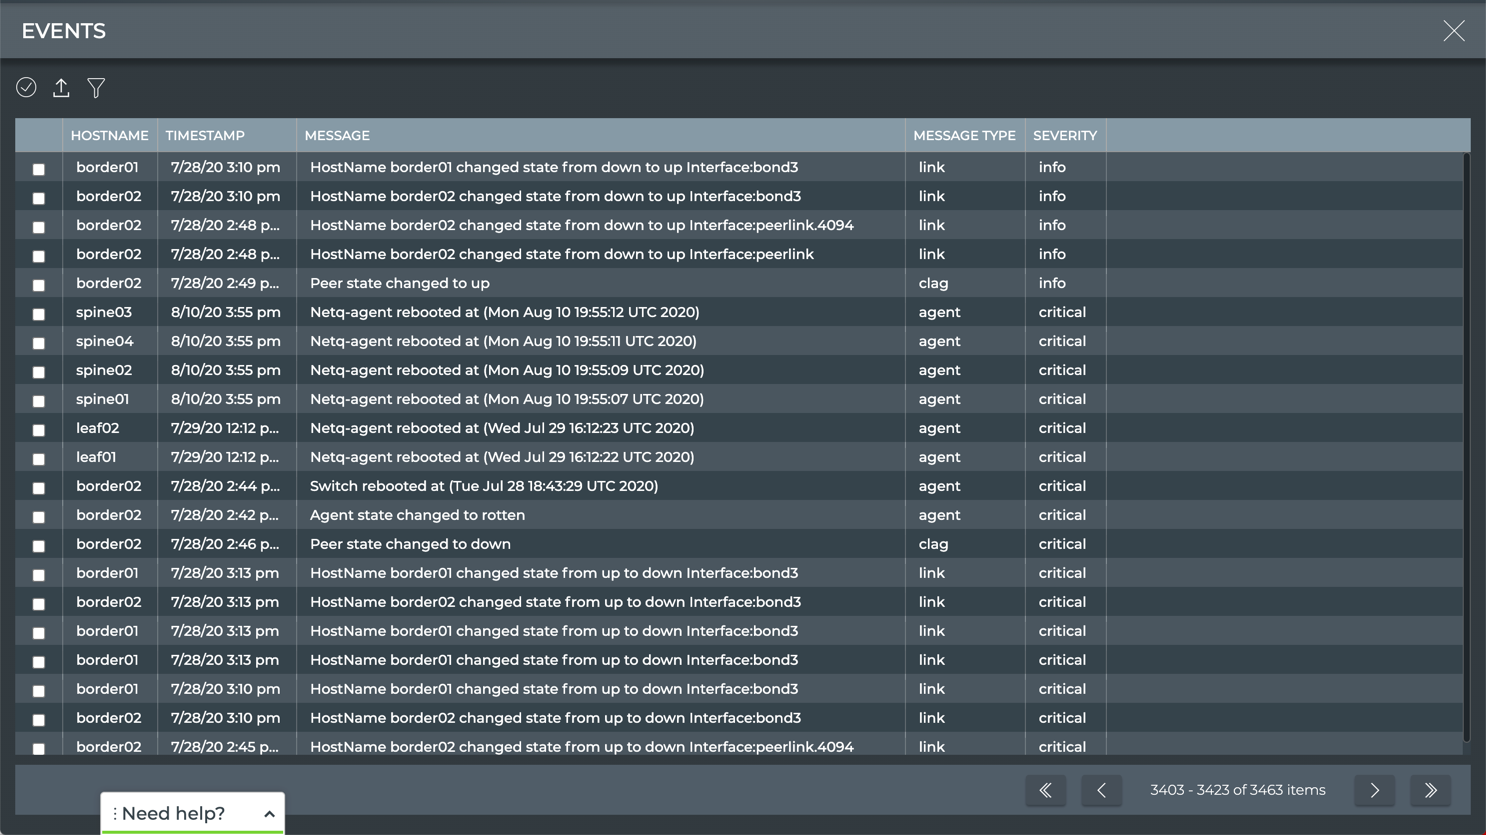
All system and TCA events across the network
To view all system and all TCA events, run:
netq show events [between <text-time> and <text-endtime>] [json]
This example shows all system and TCA events between now and an hour ago.
netq show events
cumulus@switch:~$ netq show events
Matching events records:
Hostname          Message Type             Severity         Message                             Timestamp
----------------- ------------------------ ---------------- ----------------------------------- -------------------------
leaf01            btrfsinfo                critical         data storage efficiency : space lef Wed Sep  2 20:04:30 2020
                                                            t after allocation greater than chu
                                                            nk size 0.57 GB
leaf02            btrfsinfo                critical         data storage efficiency : space lef Wed Sep  2 19:55:26 2020
                                                            t after allocation greater than chu
                                                            nk size 0.57 GB
leaf01            btrfsinfo                critical         data storage efficiency : space lef Wed Sep  2 19:34:29 2020
                                                            t after allocation greater than chu
                                                            nk size 0.57 GB
leaf02            btrfsinfo                critical         data storage efficiency : space lef Wed Sep  2 19:25:24 2020
                                                            t after allocation greater than chu
                                                            nk size 0.57 GB
This example shows all events between now and 24 hours ago.
netq show events between now and 24hr
cumulus@switch:~$ netq show events between now and 24hr
Matching events records:
Hostname          Message Type             Severity         Message                             Timestamp
----------------- ------------------------ ---------------- ----------------------------------- -------------------------
leaf01            btrfsinfo                critical         data storage efficiency : space lef Wed Sep  2 20:04:30 2020
                                                            t after allocation greater than chu
                                                            nk size 0.57 GB
leaf02            btrfsinfo                critical         data storage efficiency : space lef Wed Sep  2 19:55:26 2020
                                                            t after allocation greater than chu
                                                            nk size 0.57 GB
leaf01            btrfsinfo                critical         data storage efficiency : space lef Wed Sep  2 19:34:29 2020
                                                            t after allocation greater than chu
                                                            nk size 0.57 GB
leaf02            btrfsinfo                critical         data storage efficiency : space lef Wed Sep  2 19:25:24 2020
                                                            t after allocation greater than chu
                                                            nk size 0.57 GB
leaf01            btrfsinfo                critical         data storage efficiency : space lef Wed Sep  2 19:04:22 2020
                                                            t after allocation greater than chu
                                                            nk size 0.57 GB
leaf02            btrfsinfo                critical         data storage efficiency : space lef Wed Sep  2 18:55:17 2020
                                                            t after allocation greater than chu
                                                            nk size 0.57 GB
leaf01            btrfsinfo                critical         data storage efficiency : space lef Wed Sep  2 18:34:21 2020
                                                            t after allocation greater than chu
                                                            nk size 0.57 GB
leaf02            btrfsinfo                critical         data storage efficiency : space lef Wed Sep  2 18:25:16 2020
                                                            t after allocation greater than chu
                                                            nk size 0.57 GB
leaf01            btrfsinfo                critical         data storage efficiency : space lef Wed Sep  2 18:04:19 2020
                                                            t after allocation greater than chu
                                                            nk size 0.57 GB
leaf02            btrfsinfo                critical         data storage efficiency : space lef Wed Sep  2 17:55:15 2020
                                                            t after allocation greater than chu
                                                            nk size 0.57 GB
leaf01            btrfsinfo                critical         data storage efficiency : space lef Wed Sep  2 17:34:18 2020
                                                            t after allocation greater than chu
                                                            nk size 0.57 GB
...
Monitor All System and TCA Events on a Device
You can monitor all system and TCA events on a given device with the NetQ UI and the NetQ CLI.
Click
(main menu).Click Events under the Network column.
Click
.Enter a hostname or IP address in the Hostname field.
You can enter additional filters for message type, severity, and time range to further narrow the output.
- Click Apply.
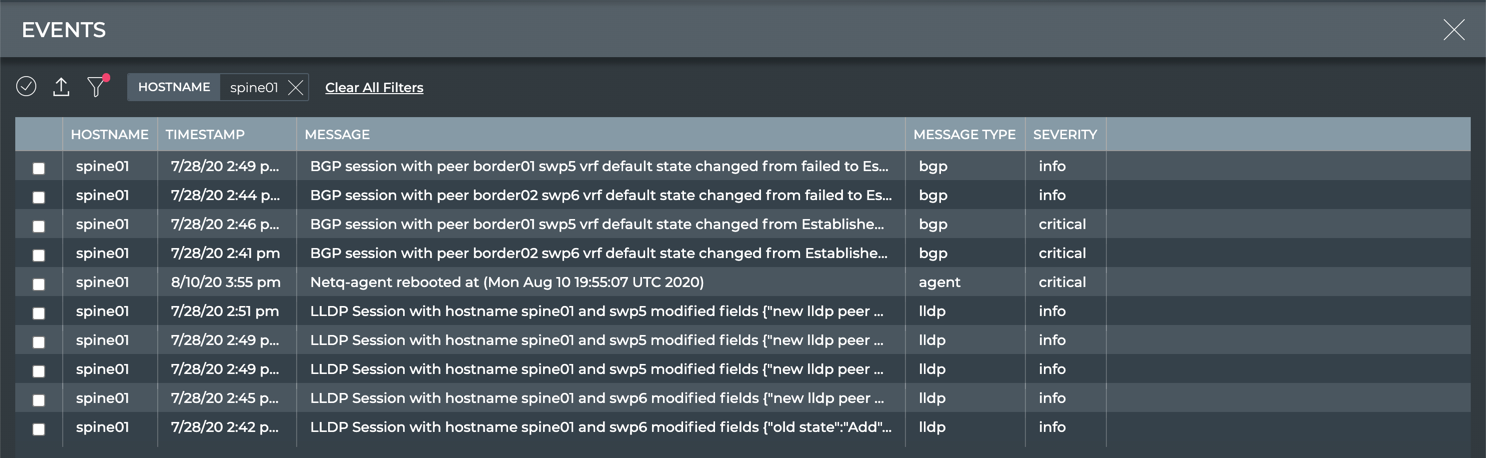
All system and TCA events on spine01 switch
To view all system and TCA events on a switch, run:
netq <hostname> show events [between <text-time> and <text-endtime>] [json]
This example shows all system and TCA events that have occurred on the leaf01 switch between now and an hour ago.
cumulus@switch:~$ netq leaf01 show events

Matching events records:
Hostname          Message Type             Severity         Message                             Timestamp
----------------- ------------------------ ---------------- ----------------------------------- -------------------------
leaf01            btrfsinfo                critical         data storage efficiency : space lef Wed Sep  2 20:34:31 2020
                                                            t after allocation greater than chu
                                                            nk size 0.57 GB
leaf01            btrfsinfo                critical         data storage efficiency : space lef Wed Sep  2 20:04:30 2020
                                                            t after allocation greater than chu
                                                            nk size 0.57 GB
This example shows that no events have occurred on the spine01 switch in the last hour.
cumulus@switch:~$ netq spine01 show events
No matching event records found
Monitor System and TCA Events Networkwide by Type
You can view all system and TCA events of a given type on a networkwide basis using the NetQ UI and the NetQ CLI.
Click
(main menu).Click Events under the Network column.
Click
.
- Enter the name of network protocol or service (agent, bgp, link, tca_dom, and so on) in the Message Type field.
You can enter additional filters for severity and time range to further narrow the output.
- Click Apply.
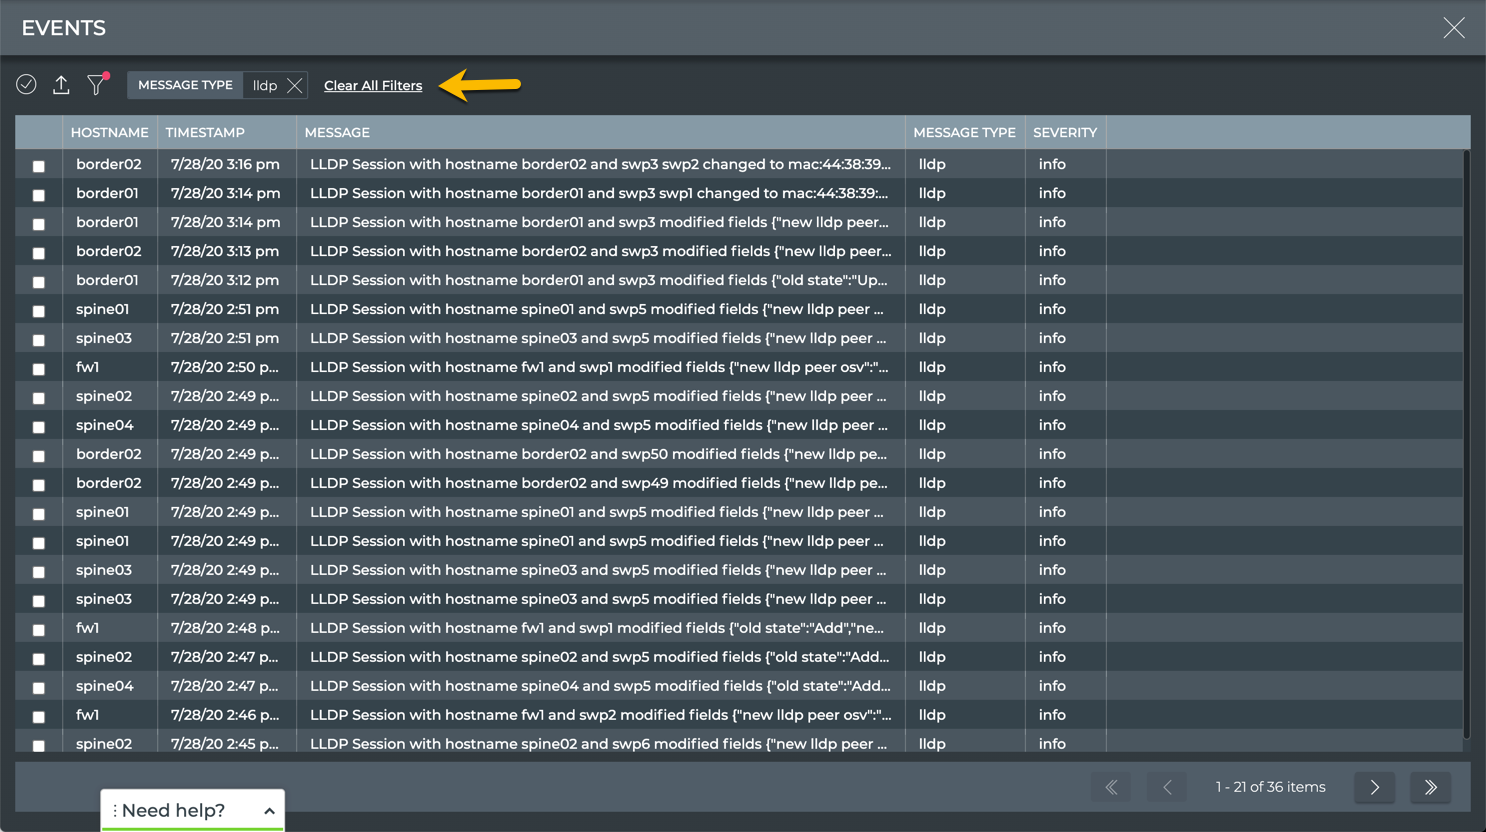
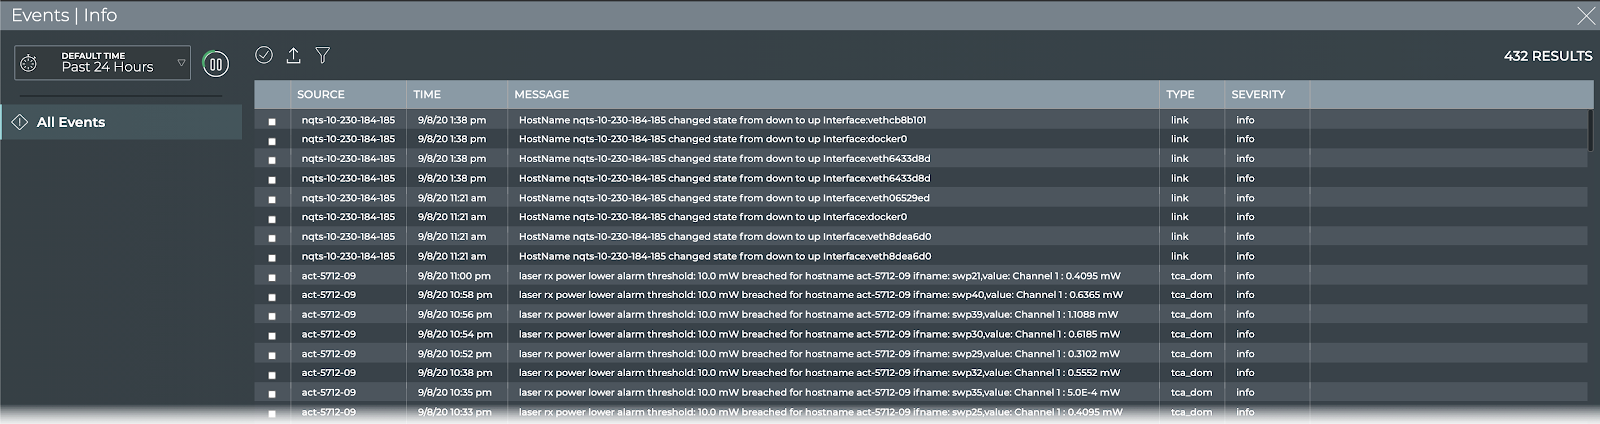
All LLDP events
To view all system events for a given network protocol or service, run:
netq show events (type agents|bgp|btrfsinfo|clag|clsupport|configdiff|evpn|interfaces|interfaces-physical|lcm|lldp|macs|mtu|ntp|os|ospf|roceconfig|sensors|services|tca_roce|trace|vlan|vxlan) [between <text-time> and <text-endtime>] [json]
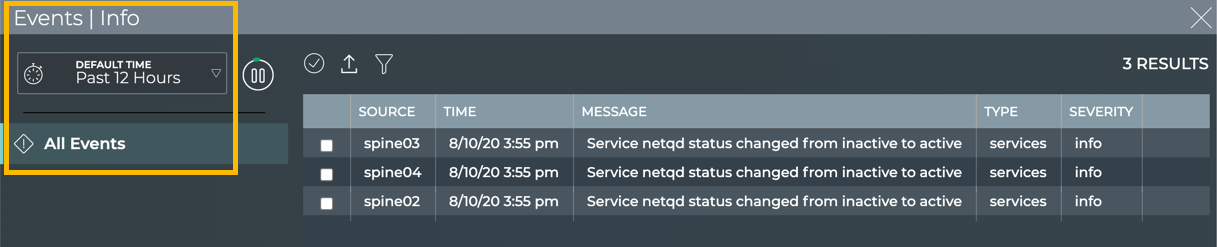
This example shows all services events between now and 30 days ago.
cumulus@switch:~$ netq show events type services between now and 30d
Matching events records:
Hostname          Message Type             Severity         Message                             Timestamp
----------------- ------------------------ ---------------- ----------------------------------- -------------------------
spine03           services                 critical         Service netqd status changed from a Mon Aug 10 19:55:52 2020
                                                            ctive to inactive
spine04           services                 critical         Service netqd status changed from a Mon Aug 10 19:55:51 2020
                                                            ctive to inactive
spine02           services                 critical         Service netqd status changed from a Mon Aug 10 19:55:50 2020
                                                            ctive to inactive
spine03           services                 info             Service netqd status changed from i Mon Aug 10 19:55:38 2020
                                                            nactive to active
spine04           services                 info             Service netqd status changed from i Mon Aug 10 19:55:37 2020
                                                            nactive to active
spine02           services                 info             Service netqd status changed from i Mon Aug 10 19:55:35 2020
You can enter a severity using the level option to further narrow the output.
Monitor System and TCA Events on a Device by Type
You can view all system and TCA events of a given type on a given device using the NetQ UI and the NetQ CLI.
Click
(main menu).Click Events under the Network column.
Click
.Enter the hostname of the device for which you want to see events in the Hostname field.
Enter the name of a network protocol or service in the Message Type field.
You can enter additional filters for severity and time range to further narrow the output.
- Click Apply.
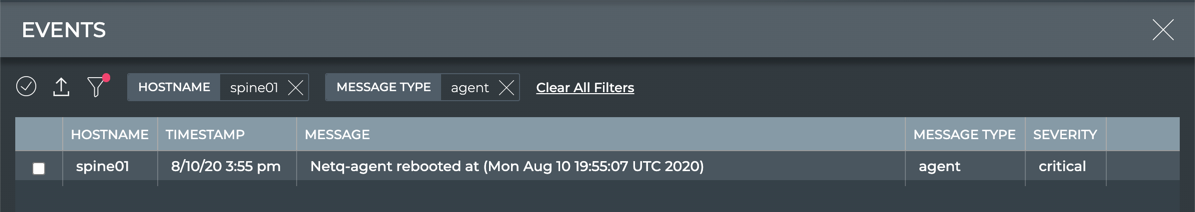
All agent events on the spine01 switch
To view all system events for a given network protocol or service, run:
netq <hostname> show events (type agents|bgp|btrfsinfo|clag|clsupport|configdiff|evpn|interfaces|interfaces-physical|lcm|lldp|macs|mtu|ntp|os|ospf|roceconfig|sensors|services|tca_roce|trace|vlan|vxlan) [between <text-time> and <text-endtime>] [json]
This example shows all services events on the spine03 switch between now and 30 days ago.
cumulus@switch:~$ netq spine03 show events type services between now and 30d
Matching events records:
Hostname          Message Type             Severity         Message                             Timestamp
----------------- ------------------------ ---------------- ----------------------------------- -------------------------
spine03           services                 critical         Service netqd status changed from a Mon Aug 10 19:55:52 2020
                                                            ctive to inactive
spine03           services                 info             Service netqd status changed from i Mon Aug 10 19:55:38 2020
                                                            nactive to active
You can enter a severity using the level option to further narrow the output.
Monitor System and TCA Events Networkwide by Severity
You can view system and TCA events by their severity on a networkwide basis with the NetQ UI and the NetQ CLI using the:
- Events list: with events of all severities at on time or filter by severity
- Events|Alarms card: view events with critical severity
- Events|Info card: view events with info, error, and warning severities
netq show events levelcommand
System event severities include info, error, warning, critical or debug. TCA event severities include info or critical.
Click
(main menu).Click Events under the Network column.
Click
.Enter a severity in the Severity field. Default is Info.
You can enter additional filters for message type and time range to further narrow the output.
- Click Apply.
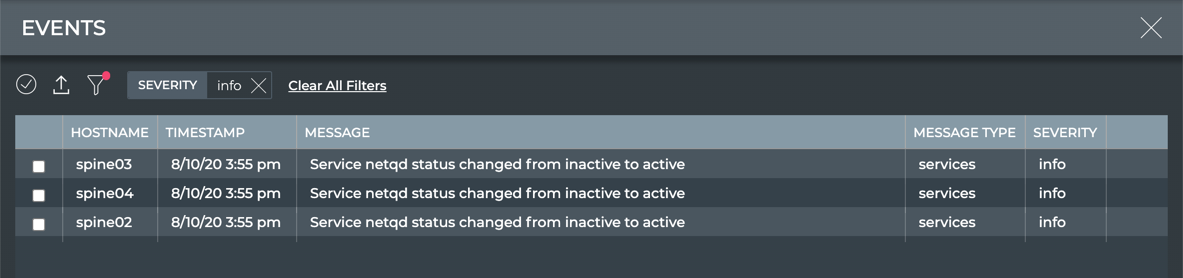
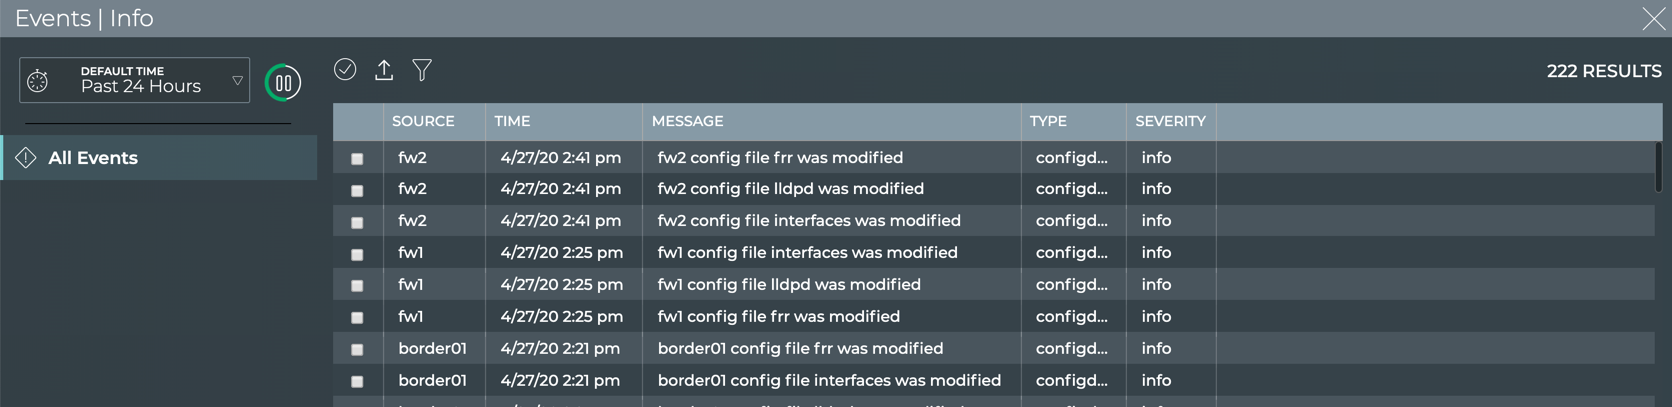
All system and TCA events with info severity
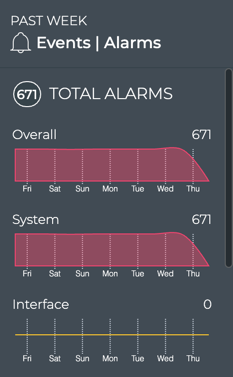
View Alarm Status Summary
A summary of the critical alarms in the network includes the number of alarms, a trend indicator, a performance indicator, and a distribution of those alarms.
To view the summary, open the small Alarms card.
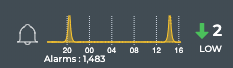
In this example, there are a small number of alarms (2), the number of alarms is decreasing (down arrow), and there are fewer alarms right now than the average number of alarms during this time period. This would indicate no further investigation is needed. Note that with such a small number of alarms, the rating might be a bit skewed.
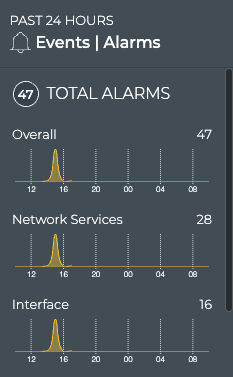
View the Distribution of Alarms
It is helpful to know where and when alarms are occurring in your network. The Alarms card workflow enables you to see the distribution of alarms based on its source: network services, interfaces, system services, and threshold-based events.
To view the alarm distribution, open the medium Alarms card. Scroll down to view all of the charts.
Monitor Alarm Details
The Alarms card workflow enables users to easily view and track critical severity alarms occurring anywhere in your network. You can sort alarms based on their occurrence or view devices with the most network services alarms.
To view critical alarms, open the large Alarms card.
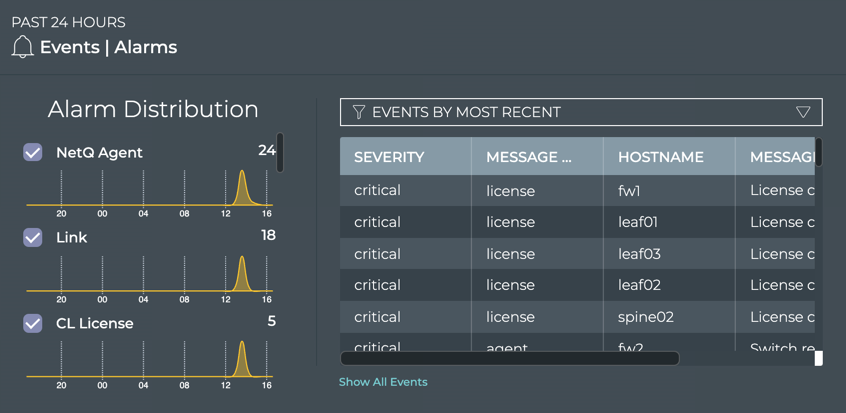
From this card, you can view the distribution of alarms for each of the categories over time. The charts are sorted by total alarm count, with the highest number of alarms in a category listed at the top. Scroll down to view any hidden charts. A list of the associated alarms is also displayed. By default, the list of the most recent alarms is displayed when viewing the large card.
View Devices with the Most Alarms
You can filter instead for the devices that have the most alarms.
To view devices with the most alarms, open the large Alarms card, and then select Devices by event count from the dropdown.
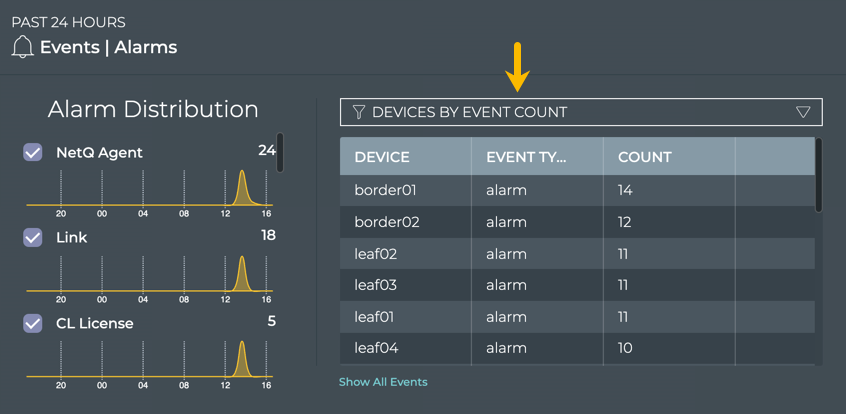
You can open the switch card for any of the listed devices by clicking on the device name.
Filter Alarms by Category
You can focus your view to include alarms for one or more selected alarm categories.
To filter for selected categories:
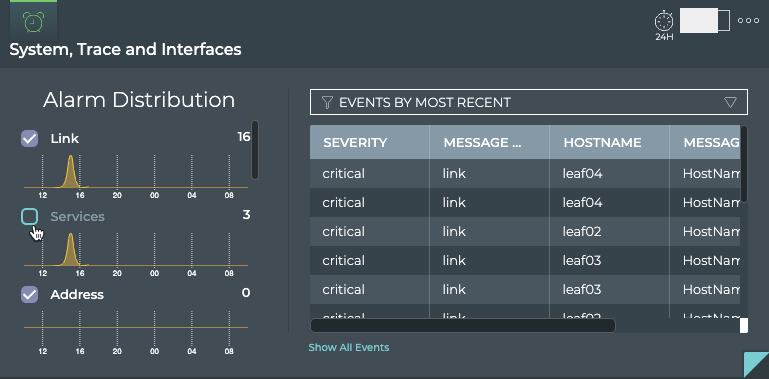
Click the checkbox to the left of one or more charts to remove that set of alarms from the table on the right.
Select the Devices by event count to view the devices with the most alarms for the selected categories.
Switch back to most recent events by selecting Events by most recent.
Click the checkbox again to return a category’s data to the table.
In this example, we removed the Services from the event listing.
Compare Alarms with a Prior Time
You can change the time period for the data to compare with a prior time. If the same devices are consistently indicating the most alarms, you might want to look more carefully at those devices using the Switches card workflow.
To compare two time periods:
Open a second Alarm Events card. Remember it goes to the bottom of the workbench.
Switch to the large size card.
Move the card to be next to the original Alarm Events card. Note that moving large cards can take a few extra seconds since they contain a large amount of data.
Hover over the card and click
 .
.
- Select a different time period.
Compare the two cards with the Devices by event count filter applied.
In this example, the total alarm count and the devices with the most alarms in each time period have changed for the better overall. You could go back further in time or investigate the current status of the largest offenders.
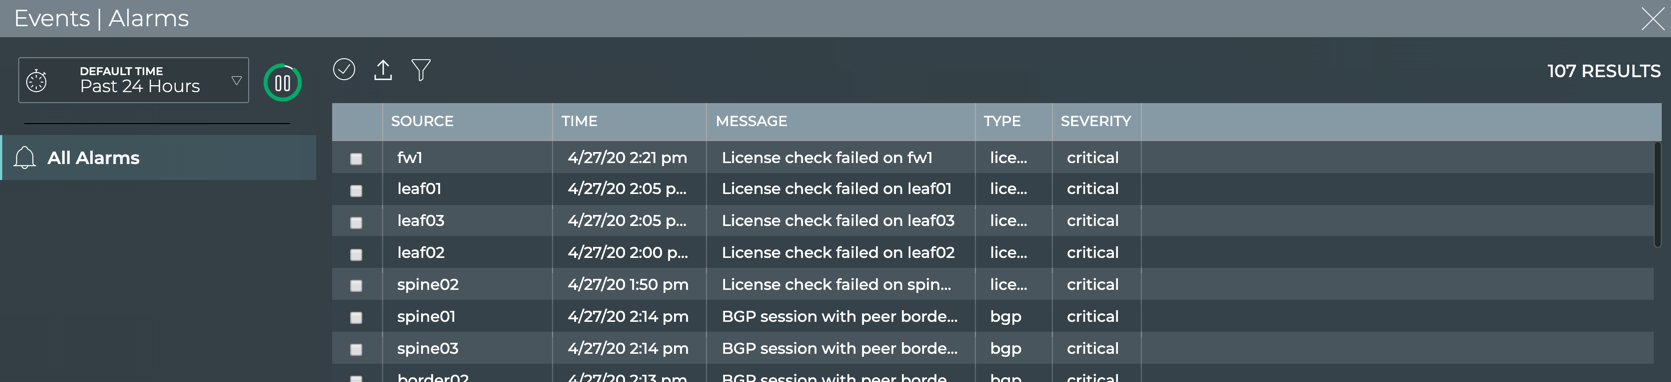
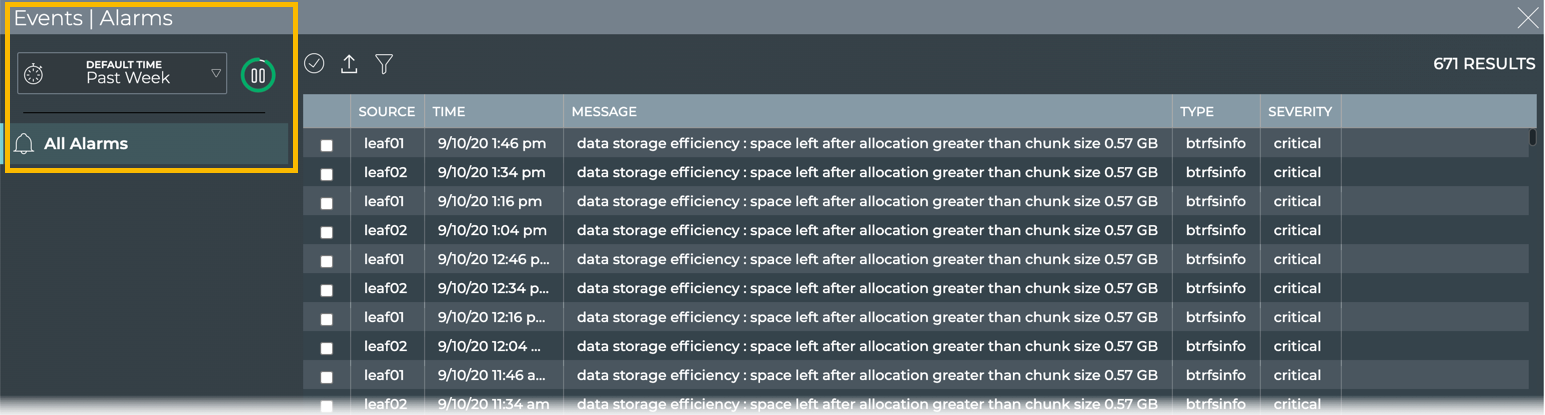
View All Alarm Events
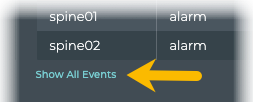
You can view all events in the network either by clicking the Show All Events link under the table on the large Alarm Events card, or by opening the full screen Alarm Events card.
OR
To return to your workbench, click ![]() in the top right corner of the card.
in the top right corner of the card.
View Info Status Summary
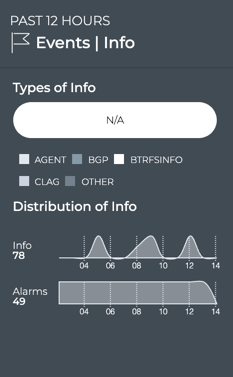
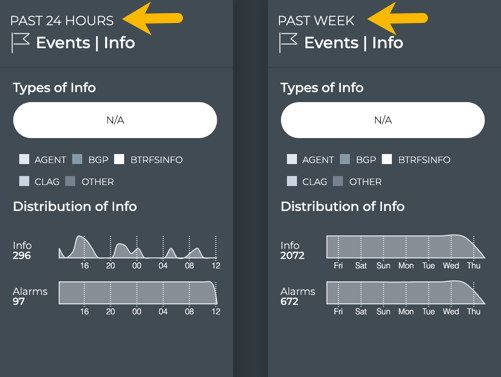
A summary of the informational events occurring in the network can be found on the small, medium, and large Info cards. Additional details are available as you increase the size of the card.
To view the summary with the small Info card, simply open the card. This card gives you a high-level view in a condensed visual, including the number and distribution of the info events along with the alarms that have occurred during the same time period.
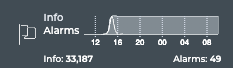
To view the summary with the medium Info card, simply open the card. This card gives you the same count and distribution of info and alarm events, but it also provides information about the sources of the info events and enables you to view a small slice of time using the distribution charts.
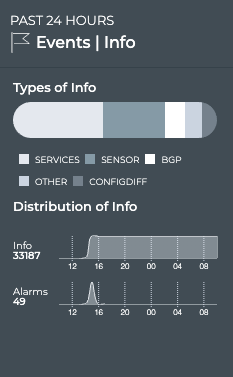
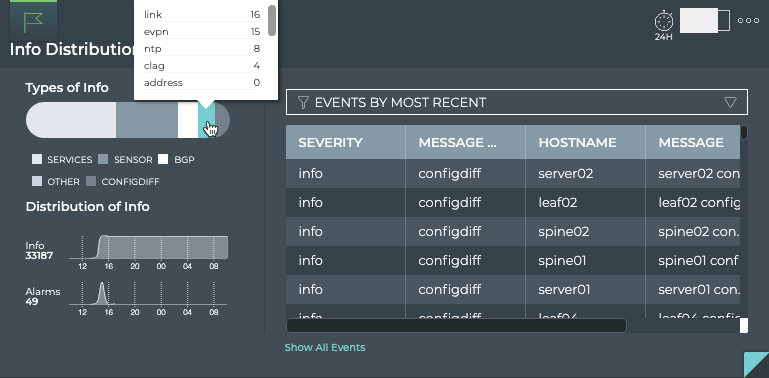
Use the chart at the top of the card to view the various sources of info events. The four or so types with the most info events are called out separately, with all others collected together into an Other category. Hover over segment of chart to view the count for each type.
To view the summary with the large Info card, open the card. The left side of the card provides the same capabilities as the medium Info card.
Compare Timing of Info and Alarm Events
While you can see the relative relationship between info and alarm events on the small Info card, the medium and large cards provide considerably more information. Open either of these to view individual line charts for the events. Generally, alarms have some corollary info events. For example, when a network service becomes unavailable, a critical alarm is often issued, and when the service becomes available again, an info event of severity warning is generated. For this reason, you might see some level of tracking between the info and alarm counts and distributions. Some other possible scenarios:
- When a critical alarm is resolved, you might see a temporary increase in info events as a result.
- When you get a burst of info events, you might see a follow-on increase in critical alarms, as the info events might have been warning you of something beginning to go wrong.
- You set logging to debug, and a large number of info events of severity debug are seen. You would not expect to see an increase in critical alarms.
View All Info Events Sorted by Time of Occurrence
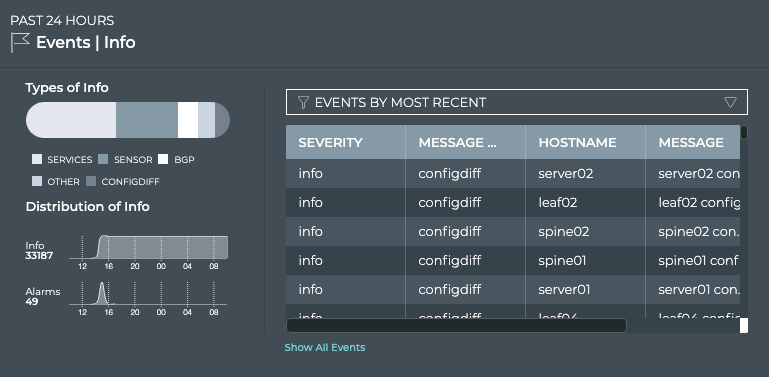
You can view all info events using the large Info card. Open the large card and confirm the Events By Most Recent option is selected in the filter above the table on the right. When this option is selected, all of the info events are listed with the most recently occurring event at the top. Scrolling down shows you the info events that have occurred at an earlier time within the selected time period for the card.
View Devices with the Most Info Events
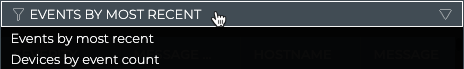
You can filter instead for the devices that have the most info events by selecting the Devices by Event Count option from the filter above the table.
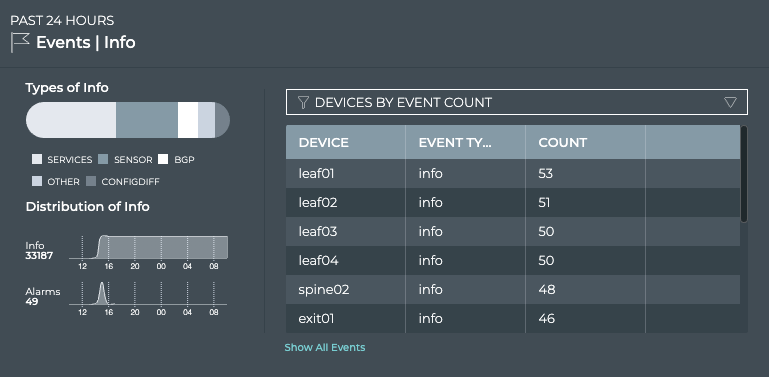
You can open the switch card for any of the listed devices by clicking on the device name.
View All Info Events
You can view all events in the network either by clicking the Show All Events link under the table on the large Info Events card, or by opening the full screen Info Events card.
OR
System events
System and TCA events
To return to your workbench, click ![]() in the top right corner of the card.
in the top right corner of the card.
To view all system events of a given severity, run:
netq show events (level info | level error | level warning | level critical | level debug) [between <text-time> and <text-endtime>] [json]
This example shows all events with critical severity between now and 24 hours ago.
cumulus@switch:~$ netq show events level critical
Matching events records:
Hostname          Message Type             Severity         Message                             Timestamp
----------------- ------------------------ ---------------- ----------------------------------- -------------------------
Matching events records:
Hostname          Message Type             Severity         Message                             Timestamp
----------------- ------------------------ ---------------- ----------------------------------- -------------------------
leaf02            btrfsinfo                critical         data storage efficiency : space lef Tue Sep  8 21:32:32 2020
                                                            t after allocation greater than chu
                                                            nk size 0.57 GB
leaf01            btrfsinfo                critical         data storage efficiency : space lef Tue Sep  8 21:13:28 2020
                                                            t after allocation greater than chu
                                                            nk size 0.57 GB
leaf02            btrfsinfo                critical         data storage efficiency : space lef Tue Sep  8 21:02:31 2020
                                                            t after allocation greater than chu
                                                            nk size 0.57 GB
leaf01            btrfsinfo                critical         data storage efficiency : space lef Tue Sep  8 20:43:27 2020
                                                            t after allocation greater than chu
                                                            nk size 0.57 GB
You can use the type and between options to further narrow the output.
Monitor System and TCA Events on a Device by Severity
You can view system and TCA events by their severity on a given device with the NetQ UI and the NetQ CLI using the:
- Events list: view events of all severities at on time or by one severity filtered by device
- Events|Alarms card: view events with critical severity filtered by device
- Events|Info card: view events with info, error, and warning severities filtered by device
- Switch card: view all events with critical severity on the given device
netq <hostname> show events levelcommand
System event severities include info, error, warning, critical or debug severity. TCA event severities include info or critical.
Click
(main menu).Click Events under the Network column.
Click
.Enter the hostname for the device of interest in the Hostname field.
Enter a severity in the Severity field. Default is Info.
You can enter additional filters for message type and time range to further narrow the output.
- Click Apply.
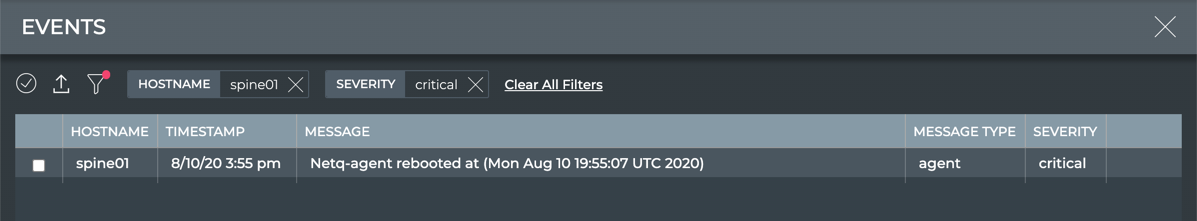
All critical severity events on the spine01 switch
The Events|Alarms card shows critical severity events. You can view the devices that have the most alarms or you can view all alarms on a device.
To view devices with the most alarms:
Locate or open the Events|Alarms card on your workbench.
Change to the large size card using the size picker.
Select Devices by event count from the dropdown above the table.
You can open the switch card for any of the listed devices by clicking on the device name.
To view all alarms on a given device:
- Click the Show All Events link under the table on the large Events|Alarms card, or open the full screen Events|Alarms card.
Click
and enter a hostname for the device of interest.Click Apply.
To return to your workbench, click
 in the top right corner of the card.
The Events|Info card shows all non-critical severity events. You can view the devices that have the most info events or you can view all non-critical events on a device.
To view devices with the most non-critical events:
Locate or open the Events|Info card on your workbench.
Change to the large size card using the size picker.
Select Devices by event count from the dropdown above the table.
You can open the switch card for any of the listed devices by clicking on the device name.
To view all info events on a given device:
- Click the Show All Events link under the table on the large Events|Info card, or open the full screen Events|Info card.
Click
and enter a hostname for the device of interest.Click Apply.
To return to your workbench, click
in the top right corner of the card.
The Switch card displays the alarms (events of critical severity) for the switch.
Open the Switch card for the switch of interest.
Click
 .
.Click Open a switch card.
Enter the switch hostname.
Click Add.
Change to the full screen card using the size picker.
Enter a severity in the Severity field. Default is Info.
You can enter additional filters for message type and time range to further narrow the output.
Click Apply.
To return to your workbench, click
in the top right corner of the card.
To view all system events for a given severity on a device, run:
netq <hostname> show events (level info | level error | level warning | level critical | level debug) [between <text-time> and <text-endtime>] [json]
This example shows all critical severity events on the leaf01 switch between now and 24 hours ago.
cumulus@switch:~$ netq leaf01 show events level critical
Matching events records:
Hostname          Message Type             Severity         Message                             Timestamp
----------------- ------------------------ ---------------- ----------------------------------- -------------------------
leaf01            btrfsinfo                critical         data storage efficiency : space lef Wed Sep  9 18:44:49 2020
                                                            t after allocation greater than chu
                                                            nk size 0.57 GB
leaf01            btrfsinfo                critical         data storage efficiency : space lef Wed Sep  9 18:14:48 2020
                                                            t after allocation greater than chu
                                                            nk size 0.57 GB
You can use the type or between options to further narrow the output.
Monitor System and TCA Events Networkwide by Time
You can monitor all system and TCA events across the network currently or for a time in the past with the NetQ UI and the NetQ CLI.
- Events list: view events for a time range in the past 24 hours
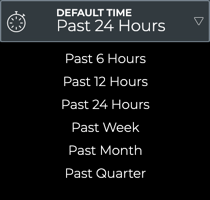
- Events|Alarms card: view critical events for 6 hours, 12 hours, 24 hours, a week, a month, or a quarter in the past
- Events|Info card: view non-critical events for 6 hours, 12 hours, 24 hours, a week, a month, or a quarter in the past
netq show events betweencommand: view events for a time range in the past
Click
(main menu).Click Events under the Network column.
Click
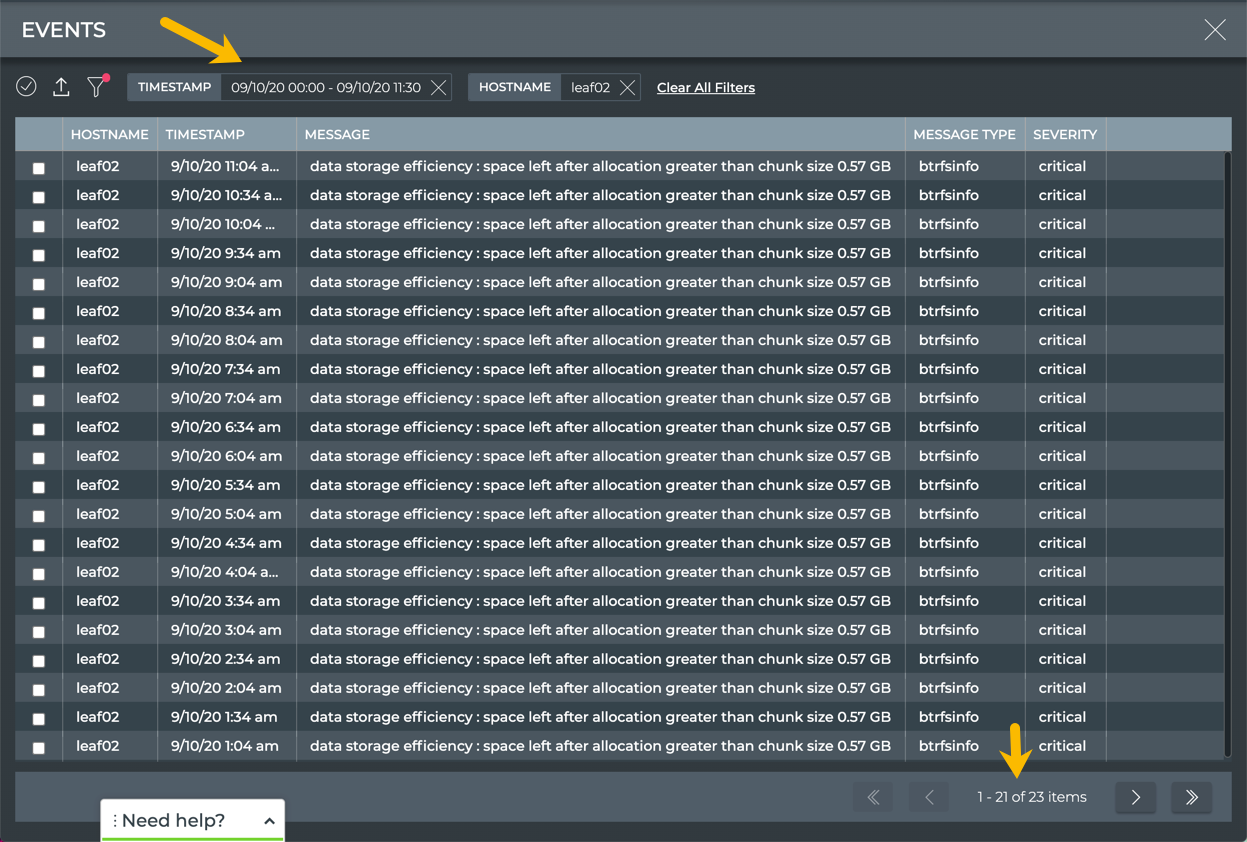
.Click in the Timestamp fields to enter a start and end date for a time range in the past 24 hours.
This allows you to view only the most recent events or events within a particular hour or few hours over the last day.
Click Apply.
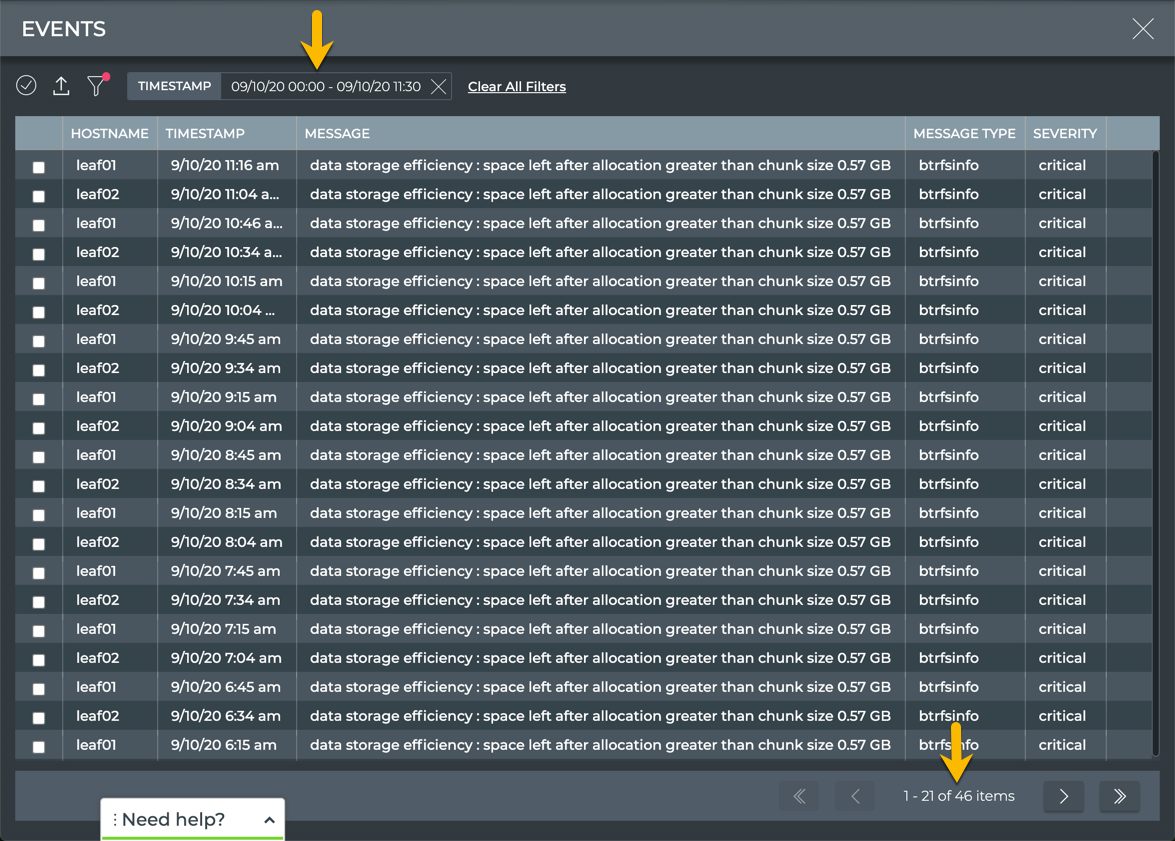
All system and TCA events across the network between midnight and 11:30am
All cards have a default time period for the data shown on the card, typically the last 24 hours. You can change the time period to view the data during a different time range to aid analysis of previous or existing issues. You can also compare the current events with a prior time. If the same devices are consistently indicating the most alarms, you might want to look more carefully at those devices using the Switches card workflow.
To view critical events for a time in the past using the small, medium, or large Events|Alarms card:
Locate or open the Events|Alarms card on your workbench.
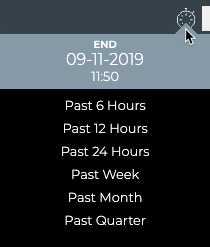
Hover over the card, and click
in the header.Select a time period from the dropdown list.
Small, medium, and large card
To view critical events for a time in the past using the full-screen Events|Alarms card:
Locate or open the Events|Alarms card on your workbench.
Hover over the card, and change to the full-screen card.
Select a time period from the dropdown list.
Full-screen card
Changing the time period in this manner only changes the time period for this card. No other cards are impacted.
To compare the event data for two time periods:
Open a second Events|Alarms card. Remember the card is placed at the bottom of the workbench.
Change to the medium or large size card.
Move the card to be next to the original Alarm Events card. Note that moving large cards can take a few extra seconds since they contain a large amount of data.
Hover over the card and click
.
- Select a different time period.
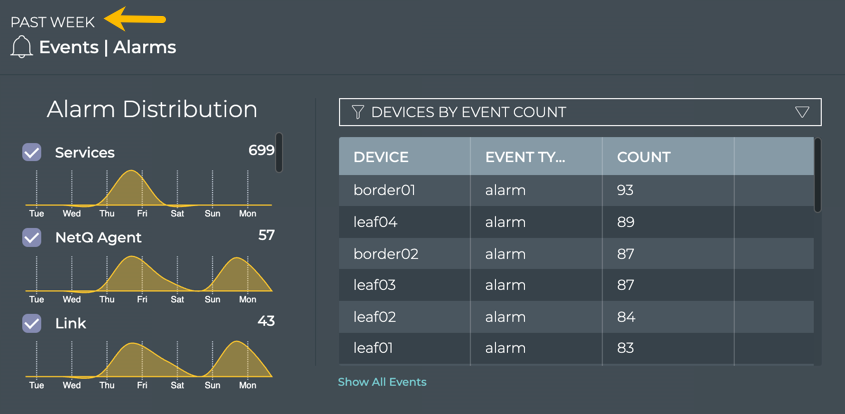
Compare the two cards with the Devices by event count filter applied.
In this example, the total alarm count and the devices with the most alarms in each time period have changed for the better overall. You could go back further in time or investigate the current status of the largest offenders.
All cards have a default time period for the data shown on the card, typically the last 24 hours. You can change the time period to view the data during a different time range to aid analysis of previous or existing issues. You can also compare the current events with a prior time. If the same devices are consistently indicating the most alarms, you might want to look more carefully at those devices using the Switches card workflow.
To view informational events for a time in the past using the small, medium, or large Events|Info card:
Locate or open the Events|Info card on your workbench.
Hover over the card, and click
in the header.Select a time period from the dropdown list.
To view informational events for a time in the past using the full-screen Events|Info card:
Locate or open the Events|Info card on your workbench.
Hover over the card, and change to the full-screen card.
Select a time period from the dropdown list.
Full-screen card
Changing the time period in this manner only changes the time period for this card. No other cards are impacted.
To compare the event data for two time periods:
Open a second Events|Alarms card. Remember the card is placed at the bottom of the workbench.
Change to the medium or large size card.
Move the card to be next to the original Alarm Events card. Note that moving large cards can take a few extra seconds since they contain a large amount of data.
Hover over the card and click
.
- Select a different time period.
Compare the two cards.
In this example, the total info event count has reduced dramatically. Optionally change to the large size of each card to compare which devices have been experiencing the most events, using the Devices by event count filter.
The NetQ CLI uses a default of one hour unless otherwise specified. To view all system and all TCA events for a time beyond an hour in the past, run:
netq show events [between <text-time> and <text-endtime>] [json]
This example shows all system and TCA events between now and 24 hours ago.
netq show events between now and 24hr
cumulus@switch:~$ netq show events between now and 24hr
Matching events records:
Hostname          Message Type             Severity         Message                             Timestamp
----------------- ------------------------ ---------------- ----------------------------------- -------------------------
leaf01            btrfsinfo                critical         data storage efficiency : space lef Wed Sep  2 20:04:30 2020
                                                            t after allocation greater than chu
                                                            nk size 0.57 GB
leaf02            btrfsinfo                critical         data storage efficiency : space lef Wed Sep  2 19:55:26 2020
                                                            t after allocation greater than chu
                                                            nk size 0.57 GB
leaf01            btrfsinfo                critical         data storage efficiency : space lef Wed Sep  2 19:34:29 2020
                                                            t after allocation greater than chu
                                                            nk size 0.57 GB
leaf02            btrfsinfo                critical         data storage efficiency : space lef Wed Sep  2 19:25:24 2020
                                                            t after allocation greater than chu
                                                            nk size 0.57 GB
leaf01            btrfsinfo                critical         data storage efficiency : space lef Wed Sep  2 19:04:22 2020
                                                            t after allocation greater than chu
                                                            nk size 0.57 GB
leaf02            btrfsinfo                critical         data storage efficiency : space lef Wed Sep  2 18:55:17 2020
                                                            t after allocation greater than chu
                                                            nk size 0.57 GB
leaf01            btrfsinfo                critical         data storage efficiency : space lef Wed Sep  2 18:34:21 2020
                                                            t after allocation greater than chu
                                                            nk size 0.57 GB
leaf02            btrfsinfo                critical         data storage efficiency : space lef Wed Sep  2 18:25:16 2020
                                                            t after allocation greater than chu
                                                            nk size 0.57 GB
leaf01            btrfsinfo                critical         data storage efficiency : space lef Wed Sep  2 18:04:19 2020
                                                            t after allocation greater than chu
                                                            nk size 0.57 GB
leaf02            btrfsinfo                critical         data storage efficiency : space lef Wed Sep  2 17:55:15 2020
                                                            t after allocation greater than chu
                                                            nk size 0.57 GB
leaf01            btrfsinfo                critical         data storage efficiency : space lef Wed Sep  2 17:34:18 2020
                                                            t after allocation greater than chu
                                                            nk size 0.57 GB
...
This example shows all system and TCA events between one and three days ago.
cumulus@switch:~$ netq show events between 1d and 3d

Matching events records:
Hostname          Message Type             Severity         Message                             Timestamp
----------------- ------------------------ ---------------- ----------------------------------- -------------------------
leaf01            btrfsinfo                critical         data storage efficiency : space lef Wed Sep  9 16:14:37 2020
                                                            t after allocation greater than chu
                                                            nk size 0.57 GB
leaf02            btrfsinfo                critical         data storage efficiency : space lef Wed Sep  9 16:03:31 2020
                                                            t after allocation greater than chu
                                                            nk size 0.57 GB
leaf01            btrfsinfo                critical         data storage efficiency : space lef Wed Sep  9 15:44:36 2020
                                                            t after allocation greater than chu
                                                            nk size 0.57 GB
leaf02            btrfsinfo                critical         data storage efficiency : space lef Wed Sep  9 15:33:30 2020
                                                            t after allocation greater than chu
                                                            nk size 0.57 GB
leaf01            btrfsinfo                critical         data storage efficiency : space lef Wed Sep  9 15:14:35 2020
                                                            t after allocation greater than chu
                                                            nk size 0.57 GB
leaf02            btrfsinfo                critical         data storage efficiency : space lef Wed Sep  9 15:03:28 2020
                                                            t after allocation greater than chu
                                                            nk size 0.57 GB
leaf01            btrfsinfo                critical         data storage efficiency : space lef Wed Sep  9 14:44:34 2020
                                                            t after allocation greater than chu
                                                            nk size 0.57 GB
leaf02            btrfsinfo                critical         data storage efficiency : space lef Wed Sep  9 14:33:21 2020
                                                            t after allocation greater than chu
                                                            nk size 0.57 GB
...
Monitor System and TCA Events on a Device by Time
You can monitor all system and TCA events on a device currently or for a time in the past with the NetQ UI and the NetQ CLI.
- Events list: view events for a device at a time range in the past 24 hours
- Events|Alarms card: view critical events for 6 hours, 12 hours, 24 hours, a week, a month, or a quarter in the past
- Events|Info card: view non-critical events for 6 hours, 12 hours, 24 hours, a week, a month, or a quarter in the past
- Switch card: view critical events on a switch for a time range in the past
netq <hostname> show events betweencommand: view events for a time range in the past
Click
(main menu).Click Events under the Network column.
Click
.Enter a hostname into the Hostname field.
Click in the Timestamp fields to enter a start and end date for a time range in the past 24 hours.
This allows you to view only the most recent events or events within a particular hour or few hours over the last day.
Click Apply.
All system and TCA events on the leaf02 switch between midnight and 11:30am
- Return to your workbench. Click in the top right corner of the card.
All cards have a default time period for the data shown on the card, typically the last 24 hours. You can change the time period to view the data during a different time range to aid analysis of previous or existing issues.
To view critical events for a device at a time in the past:
Locate or open the Events|Alarms card on your workbench.
Hover over the card, and change to the full-screen card.
Select a time period from the dropdown list.
Full-screen card
Changing the time period in this manner only changes the time period for this card. No other cards are impacted.
Click
.Enter a hostname into the Hostname field, and click Apply.
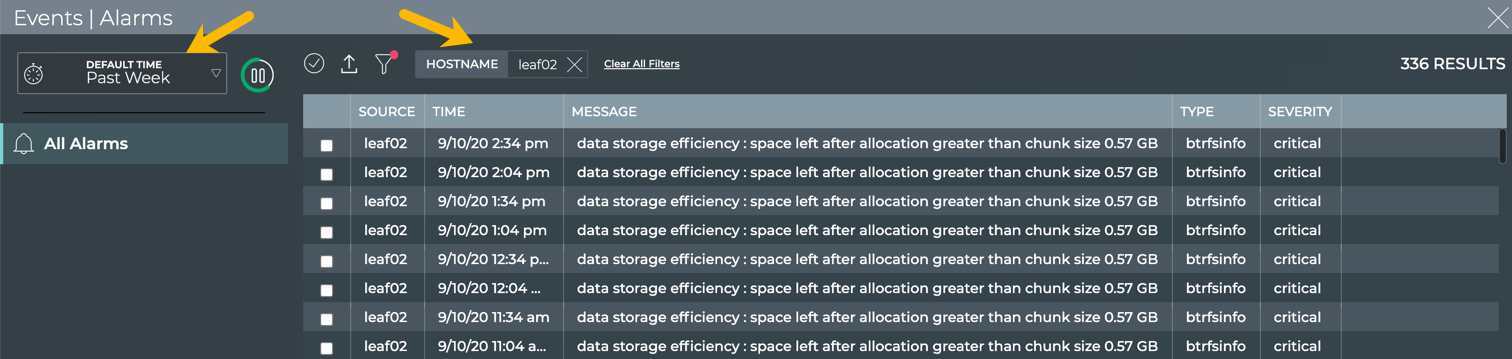
All system and TCA events on the leaf02 switch in the past week
- Return to your workbench. Click in the top right corner of the card.
All cards have a default time period for the data shown on the card, typically the last 24 hours. You can change the time period to view the data during a different time range to aid analysis of previous or existing issues.
To view informational events for a time in the past:
Locate or open the Events|Info card on your workbench.
Hover over the card, and change to the full-screen card.
Select a time period from the dropdown list.
Full-screen card
Changing the time period in this manner only changes the time period for this card. No other cards are impacted.
Click
.Enter a hostname into the Hostname field, and click Apply.
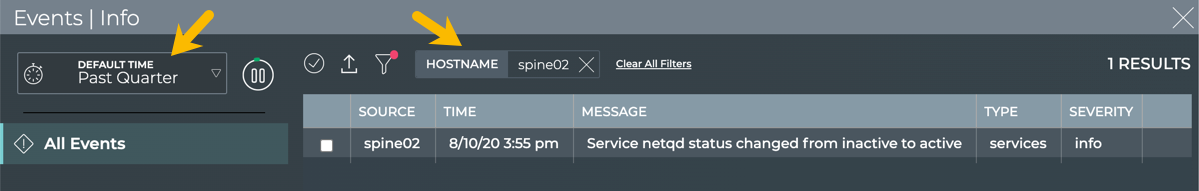
All system and TCA events on the spine02 switch in the past quarter
- Return to your workbench. Click in the top right corner of the card.
The Switch card displays the alarms (events of critical severity) for the switch.
Open the Switch card for the switch of interest.
Click
.Click Open a switch card.
Enter the switch hostname.
Click Add.
Change to the full screen card using the size picker.
Enter start and end dates in the Timestamp fields.
Click Apply.
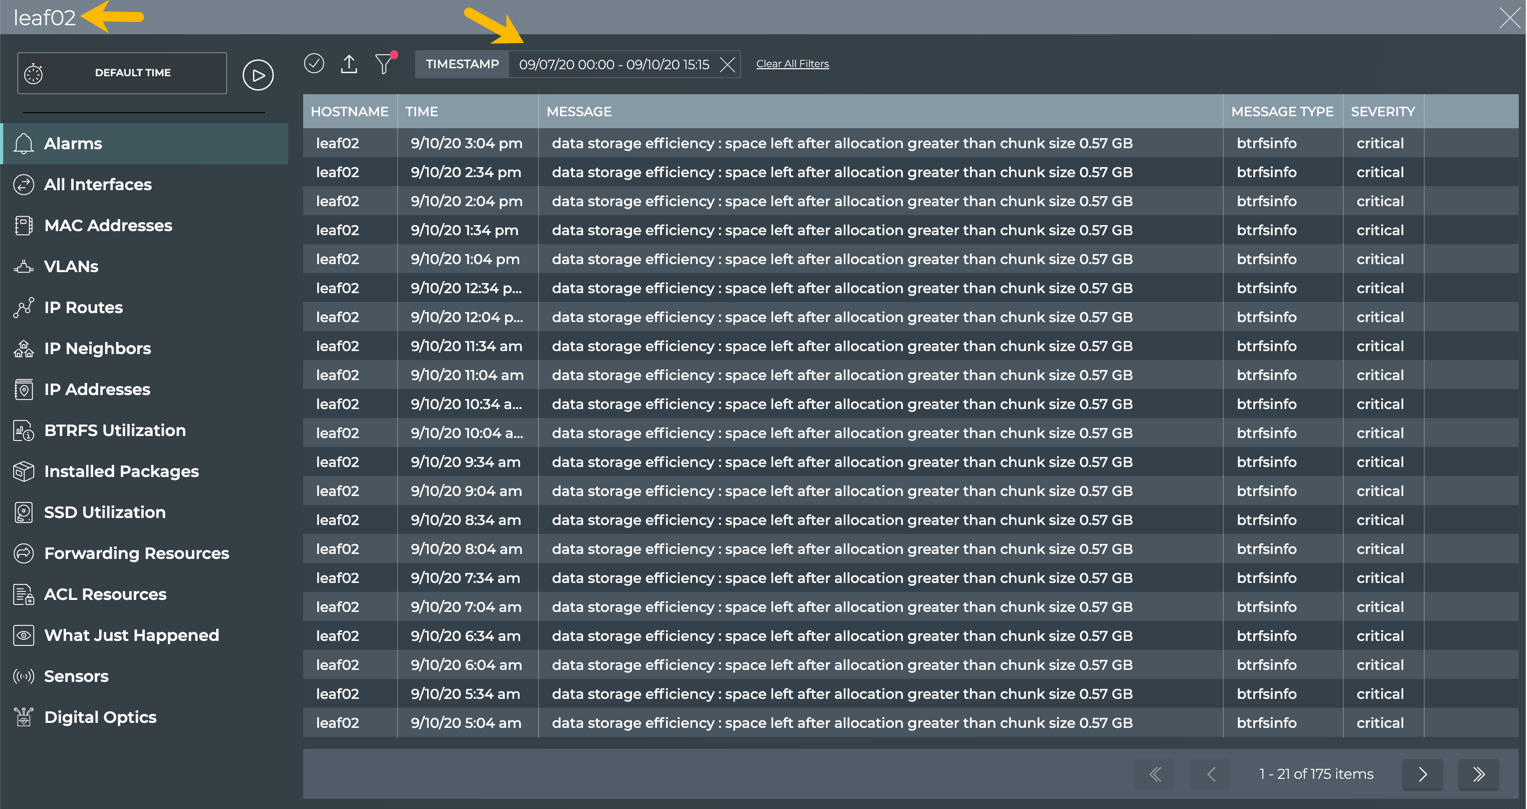
All system and TCA events on the leaf02 switch between September 7 at midnight and September 10 and 3:15 pm
- Return to your workbench. Click in the top right corner of the card.
The NetQ CLI uses a displays data collected within the last hour unless otherwise specified. To view all system and all TCA events on a given device for a time beyond an hour in the past, run:
netq <hostname> show events [between <text-time> and <text-endtime>] [json]
This example shows all system and TCA events on the leaf02 switch between now and 24 hours ago.
netq leaf02 show events between now and 24hr
cumulus@switch:~$ netq show events between now and 24hr
Matching events records:
Hostname          Message Type             Severity         Message                             Timestamp
----------------- ------------------------ ---------------- ----------------------------------- -------------------------
leaf02            btrfsinfo                critical         data storage efficiency : space lef Wed Sep  2 19:55:26 2020
                                                            t after allocation greater than chu
                                                            nk size 0.57 GB
leaf02            btrfsinfo                critical         data storage efficiency : space lef Wed Sep  2 19:25:24 2020
                                                            t after allocation greater than chu
                                                            nk size 0.57 GB
leaf02            btrfsinfo                critical         data storage efficiency : space lef Wed Sep  2 18:55:17 2020
                                                            t after allocation greater than chu
                                                            nk size 0.57 GB
leaf02            btrfsinfo                critical         data storage efficiency : space lef Wed Sep  2 18:25:16 2020
                                                            t after allocation greater than chu
                                                            nk size 0.57 GB
leaf02            btrfsinfo                critical         data storage efficiency : space lef Wed Sep  2 17:55:15 2020
                                                            t after allocation greater than chu
                                                            nk size 0.57 GB
...
This example shows all system and TCA events on the leaf01 switch between one and three days ago.
cumulus@switch:~$ netq leaf01 show events between 1d and 3d

Matching events records:
Hostname          Message Type             Severity         Message                             Timestamp
----------------- ------------------------ ---------------- ----------------------------------- -------------------------
leaf01            btrfsinfo                critical         data storage efficiency : space lef Wed Sep  9 16:14:37 2020
                                                            t after allocation greater than chu
                                                            nk size 0.57 GB
leaf01            btrfsinfo                critical         data storage efficiency : space lef Wed Sep  9 15:44:36 2020
                                                            t after allocation greater than chu
                                                            nk size 0.57 GB
leaf01            btrfsinfo                critical         data storage efficiency : space lef Wed Sep  9 15:14:35 2020
                                                            t after allocation greater than chu
                                                            nk size 0.57 GB
leaf01            btrfsinfo                critical         data storage efficiency : space lef Wed Sep  9 14:44:34 2020
                                                            t after allocation greater than chu
                                                            nk size 0.57 GB
...