Configure and Monitor What Just Happened
The What Just Happened (WJH) feature, available on NVIDIA switches, streams detailed and contextual telemetry data for analysis. This provides real-time visibility into problems in the network, such as hardware packet drops due to buffer congestion, incorrect routing, and ACL or layer 1 problems. You must have Cumulus Linux 4.0.0 or later, SONiC 202012 or later, and NetQ 2.4.0 or later to take advantage of this feature.
For a list of supported WJH events, refer to the WJH Event Messages Reference.
If you sourced your switches from a vendor other than NVIDIA, this view is blank as WJH collects no data.
When you combine WJH capabilities with NetQ, you have the ability to home in on losses, anywhere in the fabric, from a single management console. You can:
- View any current or historic drop information, including the reason for the drop
- Identify problematic flows or endpoints, and pin-point exactly where communication is failing in the network
By default, Cumulus Linux 4.0.0 and later provides the NetQ Agent and CLI. Depending on the version of Cumulus Linux running on your NVIDIA switch, you might need to upgrade the NetQ Agent and optionally the CLI to the latest release.
cumulus@<hostname>:~$ sudo apt-get update
cumulus@<hostname>:~$ sudo apt-get install -y netq-agent
cumulus@<hostname>:~$ sudo netq config restart agent
cumulus@<hostname>:~$ sudo apt-get install -y netq-apps
cumulus@<hostname>:~$ sudo netq config restart cli
Configure the WJH Feature
WJH is enabled by default on NVIDIA switches and Cumulus Linux 4.0.0 requires no configuration; however, you must enable the NetQ Agent to collect the data.
To enable WJH in NetQ on any switch or server:
Configure the NetQ Agent on the NVIDIA switch.
cumulus@switch:~$ sudo netq config add agent wjhRestart the NetQ Agent to start collecting the WJH data.
cumulus@switch:~$ sudo netq config restart agent
When you finish viewing the WJH metrics, you might want to stop the NetQ Agent from collecting WJH data to reduce network traffic. Use netq config del agent wjh followed by netq config restart agent to disable the WJH feature on the given switch.
Using wjh_dump.py on an NVIDIA platform that is running Cumulus Linux and the NetQ agent causes the NetQ WJH client to stop receiving packet drop call backs. To prevent this issue, run wjh_dump.py on a different system than the one where the NetQ Agent has WJH enabled, or disable wjh_dump.py and restart the NetQ Agent (run netq config restart agent).
Configure Latency and Congestion Thresholds
WJH latency and congestion metrics depend on threshold settings to trigger the events. WJH measures packet latency as the time spent inside a single system (switch). WJH measures congestion as a percentage of buffer occupancy on the switch. When specified, WJH triggers events when they cross high and/or low thresholds.
To configure these thresholds, run:
netq config add agent wjh-threshold (latency|congestion) <text-tc-list> <text-port-list> <text-th-hi> <text-th-lo>
You can specify multiple traffic classes and multiple ports by separating the classes or ports by a comma (no spaces).
This example creates latency thresholds for Class 3 traffic on port swp1 where the upper threshold is 10 and the lower threshold is 1.
cumulus@switch:~$ sudo netq config add agent wjh-threshold latency 3 swp1 10 1
This example creates congestion thresholds for Class 4 traffic on port swp1 where the upper threshold is 200 and the lower threshold is 10.
cumulus@switch:~$ sudo netq config add agent wjh-threshold congestion 4 swp1 200 10
Configure Filters
You can filter the WJH events at the NetQ Agent before the NetQ system processes it. You perform filtering on a drop-type basis. You can filter the drop type further by specifying one or more drop reasons or severity. Filter events by creating a NetQ Configuration profile in the NetQ UI or using the netq config add agent wjh-drop-filter command in the NetQ CLI.
For a complete list of drop types and reasons, refer to the WJH Event Messages Reference.
To configure the NetQ Agent to filter WJH drops:
Click
 (Upgrade) in a workbench header.
Click Configuration Management.
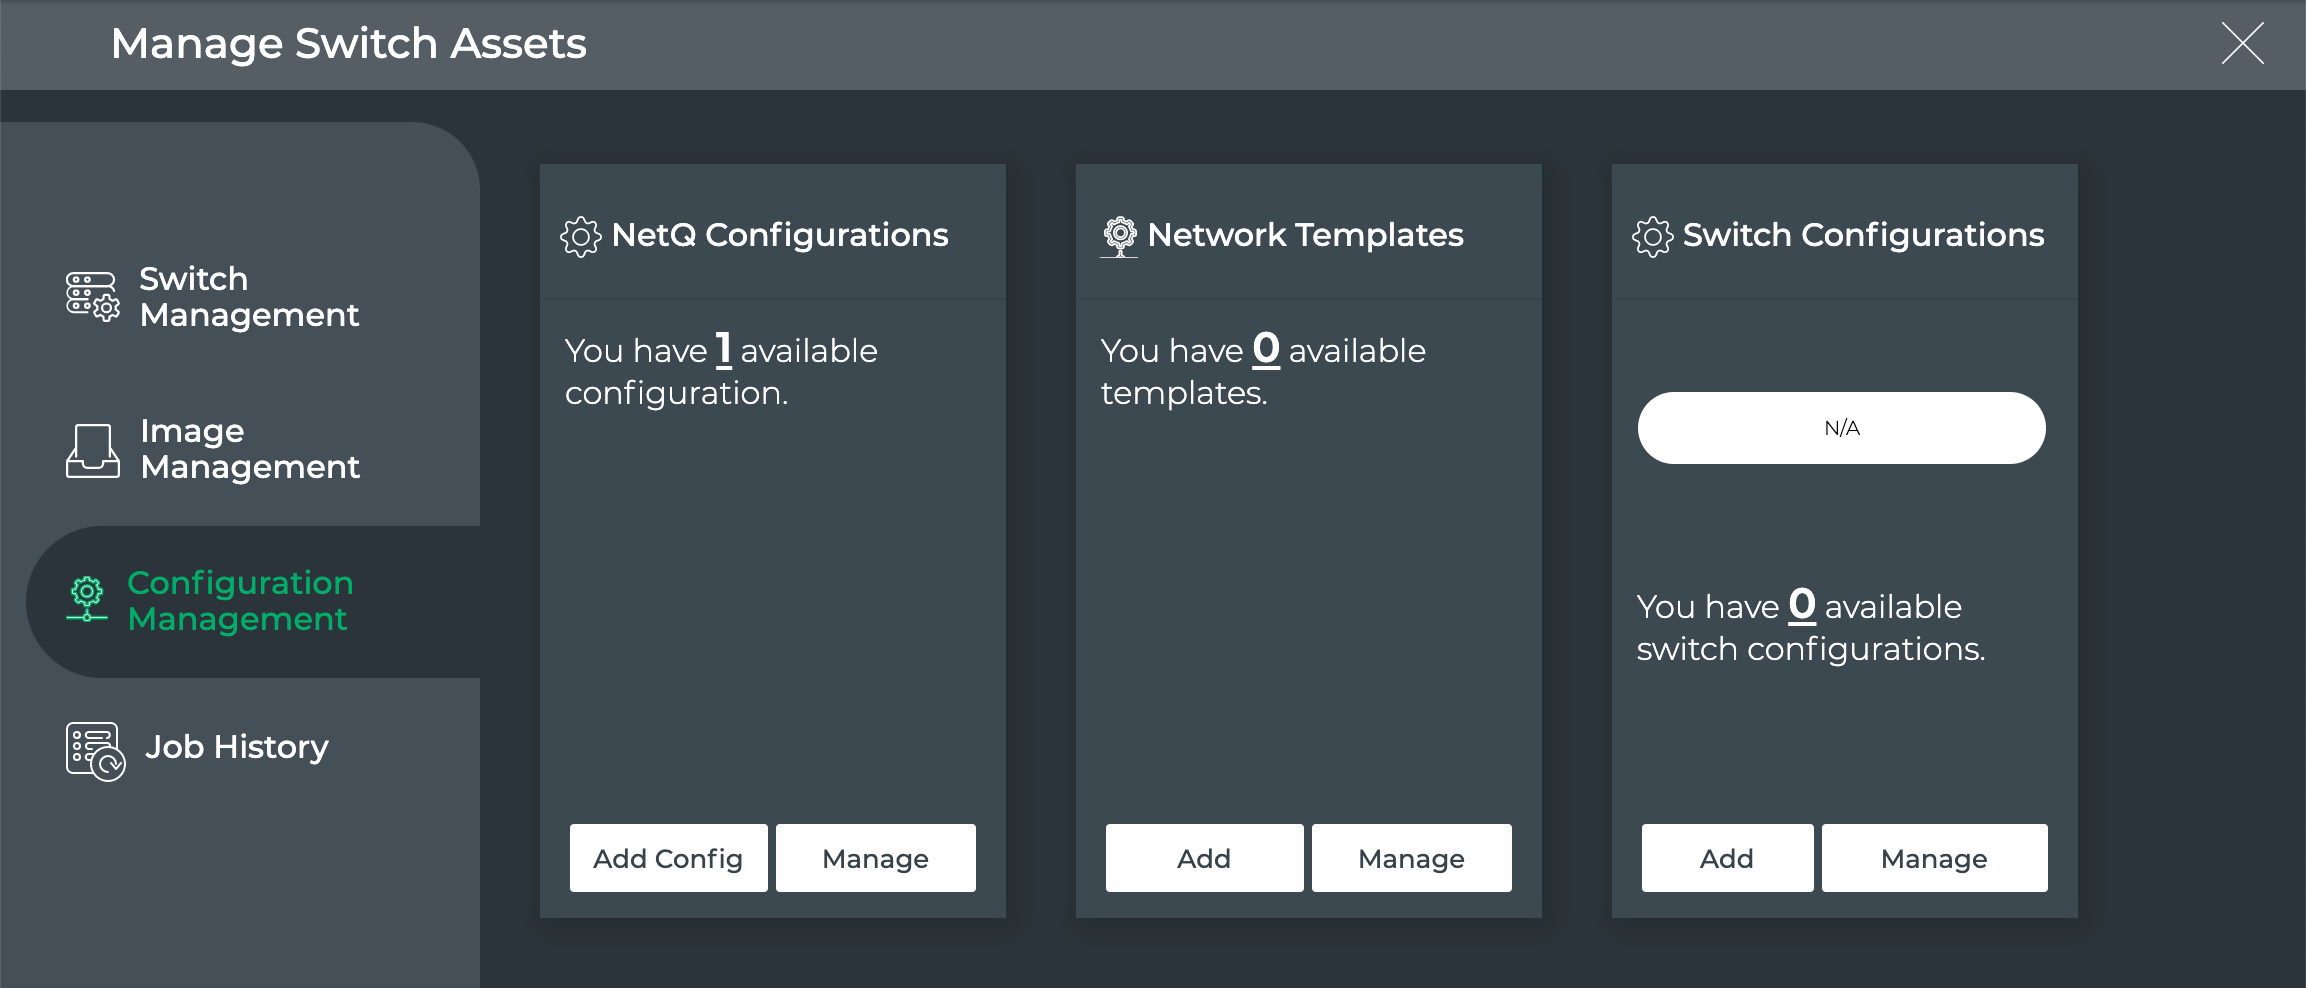
On the NetQ Configurations card, click Add Config.
Click Enable to enable WJH, then click Customize.
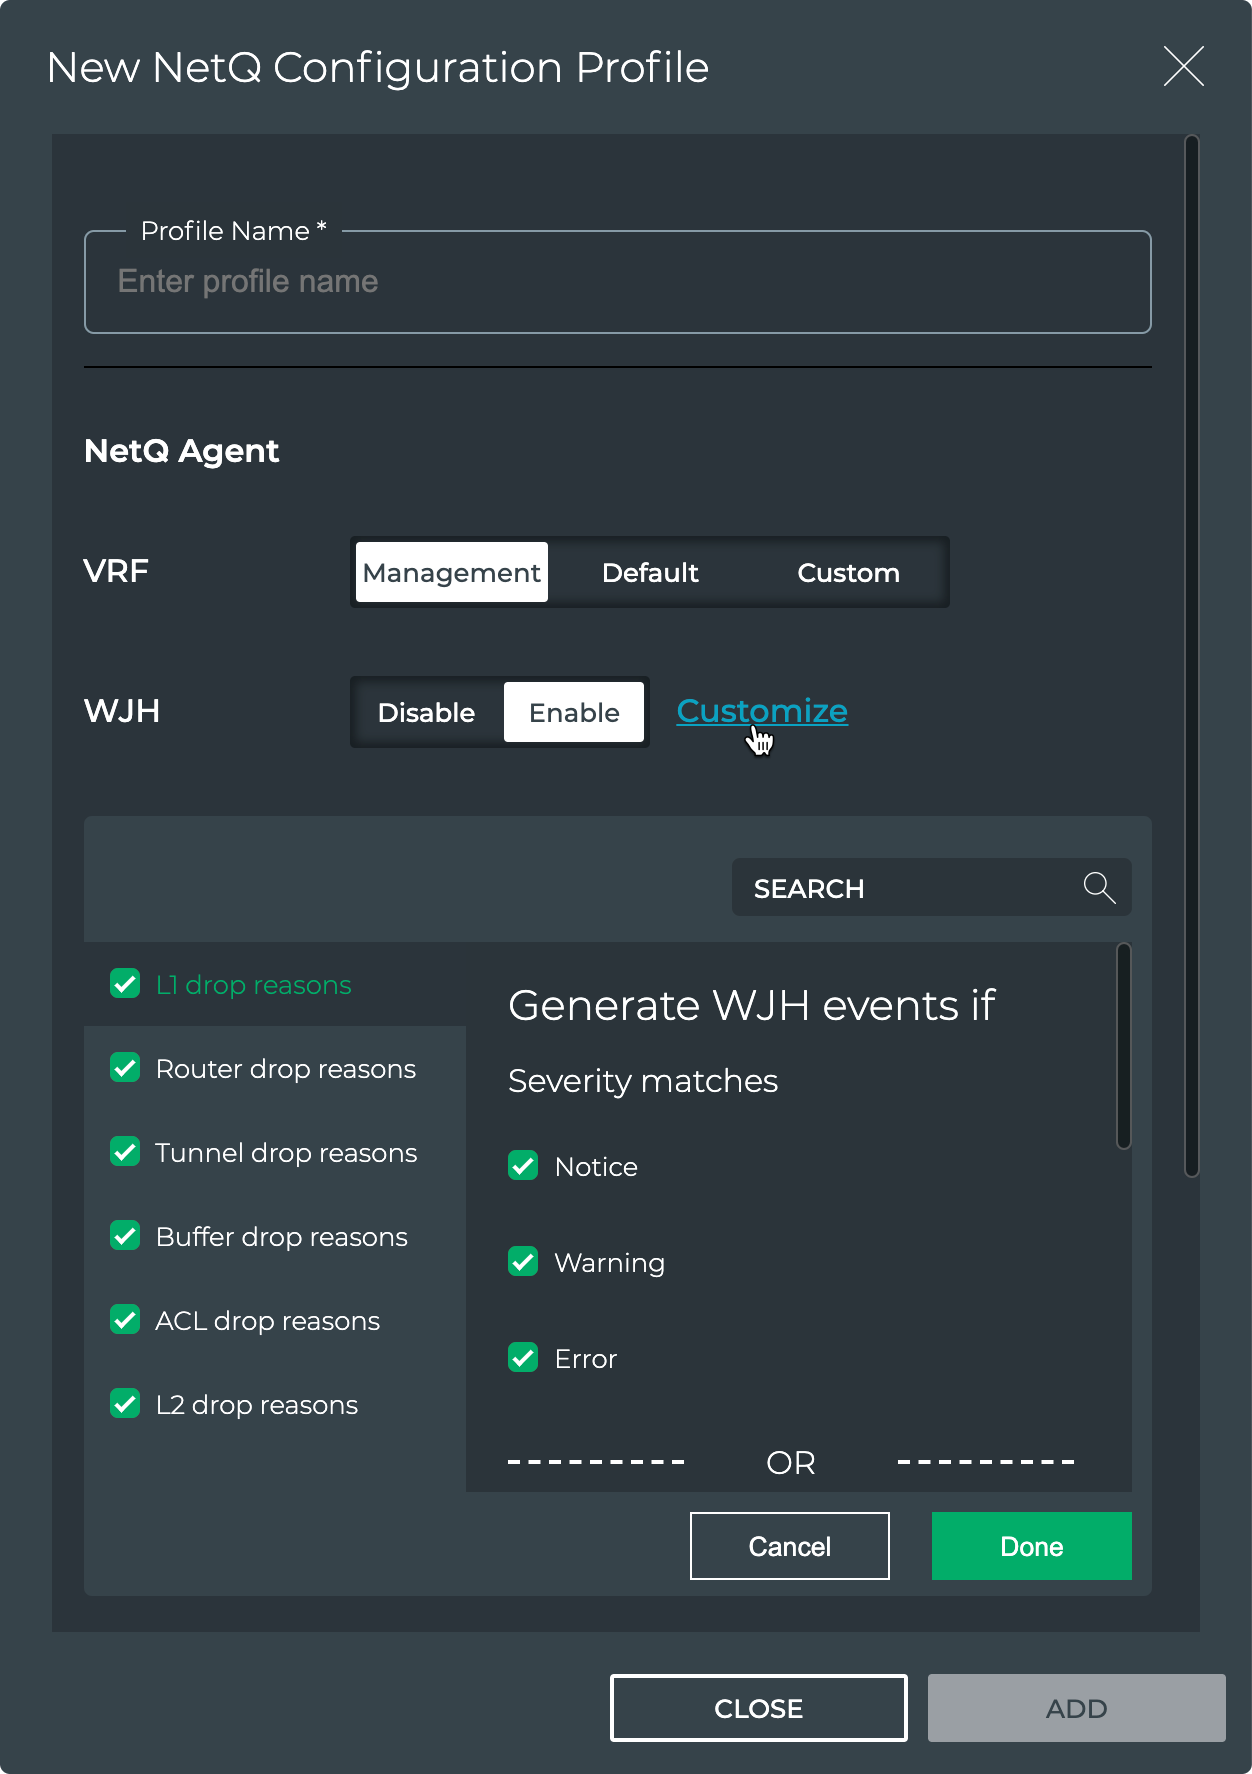
By default, WJH includes all drop reasons and severities. Uncheck any drop reasons or severity you do not want to use to generate WJH events, then click Done.
Click Add to save the configuration profile, or click Close to discard it.
To configure the NetQ Agent to filter WJH drops, run:
netq config add agent wjh-drop-filter drop-type <text-wjh-drop-type> [drop-reasons <text-wjh-drop-reasons>] [severity <text-drop-severity-list>]
Use tab complete to view the available drop type, drop reason, and severity values.
This example configures the NetQ Agent to drop all L1 drops.
cumulus@switch:~$ sudo netq config add agent wjh-drop-filter drop-type l1
This example configures the NetQ Agent to drop only the L1 drops with bad signal integrity.
cumulus@switch:~$ sudo netq config add agent wjh-drop-filter drop-type l1 drop-reasons BAD_SIGNAL_INTEGRITY
This example configures the NetQ Agent to drop only router drops with warning severity.
cumulus@switch:~$ sudo netq config add agent wjh-drop-filter drop-type router severity Warning
This example configures the NetQ Agent to drop only router drops due to blackhole routes.
cumulus@netq-ts:~$ netq config add agent wjh-drop-filter drop-type router drop-reasons BLACKHOLE_ROUTE
This example configures the NetQ Agent to drop only router drops when the source IP is a class E address.
cumulus@netq-ts:~$ netq config add agent wjh-drop-filter drop-type router drop-reasons SRC_IP_IS_IN_CLASS_E
View What Just Happened Metrics
You can view the WJH metrics from the NetQ UI or the NetQ CLI.
Click
 (main menu).
Click What Just Happened under the Network column.
This view displays events based on conditions detected in the data plane. Each drop category contains the most recent 1000 events from the last 24 hours.
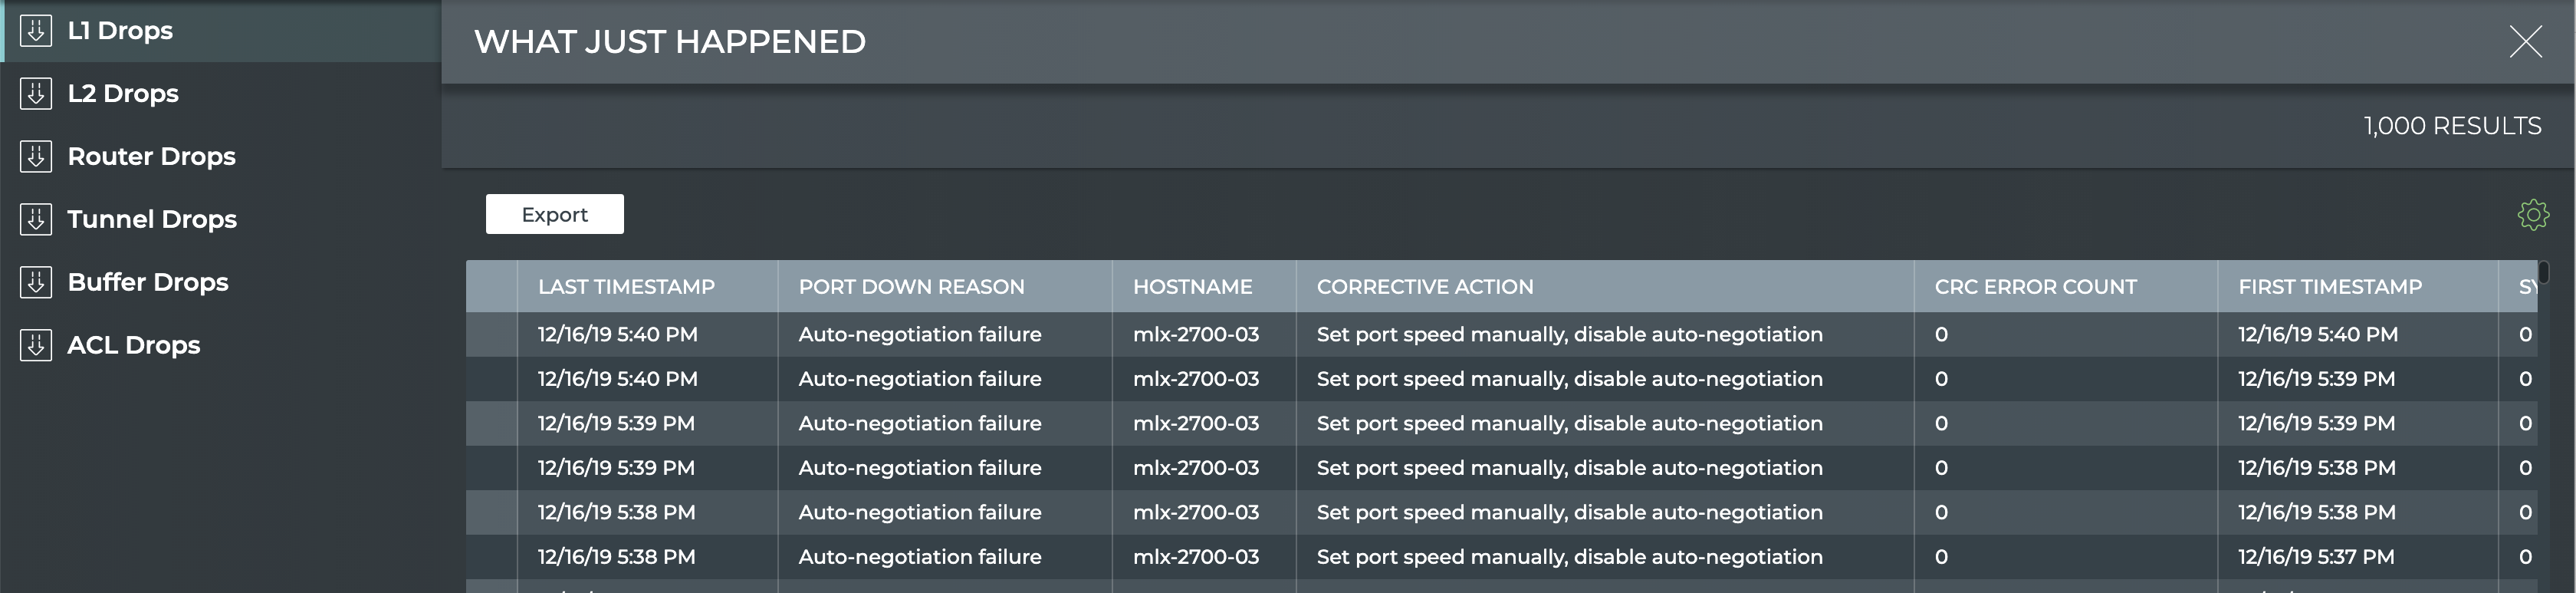
- By default the layer 1 drops are shown. Click one of the other drop categories to view those drops for all devices.
Run one of the following commands:
netq [<hostname>] show wjh-drop <text-drop-type> [ingress-port <text-ingress-port>] [severity <text-severity>] [reason <text-reason>] [src-ip <text-src-ip>] [dst-ip <text-dst-ip>] [proto <text-proto>] [src-port <text-src-port>] [dst-port <text-dst-port>] [src-mac <text-src-mac>] [dst-mac <text-dst-mac>] [egress-port <text-egress-port>] [traffic-class <text-traffic-class>] [rule-id-acl <text-rule-id-acl>] [between <text-time> and <text-endtime>] [around <text-time>] [json]
netq [<hostname>] show wjh-drop [ingress-port <text-ingress-port>] [severity <text-severity>] [details] [between <text-time> and <text-endtime>] [around <text-time>] [json]
Use the various options to restrict the output accordingly.
This example uses the first form of the command to show drops on switch leaf03 for the past week.
cumulus@switch:~$ netq leaf03 show wjh-drop between now and 7d
Matching wjh records:
Drop type          Aggregate Count
------------------ ------------------------------
L1                 560
Buffer             224
Router             144
L2                 0
ACL                0
Tunnel             0
This example uses the second form of the command to show drops on switch leaf03 for the past week including the drop reasons.
cumulus@switch:~$ netq leaf03 show wjh-drop details between now and 7d

Matching wjh records:
Drop type          Aggregate Count                Reason
------------------ ------------------------------ ---------------------------------------------
L1                 556                            None
Buffer             196                            WRED
Router             144                            Blackhole route
Buffer             14                             Packet Latency Threshold Crossed
Buffer             14                             Port TC Congestion Threshold
L1                 4                              Oper down
This example shows the drops seen at layer 2 across the network.
cumulus@mlx-2700-03:mgmt:~$ netq show wjh-drop l2
Matching wjh records:
Hostname          Ingress Port             Reason                                        Agg Count          Src Ip           Dst Ip           Proto  Src Port         Dst Port         Src Mac            Dst Mac            First Timestamp                Last Timestamp
----------------- ------------------------ --------------------------------------------- ------------------ ---------------- ---------------- ------ ---------------- ---------------- ------------------ ------------------ ------------------------------ ----------------------------
mlx-2700-03       swp1s2                   Port loopback filter                          10                 27.0.0.19        27.0.0.22        0      0                0                00:02:00:00:00:73  0c:ff:ff:ff:ff:ff  Mon Dec 16 11:54:15 2019       Mon Dec 16 11:54:15 2019
mlx-2700-03       swp1s2                   Source MAC equals destination MAC             10                 27.0.0.19        27.0.0.22        0      0                0                00:02:00:00:00:73  00:02:00:00:00:73  Mon Dec 16 11:53:17 2019       Mon Dec 16 11:53:17 2019
mlx-2700-03       swp1s2                   Source MAC equals destination MAC             10                 0.0.0.0          0.0.0.0          0      0                0                00:02:00:00:00:73  00:02:00:00:00:73  Mon Dec 16 11:40:44 2019       Mon Dec 16 11:40:44 2019
The following two examples include the severity of a drop event (error, warning or notice) for ACLs and routers.
cumulus@switch:~$ netq show wjh-drop acl
Matching wjh records:
Hostname          Ingress Port             Reason                                        Severity         Agg Count          Src Ip           Dst Ip           Proto  Src Port         Dst Port         Src Mac            Dst Mac            Acl Rule Id            Acl Bind Point               Acl Name         Acl Rule         First Timestamp                Last Timestamp
----------------- ------------------------ --------------------------------------------- ---------------- ------------------ ---------------- ---------------- ------ ---------------- ---------------- ------------------ ------------------ ---------------------- ---------------------------- ---------------- ---------------- ------------------------------ ----------------------------
leaf01            swp2                     Ingress router ACL                            Error            49                 55.0.0.1         55.0.0.2         17     8492             21423            00:32:10:45:76:89  00:ab:05:d4:1b:13  0x0                    0                                                              Tue Oct  6 15:29:13 2020       Tue Oct  6 15:29:39 2020
cumulus@switch:~$ netq show wjh-drop router
Matching wjh records:
Hostname          Ingress Port             Reason                                        Severity         Agg Count          Src Ip           Dst Ip           Proto  Src Port         Dst Port         Src Mac            Dst Mac            First Timestamp                Last Timestamp
----------------- ------------------------ --------------------------------------------- ---------------- ------------------ ---------------- ---------------- ------ ---------------- ---------------- ------------------ ------------------ ------------------------------ ----------------------------
leaf01            swp1                     Blackhole route                               Notice           36                 46.0.1.2         47.0.2.3         6      1235             43523            00:01:02:03:04:05  00:06:07:08:09:0a  Tue Oct  6 15:29:13 2020       Tue Oct  6 15:29:47 2020
Collect WJH Data Using gNMI
You can use gNMI, the gRPC network management interface, to collect What Just Happened data from the NetQ Agent and export it to your own gNMI client.
The client should use the following YANG model as a reference:
Supported Features
In this release, the gNMI agent supports capability and stream subscribe requests for WJH events.
Configure the gNMI Agent
To configure the gNMI agent, you need to enable it on every switch you want to use with gNMI. Optionally, you can update these default settings:
- Log level: The default log level is info. You can change the default setting to debug, warning, or error.
- Default gNMI port: The gNMI agent listens over port 9339 by default. You can change this setting in case you use that port in another application.
The /etc/netq/netq.yml file stores the configuration.
To configure the gNMI agent on a switch:
Enable the gNMI agent:
cumulus@switch:~$ netq config add agent gnmi-enable trueIf you want to change the default log level to something other than info (choose from debug, warning, or error), run:
cumulus@switch:~$ netq config add agent gnmi-log-level [debug|warning|error]If you want to change the default port over which the gNMI agent listens, run:
cumulus@switch:~$ netq config add agent gnmi-port <gnmi_port>Restart the NetQ Agent:
cumulus@switch:~$ netq config restart agent
gNMI Client Requests
You use your gNMI client on a host server to request capabilities and data the agent is subscribed to.
To make a subscribe request, run:
[root@host ~]# /path/to/your/gnmi_client/gnmi_client -gnmi_address 10.209.37.84 -request subscribe
2021/05/06 18:33:10.142160 host gnmi_client[24847]: INFO: 10.209.37.84:9339: ready for streaming
2021/05/06 18:33:10.220814 host gnmi_client[24847]: INFO: sync response received: sync_response:true
2021/05/06 18:33:16.813000 host gnmi_client[24847]: INFO: update received [interfaces interface swp8 wjh aggregate l2 reason 209 error]: {"Drop":[{"AggCount":1,"Dip":"1.2.0.0","Dmac":"00:bb:cc:11:22:32","Dport":0,"DropType":"L2","EgressPort":"","EndTimestamp":1620326044,"FirstTimestamp":1620326044,"IngressLag":"","IngressPort":"swp8","Proto":0,"Reason":"Source MAC is multicast","Severity":"Error","Sip":"10.213.1.242","Smac":"ff:ff:ff:ff:ff:ff","Sport":0}],"Id":209,"Severity":"Error"}
2021/05/06 18:33:16.815068 host gnmi_client[24847]: INFO: update received [interfaces interface swp8 wjh aggregate l2 reason 209 error]: {"Drop":[{"AggCount":1,"Dip":"1.2.0.0","Dmac":"00:bb:cc:11:22:32","Dport":0,"DropType":"L2","EgressPort":"","EndTimestamp":1620326044,"FirstTimestamp":1620326044,"IngressLag":"","IngressPort":"swp8","Proto":0,"Reason":"Source MAC is multicast","Severity":"Error","Sip":"10.213.2.242","Smac":"ff:ff:ff:ff:ff:ff","Sport":0}],"Id":209,"Severity":"Error"}
2021/05/06 18:33:16.818896 host gnmi_client[24847]: INFO: update received [interfaces interface swp8 wjh aggregate l2 reason 209 error]: {"Drop":[{"AggCount":1,"Dip":"1.2.0.0","Dmac":"00:bb:cc:11:22:32","Dport":0,"DropType":"L2","EgressPort":"","EndTimestamp":1620326044,"FirstTimestamp":1620326044,"IngressLag":"","IngressPort":"swp8","Proto":0,"Reason":"Source MAC is multicast","Severity":"Error","Sip":"10.213.3.242","Smac":"ff:ff:ff:ff:ff:ff","Sport":0}],"Id":209,"Severity":"Error"}
2021/05/06 18:33:16.823091 host gnmi_client[24847]: INFO: update received [interfaces interface swp8 wjh aggregate l2 reason 209 error]: {"Drop":[{"AggCount":1,"Dip":"1.2.0.0","Dmac":"00:bb:cc:11:22:32","Dport":0,"DropType":"L2","EgressPort":"","EndTimestamp":1620326044,"FirstTimestamp":1620326044,"IngressLag":"","IngressPort":"swp8","Proto":0,"Reason":"Source MAC is multicast","Severity":"Error","Sip":"10.213.4.242","Smac":"ff:ff:ff:ff:ff:ff","Sport":0}],"Id":209,"Severity":"Error"}
...
To request the capabilities, run:
[root@host ~]# /path/to/your/gnmi_client/gnmi_client/gnmi_client -gnmi_address 10.209.37.84 -request capabilities
2021/05/06 18:36:31.285648 host gnmi_client[25023]: INFO: 10.209.37.84:9339: ready for streaming
2021/05/06 18:36:31.355944 host gnmi_client[25023]: INFO: capability response: supported_models:{name:"WjhDropAggregate"  organization:"NVIDIA"  version:"0.1"}  supported_encodings:JSON  supported_encodings:JSON_IETF
Use Only the gNMI Agent
It is possible (although it is not recommended) to collect data using only the gNMI agent, and not the NetQ Agent. However, this sends data only to gNMI and not to NetQ.
To use only gNMI for data collection, disable the NetQ Agent, which is always enabled by default:
cumulus@switch:~$ netq config add agent opta-enable false
You cannot disable both the NetQ Agent and the gNMI agent.
WJH Drop Reasons
The data NetQ sends to the gNMI agent is in the form of WJH drop reasons. The reasons are generated by the SDK and are stored in the /usr/etc/wjh_lib_conf.xml file on the switch and. Use this file as a guide to filter for specific reason types (L1, ACL, and so forth), reason IDs, and/or event severities.
L1 Drop Reasons
| Reason ID | Reason | Description |
|---|---|---|
| 10021 | Port admin down | Validate port configuration |
| 10022 | Auto-negotiation failure | Set port speed manually, disable auto-negotiation |
| 10023 | Logical mismatch with peer link | Check cable/transceiver |
| 10024 | Link training failure | Check cable/transceiver |
| 10025 | Peer is sending remote faults | Replace cable/transceiver |
| 10026 | Bad signal integrity | Replace cable/transceiver |
| 10027 | Cable/transceiver is not supported | Use supported cable/transceiver |
| 10028 | Cable/transceiver is unplugged | Plug cable/transceiver |
| 10029 | Calibration failure | Check cable/transceiver |
| 10030 | Cable/transceiver bad status | Check cable/transceiver |
| 10031 | Other reason | Other L1 drop reason |
L2 Drop Reasons
| Reason ID | Reason | Severity | Description |
|---|---|---|---|
| 201 | MLAG port isolation | Notice | Expected behavior |
| 202 | Destination MAC is reserved (DMAC=01-80-C2-00-00-0x) | Error | Bad packet was received from the peer |
| 203 | VLAN tagging mismatch | Error | Validate the VLAN tag configuration on both ends of the link |
| 204 | Ingress VLAN filtering | Error | Validate the VLAN membership configuration on both ends of the link |
| 205 | Ingress spanning tree filter | Notice | Expected behavior |
| 206 | Unicast MAC table action discard | Error | Validate MAC table for this destination MAC |
| 207 | Multicast egress port list is empty | Warning | Validate why IGMP join or multicast router port does not exist |
| 208 | Port loopback filter | Error | Validate MAC table for this destination MAC |
| 209 | Source MAC is multicast | Error | Bad packet was received from peer |
| 210 | Source MAC equals destination MAC | Error | Bad packet was received from peer |
Router Drop Reasons
| Reason ID | Reason | Severity | Description |
|---|---|---|---|
| 301 | Non-routable packet | Notice | Expected behavior |
| 302 | Blackhole route | Warning | Validate routing table for this destination IP |
| 303 | Unresolved neighbor/next hop | Warning | Validate ARP table for the neighbor/next hop |
| 304 | Blackhole ARP/neighbor | Warning | Validate ARP table for the next hop |
| 305 | IPv6 destination in multicast scope FFx0:/16 | Notice | Expected behavior - packet is not routable |
| 306 | IPv6 destination in multicast scope FFx1:/16 | Notice | Expected behavior - packet is not routable |
| 307 | Non IP packet | Notice | Destination MAC is the router, packet is not routable |
| 308 | Unicast destination IP but multicast destination MAC | Error | Bad packet was received from the peer |
| 309 | Destination IP is loopback address | Error | Bad packet was received from the peer |
| 310 | Source IP is multicast | Error | Bad packet was received from the peer |
| 311 | Source IP is in class E | Error | Bad packet was received from the peer |
| 312 | Source IP is loopback address | Error | Bad packet was received from the peer |
| 313 | Source IP is unspecified | Error | Bad packet was received from the peer |
| 314 | Checksum or IPver or IPv4 IHL too short | Error | Bad cable or bad packet was received from the peer |
| 315 | Multicast MAC mismatch | Error | Bad packet was received from the peer |
| 316 | Source IP equals destination IP | Error | Bad packet was received from the peer |
| 317 | IPv4 source IP is limited broadcast | Error | Bad packet was received from the peer |
| 318 | IPv4 destination IP is local network (destination=0.0.0.0/8) | Error | Bad packet was received from the peer |
| 320 | Ingress router interface is disabled | Warning | Validate your configuration |
| 321 | Egress router interface is disabled | Warning | Validate your configuration |
| 323 | IPv4 routing table (LPM) unicast miss | Warning | Validate routing table for this destination IP |
| 324 | IPv6 routing table (LPM) unicast miss | Warning | Validate routing table for this destination IP |
| 325 | Router interface loopback | Warning | Validate the interface configuration |
| 326 | Packet size is larger than router interface MTU | Warning | Validate the router interface MTU configuration |
| 327 | TTL value is too small | Warning | Actual path is longer than the TTL |
Tunnel Drop Reasons
| Reason ID | Reason | Severity | Description |
|---|---|---|---|
| 402 | Overlay switch - Source MAC is multicast | Error | The peer sent a bad packet |
| 403 | Overlay switch - Source MAC equals destination MAC | Error | The peer sent a bad packet |
| 404 | Decapsulation error | Error | The peer sent a bad packet |
ACL Drop Reasons
| Reason ID | Reason | Severity | Description |
|---|---|---|---|
| 601 | Ingress port ACL | Notice | Validate ACL configuration |
| 602 | Ingress router ACL | Notice | Validate ACL configuration |
| 603 | Egress router ACL | Notice | Validate ACL configuration |
| 604 | Egress port ACL | Notice | Validate ACL configuration |
Buffer Drop Reasons
| Reason ID | Reason | Severity | Description |
|---|---|---|---|
| 503 | Tail drop | Warning | Monitor network congestion |
| 504 | WRED | Warning | Monitor network congestion |
| 505 | Port TC Congestion Threshold Crossed | Notice | Monitor network congestion |
| 506 | Packet Latency Threshold Crossed | Notice | Monitor network congestion |