Monitor Switch Inventory
With the NetQ UI and NetQ CLI, you can monitor your inventory of switches across the network or individually. A user can monitor such items as operating system, motherboard, ASIC, microprocessor, disk, memory, fan and power supply information. Being able to monitor this inventory aids in upgrades, compliance, and other planning tasks.
The commands and cards available to obtain this type of information help you to answer questions such as:
- What hardware is installed on my switch?
- How many transmit and receive packets have been dropped?
- How healthy are the fans and power supply?
- What software is installed on my switch?
- What is the ACL and forwarding resources usage?
To monitor networkwide inventory, refer to Monitor Networkwide Inventory.
Access Switch Inventory Data
The NetQ UI provides the Inventory | Switches card for monitoring the hardware and software component inventory on switches running NetQ in your network. Access this card from the NetQ Workbench, or add it to your own workbench by clicking ![]() (Add card) > Inventory > Inventory|Switches card > Open Cards.
(Add card) > Inventory > Inventory|Switches card > Open Cards.
The CLI provides detailed switch inventory information through its netq <hostname> show inventory command.
View Switch Inventory Summary
Component information for all of the switches in your network can be viewed from both the NetQ UI and NetQ CLI.
- Inventory|Switches card:
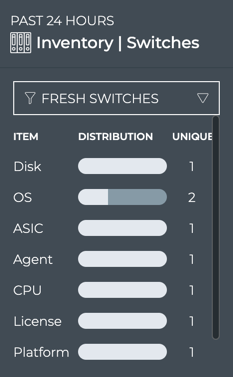
- Small: view count of switches and distribution of switch status
- Medium: view count of OS, ASIC, platform, CPU model, Disk, and memory types or versions across all switches
netq show inventorycommand: -View ASIC, CPU, disk, OS, and ports on all switches
View the Number of Types of Any Component Deployed
For each of the components monitored on a switch, NetQ displays the variety of those component by way of a count. For example, if you have four operating systems running on your switches, say Cumulus Linux, SONiC, Ubuntu and RHEL, NetQ indicates a total unique count of three OSs. If you only use Cumulus Linux, then the count shows as one.
To view this count for all of the components on the switch:
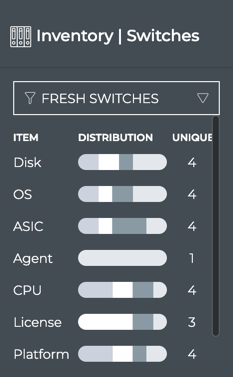
- Open the medium Switch Inventory card.
Note the number in the Unique column for each component.
In the above example, there are four different disk sizes deployed, four different OSs running, four different ASIC vendors and models deployed, and so forth.
Scroll down to see additional components.
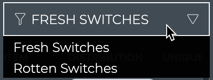
By default, the data is shown for switches with a fresh communication status. You can choose to look at the data for switches in the rotten state instead. For example, if you wanted to see if there was any correlation to a version of OS to the switch having a rotten status, you could select Rotten Switches from the dropdown at the top of the card and see if they all use the same OS (count would be 1). It might not be the cause of the lack of communication, but you get the idea.
View the Distribution of Any Component Deployed
NetQ monitors a number of switch components. For each component you can view the distribution of versions or models or vendors deployed across your network for that component.
To view the distribution:
Locate the Inventory|Switches card on your workbench.
From the medium or large card, view the distribution of hardware and software components across the network.
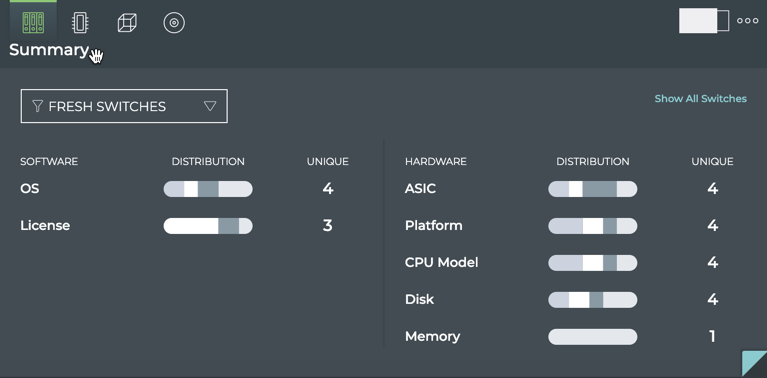
Hover over any of the segments in the distribution chart to highlight a specific component. Scroll down to view additional components.
When you hover, a tooltip appears displaying:
- Name or value of the component type, such as the version number or status
- Total number of switches with that type of component deployed compared to the total number of switches
- Percentage of this type with respect to all component types
On the large Switch Inventory card, hovering also highlights the related components for the selected component.
Choose Rotten Switches from the dropdown to see which, if any, switches are currently not communicating with NetQ.
- Return to your fresh switches, then hover over the card header and change to the small size card using the size picker.
To view the hardware and software components for a switch, run:
netq <hostname> show inventory brief
This example shows the type of switch (Cumulus VX), operating system (Cumulus Linux), CPU (x86_62), and ASIC (virtual) for the spine01 switch.
cumulus@switch:~$ netq spine01 show inventory brief
Matching inventory records:
Hostname          Switch               OS              CPU      ASIC            Ports
----------------- -------------------- --------------- -------- --------------- -----------------------------------
spine01           VX                   CL              x86_64   VX              N/A
This example show the components on the NetQ On-premises or Cloud Appliance.
cumulus@switch:~$ netq show inventory brief opta
Matching inventory records:
Hostname          Switch               OS              CPU      ASIC            Ports
----------------- -------------------- --------------- -------- --------------- -----------------------------------
netq-ts           N/A                  Ubuntu          x86_64   N/A             N/A
View Switch Hardware Inventory
You can view hardware components deployed on each switch in your network.
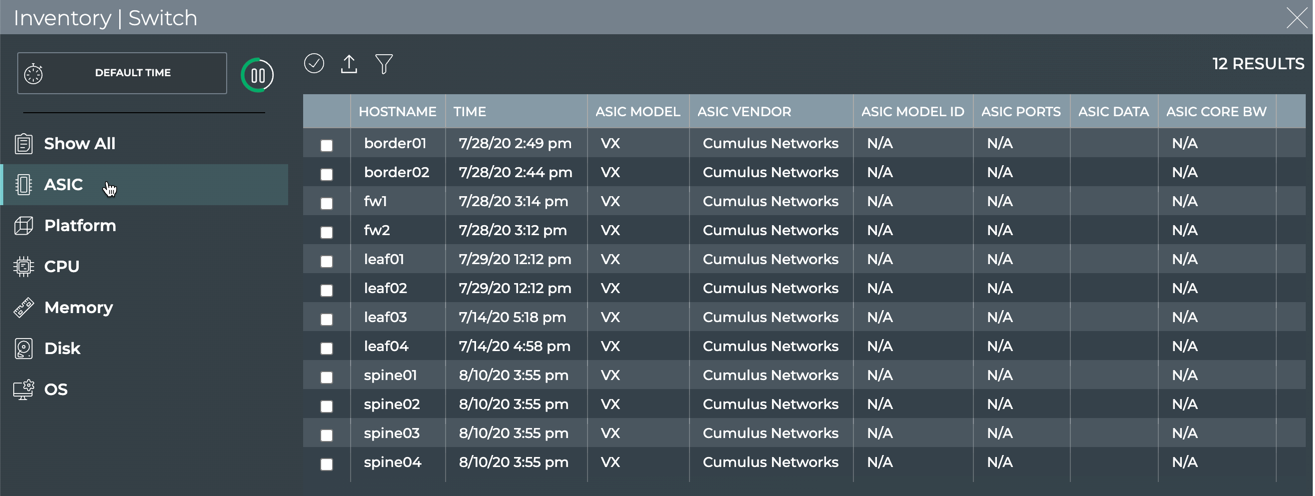
View ASIC Information for a Switch
You can view the ASIC information for a switch from either the NetQ CLI or NetQ UI.
Locate the medium Inventory|Switches card on your workbench.
Change to the full-screen card and click ASIC.
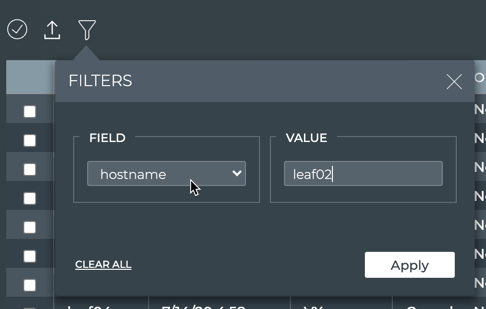
Click
 to quickly locate a switch that does not appear on the first page of the switch list.
Select hostname from the Field dropdown.
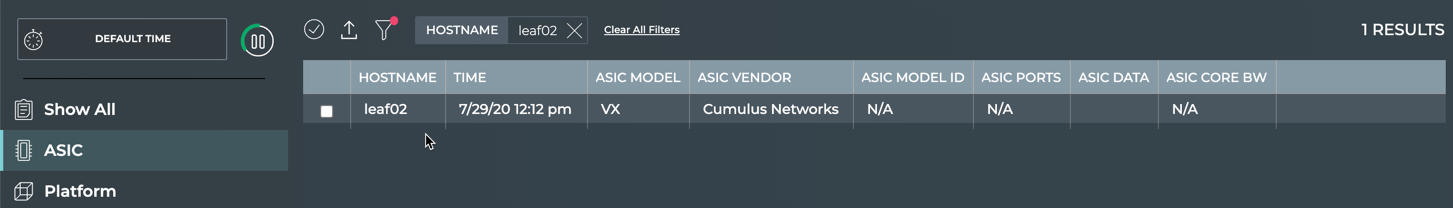
Enter the hostname of the switch you want to view, and click Apply.
- To return to your workbench, click
 in the top right corner of the card.
To view information about the ASIC on a switch, run:
netq [<hostname>] show inventory asic [opta] [json]
This example shows the ASIC information for the leaf02 switch.
cumulus@switch:~$ netq leaf02 show inventory asic
Matching inventory records:
Hostname          Vendor               Model                          Model ID                  Core BW        Ports
----------------- -------------------- ------------------------------ ------------------------- -------------- -----------------------------------
leaf02            Mellanox             Spectrum                       MT52132                   N/A            32 x 100G-QSFP28
This example shows the ASIC information for the NetQ On-premises or Cloud Appliance.
cumulus@switch:~$ netq show inventory asic opta
Matching inventory records:
Hostname          Vendor               Model                          Model ID                  Core BW        Ports
----------------- -------------------- ------------------------------ ------------------------- -------------- -----------------------------------
netq-ts            Mellanox             Spectrum                       MT52132                   N/A            32 x 100G-QSFP28
View Motherboard Information for a Switch
Motherboard/platform information is available from the NetQ UI and NetQ CLI.
- Inventory|Switches card
- Medium/Large: view platform distribution across on all switches (graphic)
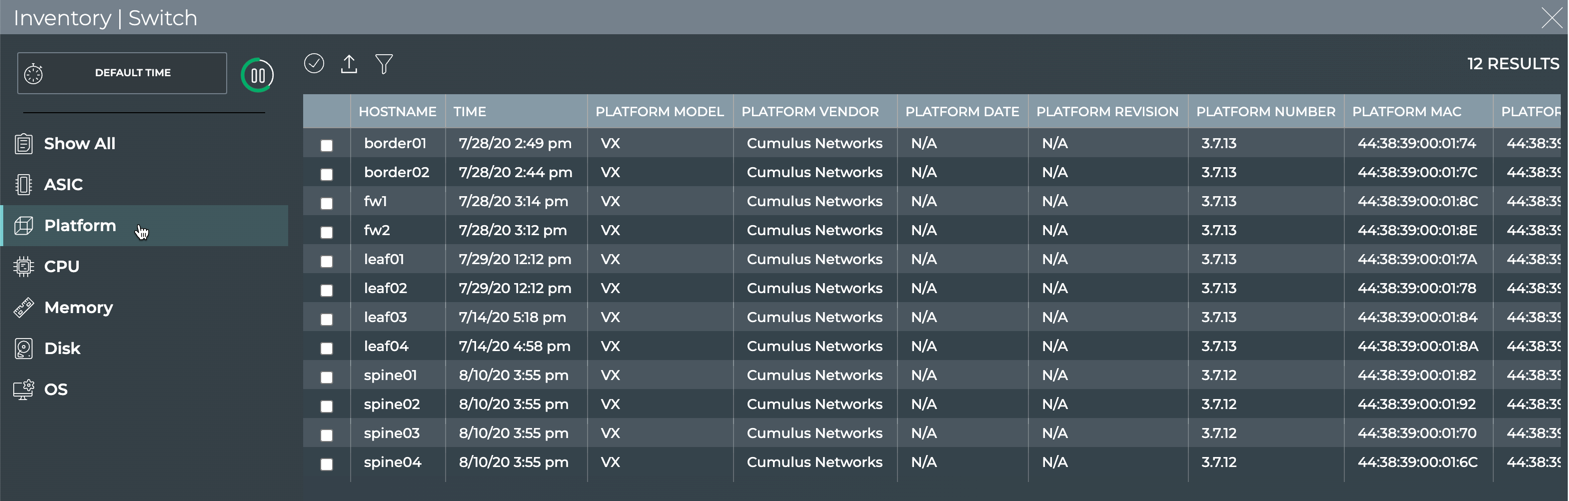
- Full-screen: view platform vendor, model, manufacturing date, revision, serial number, MAC address, series for a switch (table)
netq show inventory boardcommand- View motherboard vendor, model, base MAC address, serial number, part number, revision, and manufacturing date on a switch
Locate the medium Inventory|Switches card on your workbench.
Hover over the card, and change to the full-screen card using the size picker.
Click Platform.
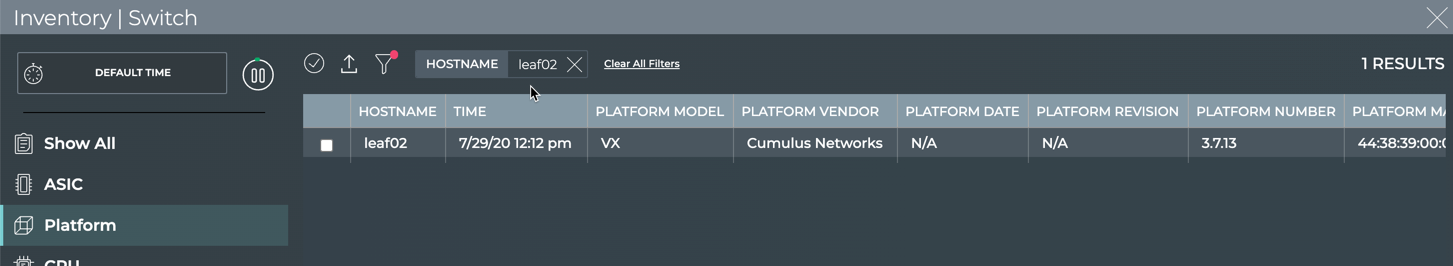
Click
to quickly locate a switch that does not appear on the first page of the switch list.Select hostname from the Field dropdown.
Enter the hostname of the switch you want to view, and click Apply.
- To return to your workbench, click in the top right corner of the card.
To view a list of motherboards installed in a switch, run:
netq [<hostname>] show inventory board [opta] [json]
This example shows all motherboard data for the spine01 switch.
cumulus@switch:~$ netq spine01 show inventory board
Matching inventory records:
Hostname          Vendor               Model                          Base MAC           Serial No                 Part No          Rev    Mfg Date
----------------- -------------------- ------------------------------ ------------------ ------------------------- ---------------- ------ ----------
spine01           Dell                 S6000-ON                       44:38:39:00:80:00  N/A                       N/A              N/A    N/A
Use the opta option without the hostname option to view the motherboard data for the NetQ On-premises or Cloud Appliance. No motherboard data is available for NetQ On-premises or Cloud VMs.
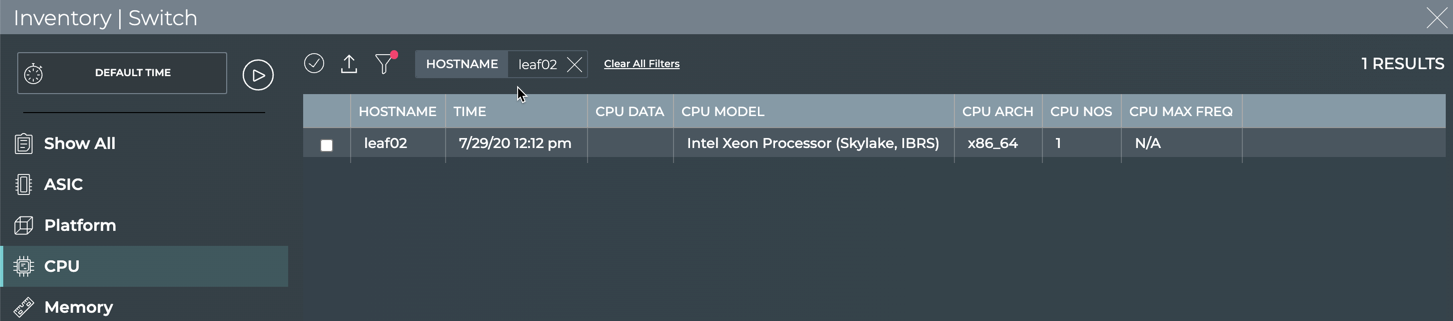
View CPU Information for a Switch
CPU information is available from the NetQ UI and NetQ CLI.
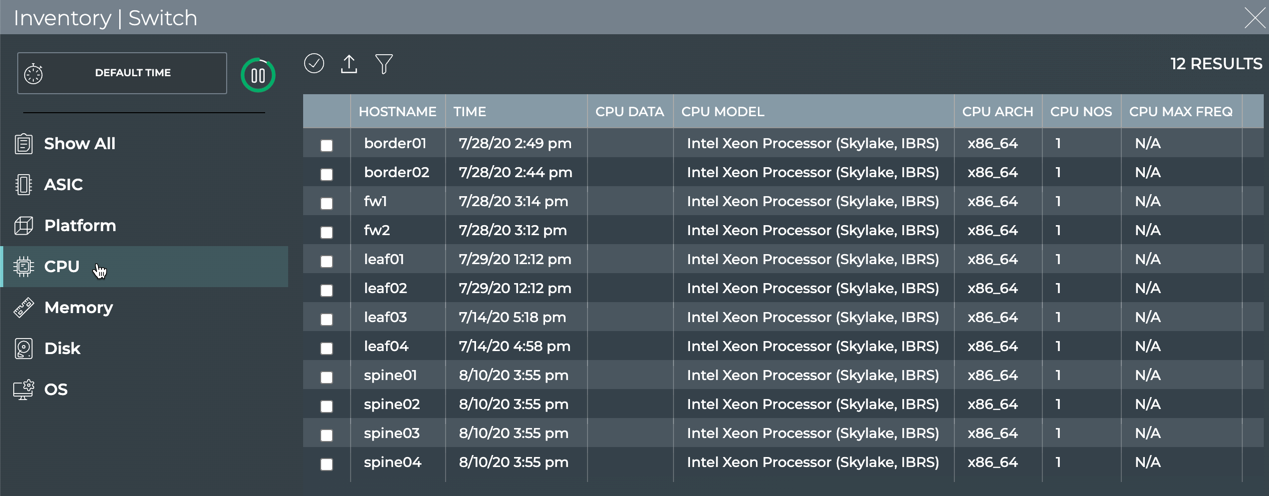
- Inventory|Switches card: view CPU architecture, model, maximum operating frequency, the number of cores, and data on a switch (table)
netq show inventory cpucommand: view CPU architecture, model, maximum operating frequency, and the number of cores on a switch
Locate the Inventory|Switches card on your workbench.
Hover over the card, and change to the full-screen card using the size picker.
Click CPU.
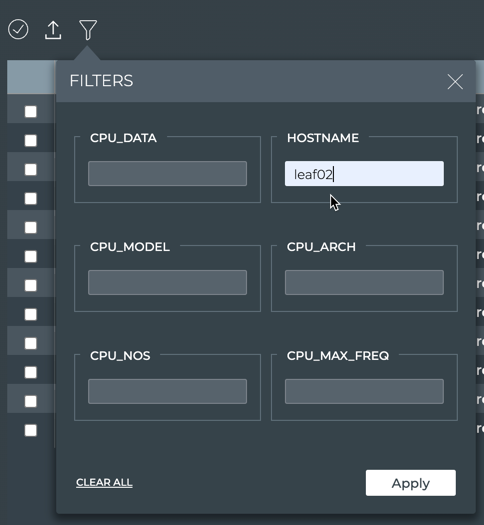
Click
to quickly locate a switch that does not appear on the first page of the switch list.Select hostname from the Field dropdown. Then enter the hostname of the switch you want to view.
- To return to your workbench, click in the top right corner of the card.
To view CPU information for a switch in your network, run:
netq [<hostname>] show inventory cpu [arch <cpu-arch>] [opta] [json]
This example shows CPU information for the server02 switch.
cumulus@switch:~$ netq server02 show inventory cpu
Matching inventory records:
Hostname          Arch     Model                          Freq       Cores
----------------- -------- ------------------------------ ---------- -----
server02          x86_64   Intel Core i7 9xx (Nehalem Cla N/A        1
                            ss Core i7)
This example shows the CPU information for the NetQ On-premises or Cloud Appliance.
cumulus@switch:~$ netq show inventory cpu opta
Matching inventory records:
Hostname          Arch     Model                          Freq       Cores
----------------- -------- ------------------------------ ---------- -----
netq-ts           x86_64   Intel Xeon Processor (Skylake, N/A        8
                           IBRS)
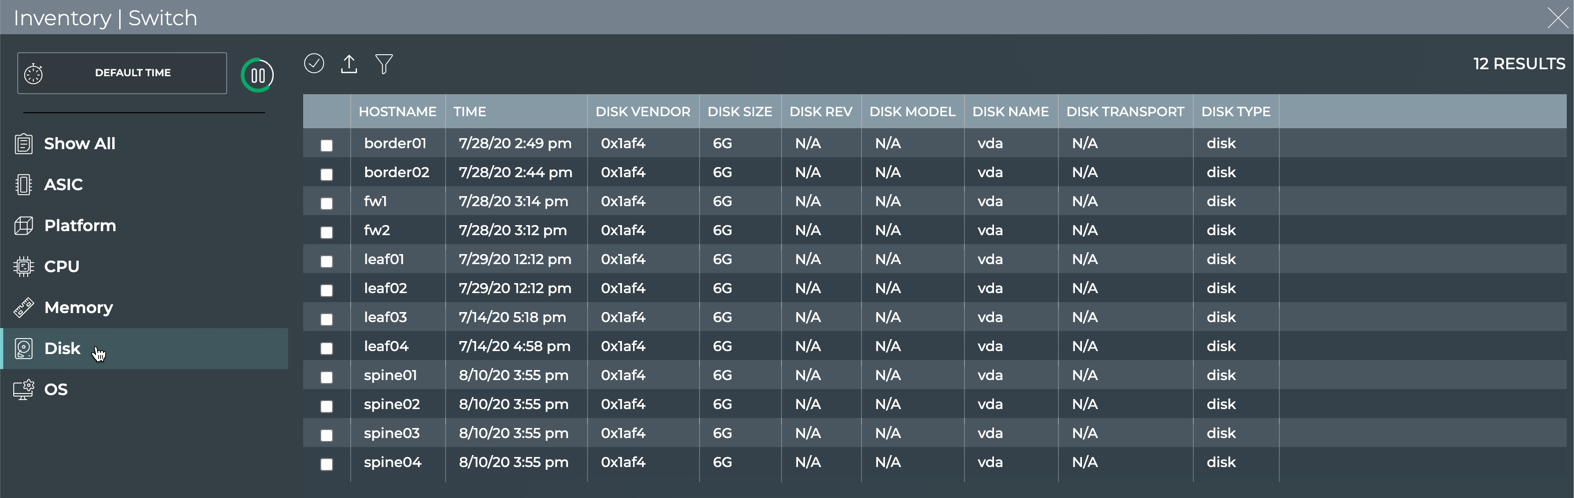
View Disk Information for a Switch
Disk information is available from the NetQ UI and NetQ CLI.
- Inventory|Switches card: view disk vendor, size, revision, model, name, transport, and type on a switch (table)
netq show inventory diskcommand: view disk name, type, transport, size, vendor, and model on all devices
Locate the Inventory|Switches card on your workbench.
Hover over the card, and change to the full-screen card using the size picker.
Click Disk.
Click
to quickly locate a switch that does not appear on the first page of the switch list.Select hostname from the Field dropdown. Then enter the hostname of the switch you want to view.
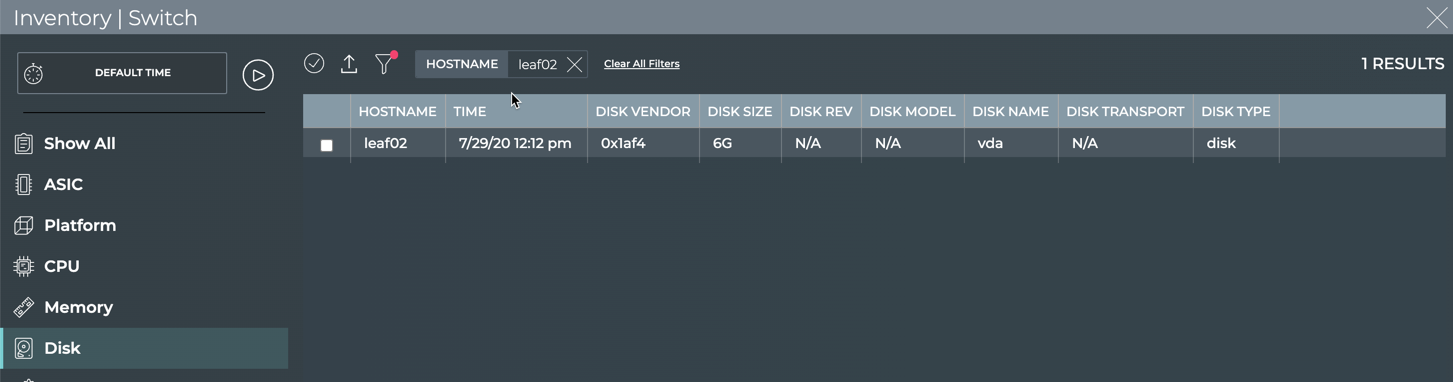
- To return to your workbench, click in the top right corner of the card.
To view disk information for a switch in your network, run:
netq [<hostname>] show inventory disk [opta] [json]
This example shows the disk information for the leaf03 switch.
cumulus@switch:~$ netq leaf03 show inventory disk
Matching inventory records:
Hostname          Name            Type             Transport          Size       Vendor               Model
----------------- --------------- ---------------- ------------------ ---------- -------------------- ------------------------------
leaf03            vda             disk             N/A                6G         0x1af4               N/A
This example show the disk information for the NetQ On-premises or Cloud Appliance.
cumulus@switch:~$ netq show inventory disk opta

Matching inventory records:
Hostname          Name            Type             Transport          Size       Vendor               Model
----------------- --------------- ---------------- ------------------ ---------- -------------------- ------------------------------
netq-ts           vda             disk             N/A                265G       0x1af4               N/A
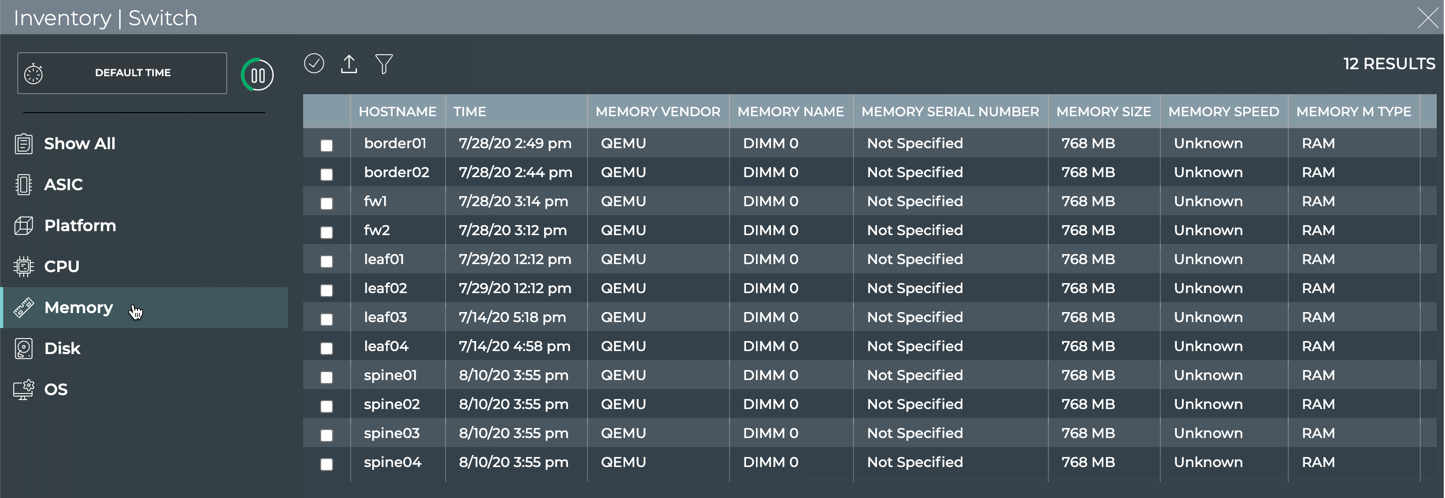
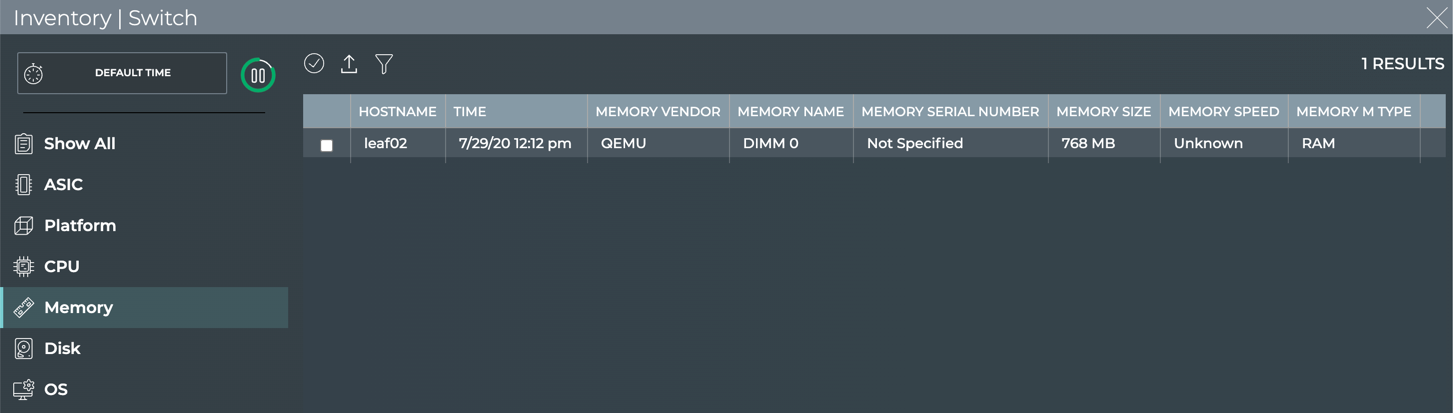
View Memory Information for a Switch
Memory information is available from the NetQ UI and NetQ CLI.
- Inventory|Switches card: view memory chip vendor, name, serial number, size, speed, and type on a switch (table)
netq show inventory memory: view memory chip name, type, size, speed, vendor, and serial number on all devices
Locate the medium Inventory|Switches card on your workbench.
Hover over the card, and change to the full-screen card using the size picker.
Click Memory.
Click
to quickly locate a switch that does not appear on the first page of the switch list.Select hostname from the Field dropdown. Then enter the hostname of the switch you want to view.
- To return to your workbench, click in the top right corner of the card.
To view memory information for your switches and host servers, run:
netq [<hostname>] show inventory memory [opta] [json]
This example shows all the memory characteristics for the leaf01 switch.
cumulus@switch:~$ netq leaf01 show inventory memory
Matching inventory records:
Hostname          Name            Type             Size       Speed      Vendor               Serial No
----------------- --------------- ---------------- ---------- ---------- -------------------- -------------------------
leaf01            DIMM 0          RAM              768 MB     Unknown    QEMU                 Not Specified
This example shows the memory information for the NetQ On-premises or Cloud Appliance.
cumulus@switch:~$ netq show inventory memory opta
Matching inventory records:
Hostname          Name            Type             Size       Speed      Vendor               Serial No
----------------- --------------- ---------------- ---------- ---------- -------------------- -------------------------
netq-ts           DIMM 0          RAM              16384 MB   Unknown    QEMU                 Not Specified
netq-ts           DIMM 1          RAM              16384 MB   Unknown    QEMU                 Not Specified
netq-ts           DIMM 2          RAM              16384 MB   Unknown    QEMU                 Not Specified
netq-ts           DIMM 3          RAM              16384 MB   Unknown    QEMU                 Not Specified
View Switch Software Inventory
You can view software components deployed on a given switch in your network.
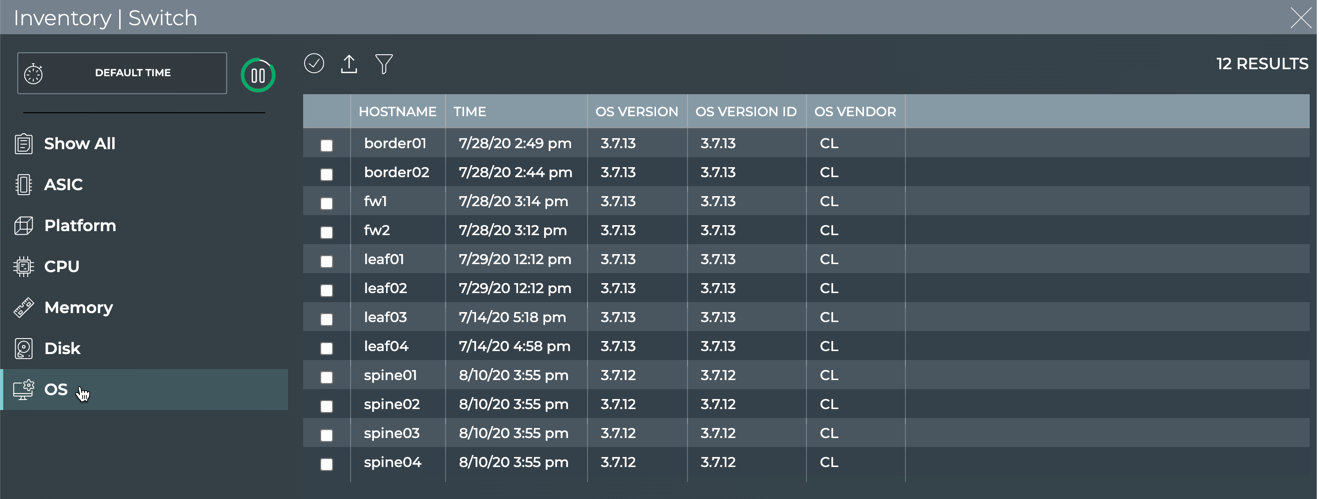
View Operating System Information for a Switch
OS information is available from the NetQ UI and NetQ CLI.
- Inventory|Switches card: view OS vendor, version, and version ID on a switch (table)
netq show inventory os: view OS name and version on a switch
Locate the Inventory|Switches card on your workbench.
Hover over the card, and change to the full-screen card using the size picker.
Click OS.
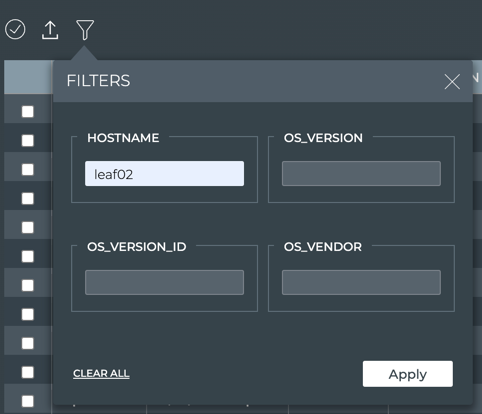
Click
to quickly locate a switch that does not appear on the first page of the switch list.Enter a hostname, then click Apply.
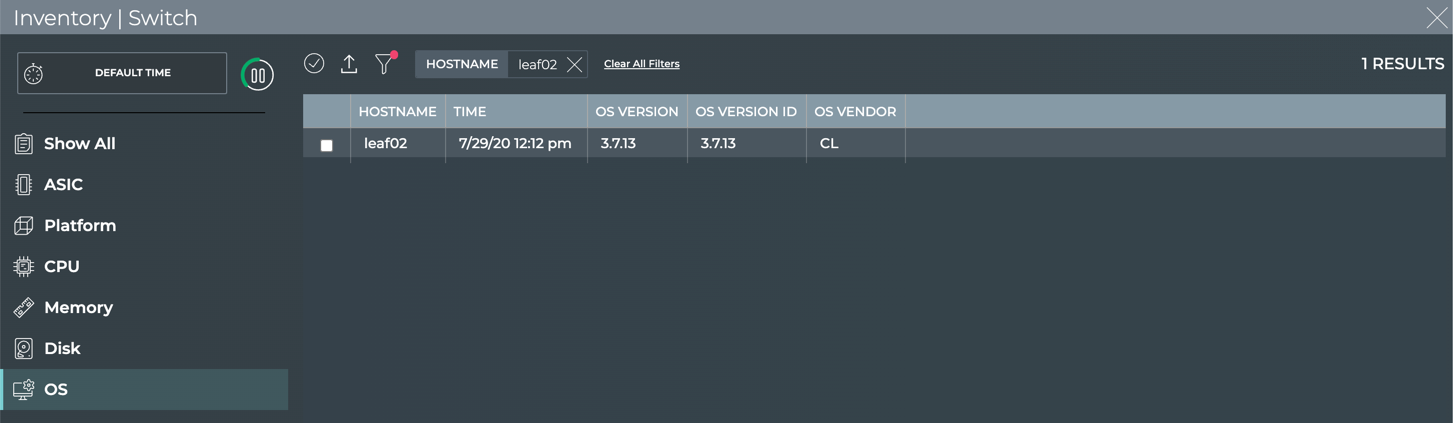
- To return to your workbench, click in the top right corner of the card.
To view OS information for a switch, run:
netq [<hostname>] show inventory os [opta] [json]
This example shows the OS information for the leaf02 switch.
cumulus@switch:~$ netq leaf02 show inventory os
Matching inventory records:
Hostname          Name            Version                              Last Changed
----------------- --------------- ------------------------------------ -------------------------
leaf02            CL              3.7.5                                Fri Apr 19 16:01:46 2019
This example shows the OS information for the NetQ On-premises or Cloud Appliance.
cumulus@switch:~$ netq show inventory os opta

Matching inventory records:
Hostname          Name            Version                              Last Changed
----------------- --------------- ------------------------------------ -------------------------
netq-ts           Ubuntu          18.04                                Tue Jul 14 19:27:39 2020
View the Cumulus Linux Packages on a Switch
When you are troubleshooting an issue with a switch, you might want to know which supported versions of the Cumulus Linux operating system are available for that switch and on a switch that is not having the same issue.
To view package information for your switches, run:
netq <hostname> show cl-manifest [json]
This example shows the Cumulus Linux OS versions supported for the leaf01 switch, using the vx ASIC vendor (virtual, so simulated) and x86_64 CPU architecture.
cumulus@switch:~$ netq leaf01 show cl-manifest

Matching manifest records:
Hostname          ASIC Vendor          CPU Arch             Manifest Version
----------------- -------------------- -------------------- --------------------
leaf01            vx                   x86_64               3.7.6.1
leaf01            vx                   x86_64               3.7.10
leaf01            vx                   x86_64               3.6.2.1
leaf01            vx                   x86_64               3.7.4
leaf01            vx                   x86_64               3.7.2.5
leaf01            vx                   x86_64               3.7.1
leaf01            vx                   x86_64               3.6.0
leaf01            vx                   x86_64               3.7.0
leaf01            vx                   x86_64               3.4.1
leaf01            vx                   x86_64               3.7.3
leaf01            vx                   x86_64               3.2.0
...
View All Software Packages Installed on Switches
If you are having an issue with a particular switch, you should verify all the installed software and whether it needs updating.
To view package information for a switch, run:
netq <hostname> show cl-pkg-info [<text-package-name>] [around <text-time>] [json]
Use the text-package-name option to narrow the results to a particular package or the around option to narrow the output to a particular time range.
This example shows all installed software packages for spine01.
cumulus@switch:~$ netq spine01 show cl-pkg-info
Matching package_info records:
Hostname          Package Name             Version              CL Version           Package Status       Last Changed
----------------- ------------------------ -------------------- -------------------- -------------------- -------------------------
spine01           libfile-fnmatch-perl     0.02-2+b1            Cumulus Linux 3.7.12 installed            Wed Aug 26 19:58:45 2020
spine01           screen                   4.2.1-3+deb8u1       Cumulus Linux 3.7.12 installed            Wed Aug 26 19:58:45 2020
spine01           libudev1                 215-17+deb8u13       Cumulus Linux 3.7.12 installed            Wed Aug 26 19:58:45 2020
spine01           libjson-c2               0.11-4               Cumulus Linux 3.7.12 installed            Wed Aug 26 19:58:45 2020
spine01           atftp                    0.7.git20120829-1+de Cumulus Linux 3.7.12 installed            Wed Aug 26 19:58:45 2020
                                           b8u1
spine01           isc-dhcp-relay           4.3.1-6-cl3u14       Cumulus Linux 3.7.12 installed            Wed Aug 26 19:58:45 2020
spine01           iputils-ping             3:20121221-5+b2      Cumulus Linux 3.7.12 installed            Wed Aug 26 19:58:45 2020
spine01           base-files               8+deb8u11            Cumulus Linux 3.7.12 installed            Wed Aug 26 19:58:45 2020
spine01           libx11-data              2:1.6.2-3+deb8u2     Cumulus Linux 3.7.12 installed            Wed Aug 26 19:58:45 2020
spine01           onie-tools               3.2-cl3u6            Cumulus Linux 3.7.12 installed            Wed Aug 26 19:58:45 2020
spine01           python-cumulus-restapi   0.1-cl3u10           Cumulus Linux 3.7.12 installed            Wed Aug 26 19:58:45 2020
spine01           tasksel                  3.31+deb8u1          Cumulus Linux 3.7.12 installed            Wed Aug 26 19:58:45 2020
spine01           ncurses-base             5.9+20140913-1+deb8u Cumulus Linux 3.7.12 installed            Wed Aug 26 19:58:45 2020
                                           3
spine01           libmnl0                  1.0.3-5-cl3u2        Cumulus Linux 3.7.12 installed            Wed Aug 26 19:58:45 2020
spine01           xz-utils                 5.1.1alpha+20120614- Cumulus Linux 3.7.12 installed            Wed Aug 26 19:58:45 2020
...
This example shows the ntp package on the spine01 switch.
cumulus@switch:~$ netq spine01 show cl-pkg-info ntp
Matching package_info records:
Hostname          Package Name             Version              CL Version           Package Status       Last Changed
----------------- ------------------------ -------------------- -------------------- -------------------- -------------------------
spine01           ntp                      1:4.2.8p10-cl3u2     Cumulus Linux 3.7.12 installed            Wed Aug 26 19:58:45 2020
View Recommended Software Packages
If you have a software manifest, you can determine the recommended packages and versions for a particular Cumulus Linux release. You can then compare that to the software already installed on your switch(es) to determine if it differs from the manifest. Such a difference might occur if you upgraded one or more packages separately from the Cumulus Linux software itself.
To view recommended package information for a switch, run:
netq <hostname> show recommended-pkg-version [release-id <text-release-id>] [package-name <text-package-name>] [json]
This example shows the recommended packages for upgrading the leaf12 switch, namely switchd.
cumulus@switch:~$ netq leaf12 show recommended-pkg-version
Matching manifest records:
Hostname          Release ID           ASIC Vendor          CPU Arch             Package Name         Version              Last Changed
----------------- -------------------- -------------------- -------------------- -------------------- -------------------- -------------------------
leaf12            3.7.1                vx                   x86_64               switchd              1.0-cl3u30           Wed Feb  5 04:36:30 2020
This example shows the recommended packages for upgrading the server01 switch, namely lldpd.
cumulus@switch:~$ netq server01 show recommended-pkg-version
Matching manifest records:
Hostname          Release ID           ASIC Vendor          CPU Arch             Package Name         Version              Last Changed
----------------- -------------------- -------------------- -------------------- -------------------- -------------------- -------------------------
server01            3.7.1                vx                   x86_64               lldpd                0.9.8-0-cl3u11       Wed Feb  5 04:36:30 2020
This example shows the recommended version of the switchd package for use with Cumulus Linux 3.7.2.
cumulus@switch:~$ netq act-5712-09 show recommended-pkg-version release-id 3.7.2 package-name switchd
Matching manifest records:
Hostname          Release ID           ASIC Vendor          CPU Arch             Package Name         Version              Last Changed
----------------- -------------------- -------------------- -------------------- -------------------- -------------------- -------------------------
act-5712-09       3.7.2                bcm                  x86_64               switchd              1.0-cl3u31           Wed Feb  5 04:36:30 2020
This example shows the recommended version of the switchd package for use with Cumulus Linux 3.1.0. Note the version difference from the example for Cumulus Linux 3.7.2.
cumulus@noc-pr:~$ netq act-5712-09 show recommended-pkg-version release-id 3.1.0 package-name switchd
Matching manifest records:
Hostname          Release ID           ASIC Vendor          CPU Arch             Package Name         Version              Last Changed
----------------- -------------------- -------------------- -------------------- -------------------- -------------------- -------------------------
act-5712-09       3.1.0                bcm                  x86_64               switchd              1.0-cl3u4            Wed Feb  5 04:36:30 2020
Validate NetQ Agents are Running
You can confirm that NetQ Agents are running on switches and hosts (if installed) using the netq show agents command. Viewing the Status column of the output indicates whether the agent is up and current, labelled Fresh, or down and stale, labelled Rotten. Additional information includes the agent status — whether it is time synchronized, how long it has been up, and the last time its state changed.
This example shows NetQ Agent state on all devices.
cumulus@switch:~$ netq show agents
Matching agents records:
Hostname          Status           NTP Sync Version                              Sys Uptime                Agent Uptime              Reinitialize Time          Last Changed
----------------- ---------------- -------- ------------------------------------ ------------------------- ------------------------- -------------------------- -------------------------
border01          Fresh            yes      3.2.0-cl4u30~1601410518.104fb9ed     Mon Sep 21 17:04:54 2020  Tue Sep 29 21:24:58 2020  Tue Sep 29 21:24:58 2020   Thu Oct  1 16:07:38 2020
border02          Fresh            yes      3.2.0-cl4u30~1601410518.104fb9ed     Mon Sep 21 17:04:57 2020  Tue Sep 29 21:24:58 2020  Tue Sep 29 21:24:58 2020   Thu Oct  1 16:07:33 2020
fw1               Fresh            yes      3.2.0-cl4u30~1601410518.104fb9ed     Mon Sep 21 17:04:44 2020  Tue Sep 29 21:24:48 2020  Tue Sep 29 21:24:48 2020   Thu Oct  1 16:07:26 2020
fw2               Fresh            yes      3.2.0-cl4u30~1601410518.104fb9ed     Mon Sep 21 17:04:42 2020  Tue Sep 29 21:24:48 2020  Tue Sep 29 21:24:48 2020   Thu Oct  1 16:07:22 2020
leaf01            Fresh            yes      3.2.0-cl4u30~1601410518.104fb9ed     Mon Sep 21 16:49:04 2020  Tue Sep 29 21:24:49 2020  Tue Sep 29 21:24:49 2020   Thu Oct  1 16:07:10 2020
leaf02            Fresh            yes      3.2.0-cl4u30~1601410518.104fb9ed     Mon Sep 21 17:03:14 2020  Tue Sep 29 21:24:49 2020  Tue Sep 29 21:24:49 2020   Thu Oct  1 16:07:30 2020
leaf03            Fresh            yes      3.2.0-cl4u30~1601410518.104fb9ed     Mon Sep 21 17:03:37 2020  Tue Sep 29 21:24:49 2020  Tue Sep 29 21:24:49 2020   Thu Oct  1 16:07:24 2020
leaf04            Fresh            yes      3.2.0-cl4u30~1601410518.104fb9ed     Mon Sep 21 17:03:35 2020  Tue Sep 29 21:24:58 2020  Tue Sep 29 21:24:58 2020   Thu Oct  1 16:07:13 2020
oob-mgmt-server   Fresh            yes      3.1.1-ub18.04u29~1599111022.78b9e43  Mon Sep 21 16:43:58 2020  Mon Sep 21 17:55:00 2020  Mon Sep 21 17:55:00 2020   Thu Oct  1 16:07:31 2020
server01          Fresh            yes      3.2.0-ub18.04u30~1601393774.104fb9e  Mon Sep 21 17:19:57 2020  Tue Sep 29 21:13:07 2020  Tue Sep 29 21:13:07 2020   Thu Oct  1 16:07:16 2020
server02          Fresh            yes      3.2.0-ub18.04u30~1601393774.104fb9e  Mon Sep 21 17:19:57 2020  Tue Sep 29 21:13:07 2020  Tue Sep 29 21:13:07 2020   Thu Oct  1 16:07:24 2020
server03          Fresh            yes      3.2.0-ub18.04u30~1601393774.104fb9e  Mon Sep 21 17:19:56 2020  Tue Sep 29 21:13:07 2020  Tue Sep 29 21:13:07 2020   Thu Oct  1 16:07:12 2020
server04          Fresh            yes      3.2.0-ub18.04u30~1601393774.104fb9e  Mon Sep 21 17:19:57 2020  Tue Sep 29 21:13:07 2020  Tue Sep 29 21:13:07 2020   Thu Oct  1 16:07:17 2020
server05          Fresh            yes      3.2.0-ub18.04u30~1601393774.104fb9e  Mon Sep 21 17:19:57 2020  Tue Sep 29 21:13:10 2020  Tue Sep 29 21:13:10 2020   Thu Oct  1 16:07:25 2020
server06          Fresh            yes      3.2.0-ub18.04u30~1601393774.104fb9e  Mon Sep 21 17:19:57 2020  Tue Sep 29 21:13:10 2020  Tue Sep 29 21:13:10 2020   Thu Oct  1 16:07:21 2020
server07          Fresh            yes      3.2.0-ub18.04u30~1601393774.104fb9e  Mon Sep 21 17:06:48 2020  Tue Sep 29 21:13:10 2020  Tue Sep 29 21:13:10 2020   Thu Oct  1 16:07:28 2020
server08          Fresh            yes      3.2.0-ub18.04u30~1601393774.104fb9e  Mon Sep 21 17:06:45 2020  Tue Sep 29 21:13:10 2020  Tue Sep 29 21:13:10 2020   Thu Oct  1 16:07:31 2020
spine01           Fresh            yes      3.2.0-cl4u30~1601410518.104fb9ed     Mon Sep 21 17:03:34 2020  Tue Sep 29 21:24:58 2020  Tue Sep 29 21:24:58 2020   Thu Oct  1 16:07:20 2020
spine02           Fresh            yes      3.2.0-cl4u30~1601410518.104fb9ed     Mon Sep 21 17:03:33 2020  Tue Sep 29 21:24:58 2020  Tue Sep 29 21:24:58 2020   Thu Oct  1 16:07:16 2020
spine03           Fresh            yes      3.2.0-cl4u30~1601410518.104fb9ed     Mon Sep 21 17:03:34 2020  Tue Sep 29 21:25:07 2020  Tue Sep 29 21:25:07 2020   Thu Oct  1 16:07:20 2020
spine04           Fresh            yes      3.2.0-cl4u30~1601410518.104fb9ed     Mon Sep 21 17:03:32 2020  Tue Sep 29 21:25:07 2020  Tue Sep 29 21:25:07 2020   Thu Oct  1 16:07:33 2020
You can narrow your focus in several ways:
- View the state of the NetQ Agent on a given device using the hostname keyword.
- View only the NetQ Agents that are fresh or rotten using the fresh or rotten keyword.
- View the state of NetQ Agents at an earlier time using the around keyword.
Monitor Software Services
Cumulus Linux, SONiC and NetQ run many services to deliver the various features of these products. You can monitor their status using the netq show services command. This section describes services related to system-level operation. For monitoring other services, such as those related to routing, see those topics. NetQ automatically monitors the following services:
- aclinit:
aclinitservice - acltool:
acltoolservice - bgp: BGP (Border Gateway Protocol) service
- bgpd: BGP daemon
- chrony:
chronyservice - clagd: MLAG (Multi-chassis Link Aggregation) daemon
- cumulus-chassis-ssh: cumulus-chassis-ssh
- cumulus-chassisd: cumulus-chassisd
- database: database
- dhcp_relay: DHCP relay service
- docker: Docker container service
- ledmgrd: Switch LED manager daemon
- lldp: LLDP (Link Layer Discovery Protocol) service
- lldpd: LLDP daemon
- mstpd: MSTP (Multiple Spanning Tree Protocol) daemon
- neighmgrd: Neighbor manager daemon for BGP and OSPF
- netq-agent: NetQ Agent service
- netqd: NetQ application daemon
- ntp: Network Time Protocol (NTP) service
- pmon: Process monitor service
- portwd: Port watch daemon
- ptmd: PTM (Prescriptive Topology Manager) daemon
- pwmd: Password manager daemon
- radv: Route advertiser service
- rsyslog: Rocket-fast system event logging processing service
- smond: System monitor daemon
- ssh: Secure shell service for switches and servers
- status: Show services with a given status (ok, error, warning, fail)
- switchd: Cumulus Linux
switchdservice for hardware acceleration - swss: SONiC switch state service daemon
- sx_sdk: Spectrum ASIC SDK service
- syncd: Synchronization service
- syslog: System event logging service
- teamd: Network team service
- vrf: VRF (Virtual Route Forwarding) service
- wd_keepalive: Software watchdog service
- zebra: GNU Zebra routing daemon
The CLI syntax for viewing the status of services is:
netq [<hostname>] show services [<service-name>] [vrf <vrf>] [active|monitored] [around <text-time>] [json]
netq [<hostname>] show services [<service-name>] [vrf <vrf>] status (ok|warning|error|fail) [around <text-time>] [json]
netq [<hostname>] show events [level info | level error | level warning | level critical | level debug] type services [between <text-time> and <text-endtime>] [json]
View All Services on All Devices
This example shows all available services on each device and whether each is enabled, active, and monitored, along with how long the service has been running and the last time it changed.
It is useful to have colored output for this show command. To configure colored output, run the netq config add color command.
cumulus@switch:~$ netq show services
Hostname          Service              PID   VRF             Enabled Active Monitored Status           Uptime                    Last Changed
----------------- -------------------- ----- --------------- ------- ------ --------- ---------------- ------------------------- -------------------------
leaf01            bgpd                 2872  default         yes     yes    yes       ok               1d:6h:43m:59s             Fri Feb 15 17:28:24 2019
leaf01            clagd                n/a   default         yes     no     yes       n/a              1d:6h:43m:35s             Fri Feb 15 17:28:48 2019
leaf01            ledmgrd              1850  default         yes     yes    no        ok               1d:6h:43m:59s             Fri Feb 15 17:28:24 2019
leaf01            lldpd                2651  default         yes     yes    yes       ok               1d:6h:43m:27s             Fri Feb 15 17:28:56 2019
leaf01            mstpd                1746  default         yes     yes    yes       ok               1d:6h:43m:35s             Fri Feb 15 17:28:48 2019
leaf01            neighmgrd            1986  default         yes     yes    no        ok               1d:6h:43m:59s             Fri Feb 15 17:28:24 2019
leaf01            netq-agent           8654  mgmt            yes     yes    yes       ok               1d:6h:43m:29s             Fri Feb 15 17:28:54 2019
leaf01            netqd                8848  mgmt            yes     yes    yes       ok               1d:6h:43m:29s             Fri Feb 15 17:28:54 2019
leaf01            ntp                  8478  mgmt            yes     yes    yes       ok               1d:6h:43m:29s             Fri Feb 15 17:28:54 2019
leaf01            ptmd                 2743  default         yes     yes    no        ok               1d:6h:43m:59s             Fri Feb 15 17:28:24 2019
leaf01            pwmd                 1852  default         yes     yes    no        ok               1d:6h:43m:59s             Fri Feb 15 17:28:24 2019
leaf01            smond                1826  default         yes     yes    yes       ok               1d:6h:43m:27s             Fri Feb 15 17:28:56 2019
leaf01            ssh                  2106  default         yes     yes    no        ok               1d:6h:43m:59s             Fri Feb 15 17:28:24 2019
leaf01            syslog               8254  default         yes     yes    no        ok               1d:6h:43m:59s             Fri Feb 15 17:28:24 2019
leaf01            zebra                2856  default         yes     yes    yes       ok               1d:6h:43m:59s             Fri Feb 15 17:28:24 2019
leaf02            bgpd                 2867  default         yes     yes    yes       ok               1d:6h:43m:55s             Fri Feb 15 17:28:28 2019
leaf02            clagd                n/a   default         yes     no     yes       n/a              1d:6h:43m:31s             Fri Feb 15 17:28:53 2019
leaf02            ledmgrd              1856  default         yes     yes    no        ok               1d:6h:43m:55s             Fri Feb 15 17:28:28 2019
leaf02            lldpd                2646  default         yes     yes    yes       ok               1d:6h:43m:30s             Fri Feb 15 17:28:53 2019
...
You can also view services information in JSON format:
cumulus@switch:~$ netq show services json
{
    "services":[
        {
            "status":"ok",
            "uptime":1550251734.0,
            "monitored":"yes",
            "service":"ntp",
            "lastChanged":1550251734.4790000916,
            "pid":"8478",
            "hostname":"leaf01",
            "enabled":"yes",
            "vrf":"mgmt",
            "active":"yes"
        },
        {
            "status":"ok",
            "uptime":1550251704.0,
            "monitored":"no",
            "service":"ssh",
            "lastChanged":1550251704.0929999352,
            "pid":"2106",
            "hostname":"leaf01",
            "enabled":"yes",
        "vrf":"default",
        "active":"yes"
    },
    {
        "status":"ok",
        "uptime":1550251736.0,
        "monitored":"yes",
        "service":"lldpd",
        "lastChanged":1550251736.5160000324,
        "pid":"2651",
        "hostname":"leaf01",
        "enabled":"yes",
        "vrf":"default",
        "active":"yes"
    },
    {
        "status":"ok",
        "uptime":1550251704.0,
        "monitored":"yes",
        "service":"bgpd",
        "lastChanged":1550251704.1040000916,
        "pid":"2872",
        "hostname":"leaf01",
        "enabled":"yes",
        "vrf":"default",
        "active":"yes"
    },
    {
        "status":"ok",
        "uptime":1550251704.0,
        "monitored":"no",
        "service":"neighmgrd",
        "lastChanged":1550251704.0969998837,
        "pid":"1986",
        "hostname":"leaf01",
        "enabled":"yes",
        "vrf":"default",
        "active":"yes"
    },
...
If you want to view the service information for a given device, use the hostname option when running the command.
View Information about a Given Service on All Devices
You can view the status of a given service at the current time, at a prior point in time, or view the changes that have occurred for the service during a specified timeframe.
This example shows how to view the status of the NTP service across the network. In this case, the VRF configuration has the NTP service running on both the default and management interface. You can perform the same command with the other services, such as bgpd, lldpd, and clagd.
cumulus@switch:~$ netq show services ntp
Matching services records:
Hostname          Service              PID   VRF             Enabled Active Monitored Status           Uptime                    Last Changed
----------------- -------------------- ----- --------------- ------- ------ --------- ---------------- ------------------------- -------------------------
exit01            ntp                  8478  mgmt            yes     yes    yes       ok               1d:6h:52m:41s             Fri Feb 15 17:28:54 2019
exit02            ntp                  8497  mgmt            yes     yes    yes       ok               1d:6h:52m:36s             Fri Feb 15 17:28:59 2019
firewall01        ntp                  n/a   default         yes     yes    yes       ok               1d:6h:53m:4s              Fri Feb 15 17:28:31 2019
hostd-11          ntp                  n/a   default         yes     yes    yes       ok               1d:6h:52m:46s             Fri Feb 15 17:28:49 2019
hostd-21          ntp                  n/a   default         yes     yes    yes       ok               1d:6h:52m:37s             Fri Feb 15 17:28:58 2019
hosts-11          ntp                  n/a   default         yes     yes    yes       ok               1d:6h:52m:28s             Fri Feb 15 17:29:07 2019
hosts-13          ntp                  n/a   default         yes     yes    yes       ok               1d:6h:52m:19s             Fri Feb 15 17:29:16 2019
hosts-21          ntp                  n/a   default         yes     yes    yes       ok               1d:6h:52m:14s             Fri Feb 15 17:29:21 2019
hosts-23          ntp                  n/a   default         yes     yes    yes       ok               1d:6h:52m:4s              Fri Feb 15 17:29:31 2019
noc-pr            ntp                  2148  default         yes     yes    yes       ok               1d:6h:53m:43s             Fri Feb 15 17:27:52 2019
noc-se            ntp                  2148  default         yes     yes    yes       ok               1d:6h:53m:38s             Fri Feb 15 17:27:57 2019
spine01           ntp                  8414  mgmt            yes     yes    yes       ok               1d:6h:53m:30s             Fri Feb 15 17:28:05 2019
spine02           ntp                  8419  mgmt            yes     yes    yes       ok               1d:6h:53m:27s             Fri Feb 15 17:28:08 2019
spine03           ntp                  8443  mgmt            yes     yes    yes       ok               1d:6h:53m:22s             Fri Feb 15 17:28:13 2019
leaf01             ntp                  8765  mgmt            yes     yes    yes       ok               1d:6h:52m:52s             Fri Feb 15 17:28:43 2019
leaf02             ntp                  8737  mgmt            yes     yes    yes       ok               1d:6h:52m:46s             Fri Feb 15 17:28:49 2019
leaf11            ntp                  9305  mgmt            yes     yes    yes       ok               1d:6h:49m:22s             Fri Feb 15 17:32:13 2019
leaf12            ntp                  9339  mgmt            yes     yes    yes       ok               1d:6h:49m:9s              Fri Feb 15 17:32:26 2019
leaf21            ntp                  9367  mgmt            yes     yes    yes       ok               1d:6h:49m:5s              Fri Feb 15 17:32:30 2019
leaf22            ntp                  9403  mgmt            yes     yes    yes       ok               1d:6h:52m:57s             Fri Feb 15 17:28:38 2019
This example shows the status of the BGP daemon.
cumulus@switch:~$ netq show services bgpd
Matching services records:
Hostname          Service              PID   VRF             Enabled Active Monitored Status           Uptime                    Last Changed
----------------- -------------------- ----- --------------- ------- ------ --------- ---------------- ------------------------- -------------------------
exit01            bgpd                 2872  default         yes     yes    yes       ok               1d:6h:54m:37s             Fri Feb 15 17:28:24 2019
exit02            bgpd                 2867  default         yes     yes    yes       ok               1d:6h:54m:33s             Fri Feb 15 17:28:28 2019
firewall01        bgpd                 21766 default         yes     yes    yes       ok               1d:6h:54m:54s             Fri Feb 15 17:28:07 2019
spine01           bgpd                 2953  default         yes     yes    yes       ok               1d:6h:55m:27s             Fri Feb 15 17:27:34 2019
spine02           bgpd                 2948  default         yes     yes    yes       ok               1d:6h:55m:23s             Fri Feb 15 17:27:38 2019
spine03           bgpd                 2953  default         yes     yes    yes       ok               1d:6h:55m:18s             Fri Feb 15 17:27:43 2019
leaf01            bgpd                 3221  default         yes     yes    yes       ok               1d:6h:54m:48s             Fri Feb 15 17:28:13 2019
leaf02            bgpd                 3177  default         yes     yes    yes       ok               1d:6h:54m:42s             Fri Feb 15 17:28:19 2019
leaf11            bgpd                 3521  default         yes     yes    yes       ok               1d:6h:51m:18s             Fri Feb 15 17:31:43 2019
leaf12            bgpd                 3527  default         yes     yes    yes       ok               1d:6h:51m:6s              Fri Feb 15 17:31:55 2019
leaf21            bgpd                 3512  default         yes     yes    yes       ok               1d:6h:51m:1s              Fri Feb 15 17:32:00 2019
leaf22            bgpd                 3536  default         yes     yes    yes       ok               1d:6h:54m:54s             Fri Feb 15 17:28:07 2019
View Events Related to a Given Service
To view changes over a given time period, use the netq show events command. For more detailed information about events, refer to Manage Events and Notifications.
This example shows changes to the bgpd service in the last 48 hours.
cumulus@switch:/$ netq show events type bgp between now and 48h
Matching events records:
Hostname          Message Type Severity Message                             Timestamp
----------------- ------------ -------- ----------------------------------- -------------------------
leaf01            bgp          info     BGP session with peer spine-1 swp3. 1d:6h:55m:37s
                                        3 vrf DataVrf1081 state changed fro
                                        m failed to Established
leaf01            bgp          info     BGP session with peer spine-2 swp4. 1d:6h:55m:37s
                                        3 vrf DataVrf1081 state changed fro
                                        m failed to Established
leaf01            bgp          info     BGP session with peer spine-3 swp5. 1d:6h:55m:37s
                                        3 vrf DataVrf1081 state changed fro
                                        m failed to Established
leaf01            bgp          info     BGP session with peer spine-1 swp3. 1d:6h:55m:37s
                                        2 vrf DataVrf1080 state changed fro
                                        m failed to Established
leaf01            bgp          info     BGP session with peer spine-3 swp5. 1d:6h:55m:37s
                                        2 vrf DataVrf1080 state changed fro
                                        m failed to Established
leaf01            bgp          info     BGP session with peer spine-2 swp4. 1d:6h:55m:37s
                                        2 vrf DataVrf1080 state changed fro
                                        m failed to Established
leaf01            bgp          info     BGP session with peer spine-3 swp5. 1d:6h:55m:37s
                                        4 vrf DataVrf1082 state changed fro
                                        m failed to Established