Monitor the MLAG Service
You use Multi-Chassis Link Aggregation (MLAG) to enable a server or switch with a two-port bond (such as a link aggregation group/LAG, EtherChannel, port group or trunk) to connect those ports to different switches and operate as if they have a connection to a single, logical switch. This provides greater redundancy and greater system throughput. Dual-connected devices can create LACP bonds that contain links to each physical switch. Therefore, NetQ supports active-active links from the dual-connected devices even though each switch connects to a different physical switch. For an overview and how to configure MLAG in your network, refer to Multi-Chassis Link Aggregation - MLAG.
MLAG or CLAG?
Other vendors refer to the Cumulus Linux implementation of MLAG as MLAG, MC-LAG or VPC. The NetQ UI uses the MLAG terminology predominantly. However, the management daemon, named clagd, and other options in the code, such as clag-id, remain for historical purposes.
NetQ enables operators to view the health of the MLAG service on a networkwide and a per session basis, giving greater insight into all aspects of the service. You accomplish this in the NetQ UI through two card workflows, one for the service and one for the session, and in the NetQ CLI with the netq show mlag command.
Any prior scripts or automation that use the older netq show clag command continue to work as the command still exists in the operating system.
Monitor the MLAG Service Networkwide
With NetQ, you can monitor MLAG performance across the network:
- Network Services|All MLAG Sessions
- Small: view number of nodes running MLAG service and number and distribution of alarms
- Medium: view number of nodes running MLAG service, number and distribution of sessions and alarms, number of sessions with inactive backup IPs, and number of bonds with single connections
- Large: view number of nodes running MLAG service, number of sessions and alarms, number of sessions with inactive backup IPs, switches with the most established/unestablished sessions, devices with the most alarms
- Full-screen: view all switches, all sessions, and all alarms
netq show mlagcommand: view host, peer, system MAC address, state, information about the bonds, and last time each session running MLAG had a change
When entering a time value in the netq show mlag command, you must include a numeric value and the unit of measure:
- w: weeks
- d: days
- h: hours
- m: minutes
- s: seconds
- now
When using the between option, you can enter the start time (text-time) and end time (text-endtime) values as most recent first and least recent second, or vice versa. The values do not have to have the same unit of measure.
View Service Status Summary
You can view a summary of the MLAG service from the NetQ UI or the NetQ CLI.
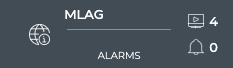
To view the summary, open the small Network Services|All MLAG Sessions card. In this example, the number of devices running the MLAG service is 4 and no alarms are present.
To view MLAG service status, run netq show mlag.
This example shows the Cumulus reference topology, where MLAG is configured on the border and leaf switches. You can view host, peer, system MAC address, state, information about the bonds, and last time a change was made for each MLAG session.
cumulus@switch~$ netq show mlag
Matching clag records:
Hostname          Peer              SysMac             State      Backup #Bond #Dual Last Changed
                                                                         s
----------------- ----------------- ------------------ ---------- ------ ----- ----- -------------------------
border01(P)       border02          44:38:39:be:ef:ff  up         up     3     3     Tue Oct 27 10:50:26 2020
border02          border01(P)       44:38:39:be:ef:ff  up         up     3     3     Tue Oct 27 10:46:38 2020
leaf01(P)         leaf02            44:38:39:be:ef:aa  up         up     8     8     Tue Oct 27 10:44:39 2020
leaf02            leaf01(P)         44:38:39:be:ef:aa  up         up     8     8     Tue Oct 27 10:52:15 2020
leaf03(P)         leaf04            44:38:39:be:ef:bb  up         up     8     8     Tue Oct 27 10:48:07 2020
leaf04            leaf03(P)         44:38:39:be:ef:bb  up         up     8     8     Tue Oct 27 10:48:18 2020
View the Distribution of Sessions and Alarms
It is useful to know the number of network nodes running the MLAG protocol over a period of time, as it gives you insight into the amount of traffic associated with and breadth of use of the protocol. It is also useful to compare the number of nodes running MLAG with the alarms present at the same time to determine if there is any correlation between the issues and the ability to establish an MLAG session.
Nodes with a large number of unestablished sessions might have a misconfiguration or might be experiencing communication issues. This is visible with the NetQ UI.
To view the distribution, open the medium Network Services|All MLAG Sessions card.
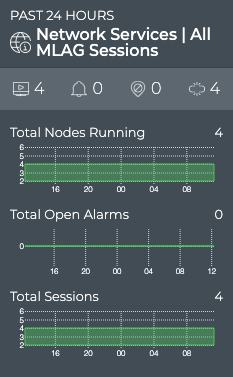
This example shows the following for the last 24 hours:
- Four nodes have been running the MLAG protocol with no changes in that number
- Four sessions were established and remained so
- No MLAG-related alarms have occurred
If there was a visual correlation between the alarms and sessions, you could dig a little deeper with the large Network Services|All MLAG Sessions card.
To view the number of switches running the MLAG service, run:
netq show mlag
Count the switches in the output.
This example shows two border and four leaf switches, for a total of six switches running the protocol. NetQ marks the device in each session acting in the primary role with (P).
cumulus@switch~$ netq show mlag
Matching clag records:
Hostname          Peer              SysMac             State      Backup #Bond #Dual Last Changed
                                                                         s
----------------- ----------------- ------------------ ---------- ------ ----- ----- -------------------------
border01(P)       border02          44:38:39:be:ef:ff  up         up     3     3     Tue Oct 27 10:50:26 2020
border02          border01(P)       44:38:39:be:ef:ff  up         up     3     3     Tue Oct 27 10:46:38 2020
leaf01(P)         leaf02            44:38:39:be:ef:aa  up         up     8     8     Tue Oct 27 10:44:39 2020
leaf02            leaf01(P)         44:38:39:be:ef:aa  up         up     8     8     Tue Oct 27 10:52:15 2020
leaf03(P)         leaf04            44:38:39:be:ef:bb  up         up     8     8     Tue Oct 27 10:48:07 2020
leaf04            leaf03(P)         44:38:39:be:ef:bb  up         up     8     8     Tue Oct 27 10:48:18 2020
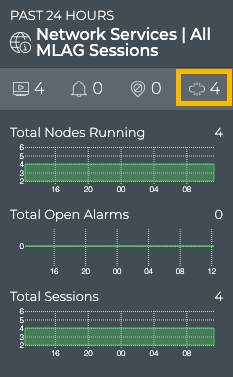
View Bonds with Only a Single Link
You can determine whether there are any bonds in your MLAG configuration with only a single link, instead of the usual two, using the NetQ UI or the NetQ CLI.
Open the medium Network Services|All MLAG Sessions card.
This example shows that four bonds have single links.
Hover over the card and change to the full-screen card using the card size picker.
Click the All Sessions tab.
Browse the sessions looking for either a blank value in the Dual Bonds column, or with one or more bonds listed in the Single Bonds column, to determine whether or not the devices participating in these sessions are incorrectly configured.
Optionally, change the time period of the data on either size card to determine when the configuration might have changed from a dual to a single bond.
Run the netq show mlag command to view bonds with single links in the last 24 hours. Use the around option to view bonds with single links for a time in the past.
This example shows that no bonds have single links, because the #Bonds value equals the #Dual value for all sessions.
cumulus@switch:~$ netq show mlag
Matching clag records:
Hostname          Peer              SysMac             State      Backup #Bond #Dual Last Changed
                                                                         s
----------------- ----------------- ------------------ ---------- ------ ----- ----- -------------------------
border01(P)       border02          44:38:39:be:ef:ff  up         up     3     3     Tue Oct 27 10:50:26 2020
border02          border01(P)       44:38:39:be:ef:ff  up         up     3     3     Tue Oct 27 10:46:38 2020
leaf01(P)         leaf02            44:38:39:be:ef:aa  up         up     8     8     Tue Oct 27 10:44:39 2020
leaf02            leaf01(P)         44:38:39:be:ef:aa  up         up     8     8     Tue Oct 27 10:52:15 2020
leaf03(P)         leaf04            44:38:39:be:ef:bb  up         up     8     8     Tue Oct 27 10:48:07 2020
leaf04            leaf03(P)         44:38:39:be:ef:bb  up         up     8     8     Tue Oct 27 10:48:18 2020
This example shows that you configured more bonds 30 days ago than in the last 24 hours, but in either case, none of those bonds had single links.
cumulus@switch:~$ netq show mlag around 30d
Matching clag records:
Hostname          Peer              SysMac             State      Backup #Bond #Dual Last Changed
                                                                         s
----------------- ----------------- ------------------ ---------- ------ ----- ----- -------------------------
border01(P)       border02          44:38:39:be:ef:ff  up         up     6     6     Sun Sep 27 03:41:52 2020
border02          border01(P)       44:38:39:be:ef:ff  up         up     6     6     Sun Sep 27 03:34:57 2020
leaf01(P)         leaf02            44:38:39:be:ef:aa  up         up     8     8     Sun Sep 27 03:59:25 2020
leaf02            leaf01(P)         44:38:39:be:ef:aa  up         up     8     8     Sun Sep 27 03:38:39 2020
leaf03(P)         leaf04            44:38:39:be:ef:bb  up         up     8     8     Sun Sep 27 03:36:40 2020
leaf04            leaf03(P)         44:38:39:be:ef:bb  up         up     8     8     Sun Sep 27 03:37:59 2020
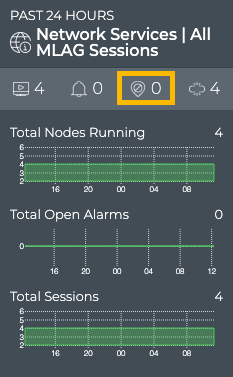
View Sessions with No Backup IP addresses Assigned
You can determine whether MLAG sessions have a backup IP address assigned and ready using the NetQ UI or NetQ CLI.
Open the medium Network Services|All MLAG Sessions card.
This example shows that non of the bonds have single links.
Hover over the card and change to the full-screen card using the card size picker.
Click the All Sessions tab.
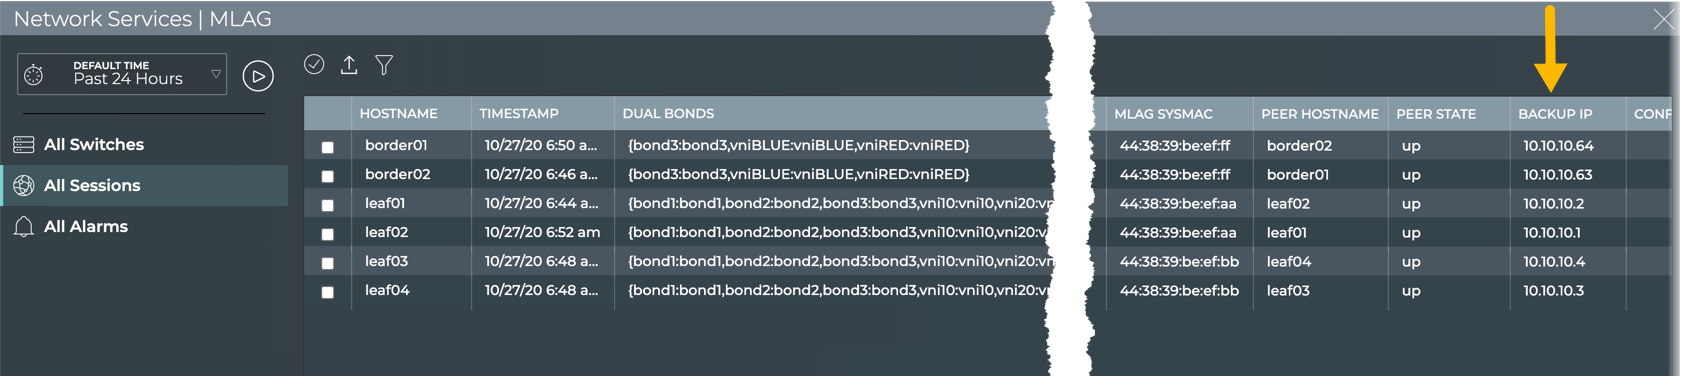
Look for the Backup IP column to confirm the IP address assigned if assigned.
Optionally, change the time period of the data on either size card to determine when a backup IP address was added or removed.
Run netq show mlag to view the status of backup IP addresses for sessions.
This example shows that a backup IP has been configured and is currently reachable for all MLAG sessions because the Backup column indicates up.
cumulus@switch:~$ netq show mlag
Matching clag records:
Hostname          Peer              SysMac             State      Backup #Bond #Dual Last Changed
                                                                         s
----------------- ----------------- ------------------ ---------- ------ ----- ----- -------------------------
border01(P)       border02          44:38:39:be:ef:ff  up         up     3     3     Tue Oct 27 10:50:26 2020
border02          border01(P)       44:38:39:be:ef:ff  up         up     3     3     Tue Oct 27 10:46:38 2020
leaf01(P)         leaf02            44:38:39:be:ef:aa  up         up     8     8     Tue Oct 27 10:44:39 2020
leaf02            leaf01(P)         44:38:39:be:ef:aa  up         up     8     8     Tue Oct 27 10:52:15 2020
leaf03(P)         leaf04            44:38:39:be:ef:bb  up         up     8     8     Tue Oct 27 10:48:07 2020
leaf04            leaf03(P)         44:38:39:be:ef:bb  up         up     8     8     Tue Oct 27 10:48:18 2020
View Sessions with Conflicted Bonds
You can view sessions with conflicted bonds (bonds that conflict with existing bond relationships) in the NetQ UI.
To view these sessions:
Open the Network Services|All MLAG Sessions card.
Hover over the card and change to the full-screen card using the card size picker.
Click the All Sessions tab.
Scroll to the right to view the Conflicted Bonds column. Based on the value/s in that field, reconfigure MLAG accordingly, using the
net add bondNCLU command or edit the/etc/network/interfacesfile. Refer to Basic Configuration in the Cumulus Linux MLAG topic.
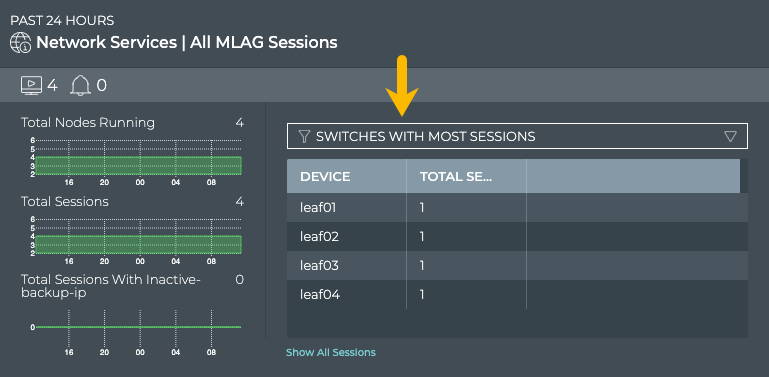
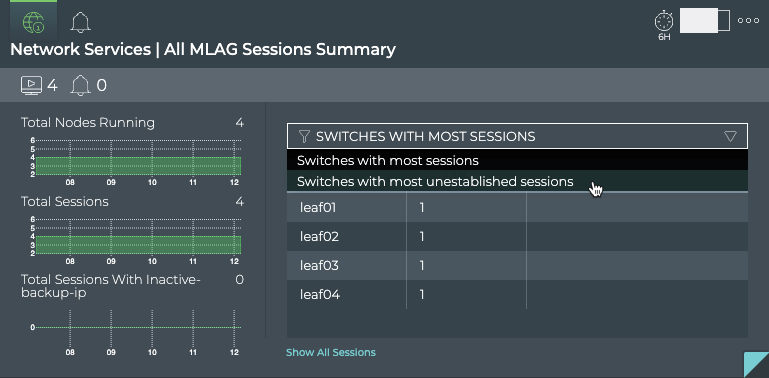
View Devices with the Most MLAG Sessions
You can view the load from MLAG on your switches using the large Network Services|All MLAG Sessions card. This data enables you to see which switches are handling the most MLAG traffic currently, validate that is what you expect based on your network design, and compare that with data from an earlier time to look for any differences.
To view switches and hosts with the most MLAG sessions:
Open the large Network Services|All MLAG Sessions card.
Select Switches with Most Sessions from the filter above the table.
The table content sorts by this characteristic, listing nodes running the most MLAG sessions at the top. Scroll down to view those with the fewest sessions.
To compare this data with the same data at a previous time:
Open another large Network Services|All MLAG Sessions card.
Move the new card next to the original card if needed.
Change the time period for the data on the new card by hovering over the card and clicking
 .
.Select the time period that you want to compare with the current time. You can now see whether there are significant differences between this time period and the previous time period.
To determine the devices with the most sessions, run netq show mlag. Then count the sessions on each device.
In this example, there are two sessions between border01 and border02, two sessions between leaf01 and leaf02, and two session between leaf03 and leaf04. Therefore, no devices has more sessions that any other.
cumulus@switch:~$ netq show mlag
Matching clag records:
Hostname          Peer              SysMac             State      Backup #Bond #Dual Last Changed
                                                                         s
----------------- ----------------- ------------------ ---------- ------ ----- ----- -------------------------
border01(P)       border02          44:38:39:be:ef:ff  up         up     3     3     Tue Oct 27 10:50:26 2020
border02          border01(P)       44:38:39:be:ef:ff  up         up     3     3     Tue Oct 27 10:46:38 2020
leaf01(P)         leaf02            44:38:39:be:ef:aa  up         up     8     8     Tue Oct 27 10:44:39 2020
leaf02            leaf01(P)         44:38:39:be:ef:aa  up         up     8     8     Tue Oct 27 10:52:15 2020
leaf03(P)         leaf04            44:38:39:be:ef:bb  up         up     8     8     Tue Oct 27 10:48:07 2020
leaf04            leaf03(P)         44:38:39:be:ef:bb  up         up     8     8     Tue Oct 27 10:48:18 2020
View Devices with the Most Unestablished MLAG Sessions
You can identify switches that are experiencing difficulties establishing MLAG sessions; both currently and in the past, using the NetQ UI.
To view switches with the most unestablished MLAG sessions:
Open the large Network Services|All MLAG Sessions card.
Select Switches with Most Unestablished Sessions from the filter above the table.
The table content sorts by this characteristic, listing nodes with the most unestablished MLAG sessions at the top. Scroll down to view those with the fewest unestablished sessions.
Where to go next depends on what data you see, but a few options include:
- Change the time period for the data to compare with a prior time. If the same switches are consistently indicating the most unestablished sessions, you might want to look more carefully at those switches using the Switches card workflow to determine probable causes. Refer to Monitor Switch Performance.
- Click Show All Sessions to investigate all MLAG sessions with events in the full-screen card.
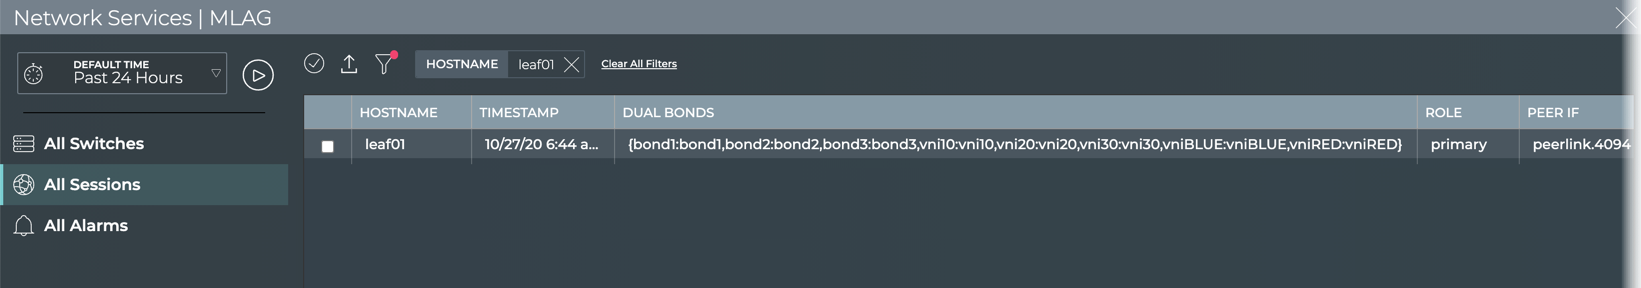
View MLAG Configuration Information for a Given Device
You can view the MLAG configuration information for a given device from the NetQ UI or the NetQ CLI.
Open the full-screen Network Services|All MLAG Sessions card.
Click
 to filter by hostname.
Click Apply.
The sessions with the identified device as the primary, or host device in the MLAG pair, are listed. This example shows the sessions for the leaf01 switch.
Run the netq show mlag command with the hostname option.
This example shows all sessions in which the leaf01 switch is the primary node.
cumulus@switch:~$ netq leaf01 show mlag
Matching clag records:
Hostname          Peer              SysMac             State      Backup #Bond #Dual Last Changed
                                                                         s
----------------- ----------------- ------------------ ---------- ------ ----- ----- -------------------------
leaf01(P)         leaf02            44:38:39:be:ef:aa  up         up     8     8     Tue Oct 27 10:44:39 2020
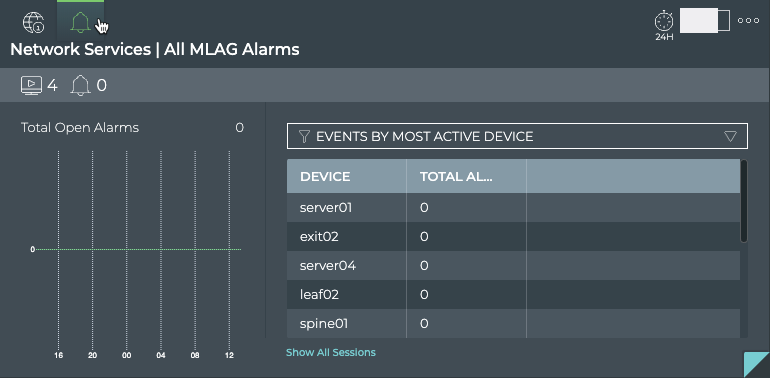
View Switches with the Most MLAG-related Alarms
Switches experiencing a large number of MLAG alarms might indicate a configuration or performance issue that needs further investigation. You can view this information using the NetQ UI or NetQ CLI.
With the NetQ UI, you can view the switches sorted by the number of MLAG alarms and then use the Switches card workflow or the Events|Alarms card workflow to gather more information about possible causes for the alarms.
To view switches with most MLAG alarms:
Open the large Network Services|All MLAG Sessions card.
Hover over the header and click
 .
.Select Events by Most Active Device from the filter above the table.
The table content sorts by this characteristic, listing nodes with the most MLAG alarms at the top. Scroll down to view those with the fewest alarms.
Where to go next depends on what data you see, but a few options include:
- Change the time period for the data to compare with a prior time. If the same switches are consistently indicating the most alarms, you might want to look more carefully at those switches using the Switches card workflow.
- Click Show All Sessions to investigate all MLAG sessions with alarms in the full-screen card.
To view the switches and hosts with the most MLAG alarms and informational events, run the netq show events command with the type option set to clag, and optionally the between option set to display the events within a given time range. Count the events associated with each switch.
This example shows that no MLAG events have occurred in the last 24 hours. Note that this command still uses the clag nomenclature.
cumulus@switch:~$ netq show events type clag
No matching event records found
This example shows all MLAG events between now and 30 days ago, a total of 1 info event.
cumulus@switch:~$ netq show events type clag between now and 30d
Matching events records:
Hostname          Message Type             Severity         Message                             Timestamp
----------------- ------------------------ ---------------- ----------------------------------- -------------------------
border02          clag                     info             Peer state changed to up            Fri Oct  2 22:39:28 2020
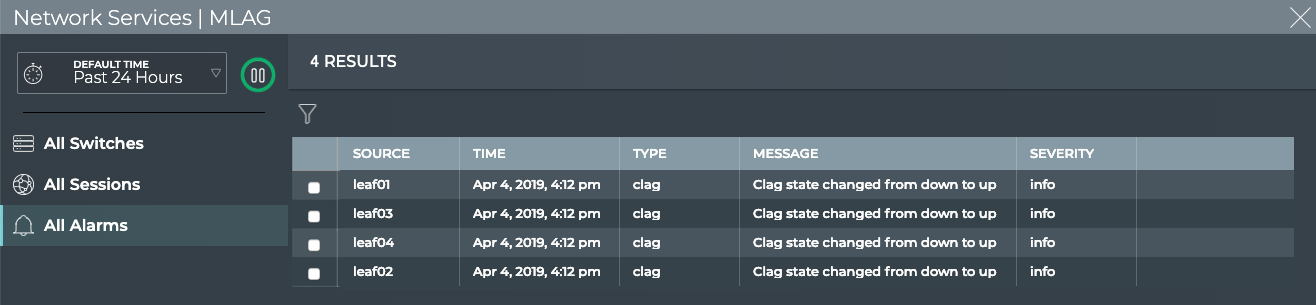
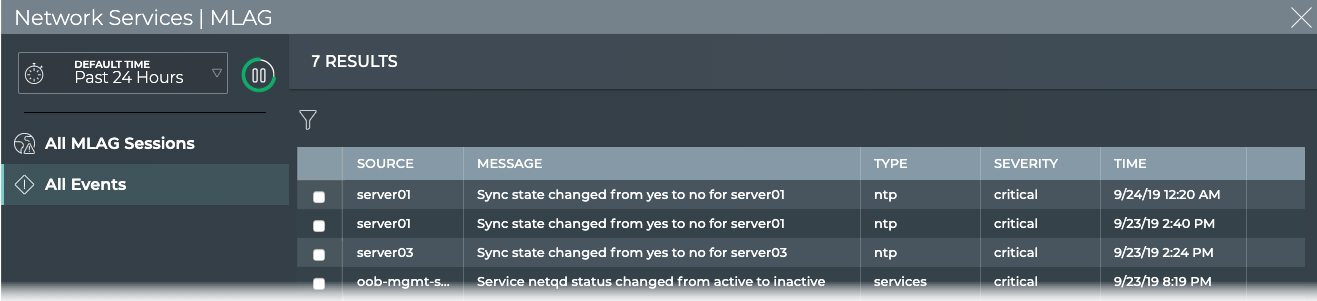
View All MLAG Events
The Network Services|All MLAG Sessions card workflow and the netq show events type mlag command enable you to view all MLAG events in a designated time period.
To view all MLAG events:
Open the Network Services|All MLAG Sessions card.
Change to the full-screen card using the card size picker.
Click All Alarms tab.
By default, events sort by most recent to least recent.
Where to go next depends on what data you see, but a few options include:
- Sort on various parameters:
- By Message to determine the frequency of particular events.
- By Severity to determine the most critical events.
- By Time to find events that might have occurred at a particular time to try to correlate them with other system events.
- Export the data to a file for use in another analytics tool by clicking
 .
. - Return to your workbench by clicking
 in the top right corner.
To view all MLAG alarms, run:
netq show events [level info | level error | level warning | level critical | level debug] type clag [between <text-time> and <text-endtime>] [json]
Use the level option to set the severity of the events to show. Use the between option to show events within a given time range.
This example shows that no MLAG events have occurred in the last three days.
cumulus@switch:~$ netq show events type clag between now and 3d
No matching event records found
This example shows that one MLAG event occurred in the last 30 days.
cumulus@switch:~$ netq show events type clag between now and 30d
Matching events records:
Hostname          Message Type             Severity         Message                             Timestamp
----------------- ------------------------ ---------------- ----------------------------------- -------------------------
border02          clag                     info             Peer state changed to up            Fri Oct  2 22:39:28 2020
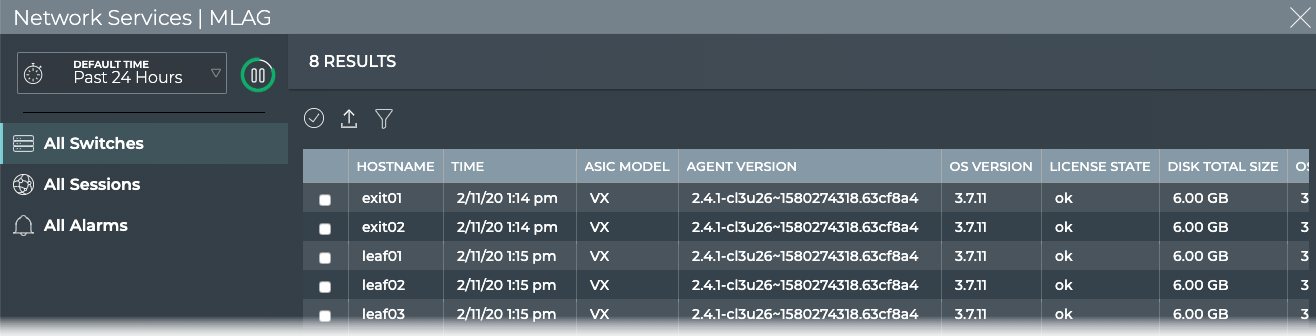
View Details About All Switches Running MLAG
You can view attributes of all switches running MLAG in your network in the full-screen card.
To view all switch details:
Open the Network Services|All MLAG Sessions card.
Change to the full-screen card using the card size picker.
Click the All Switches tab.
To return to your workbench, click ![]() in the top right corner.
in the top right corner.
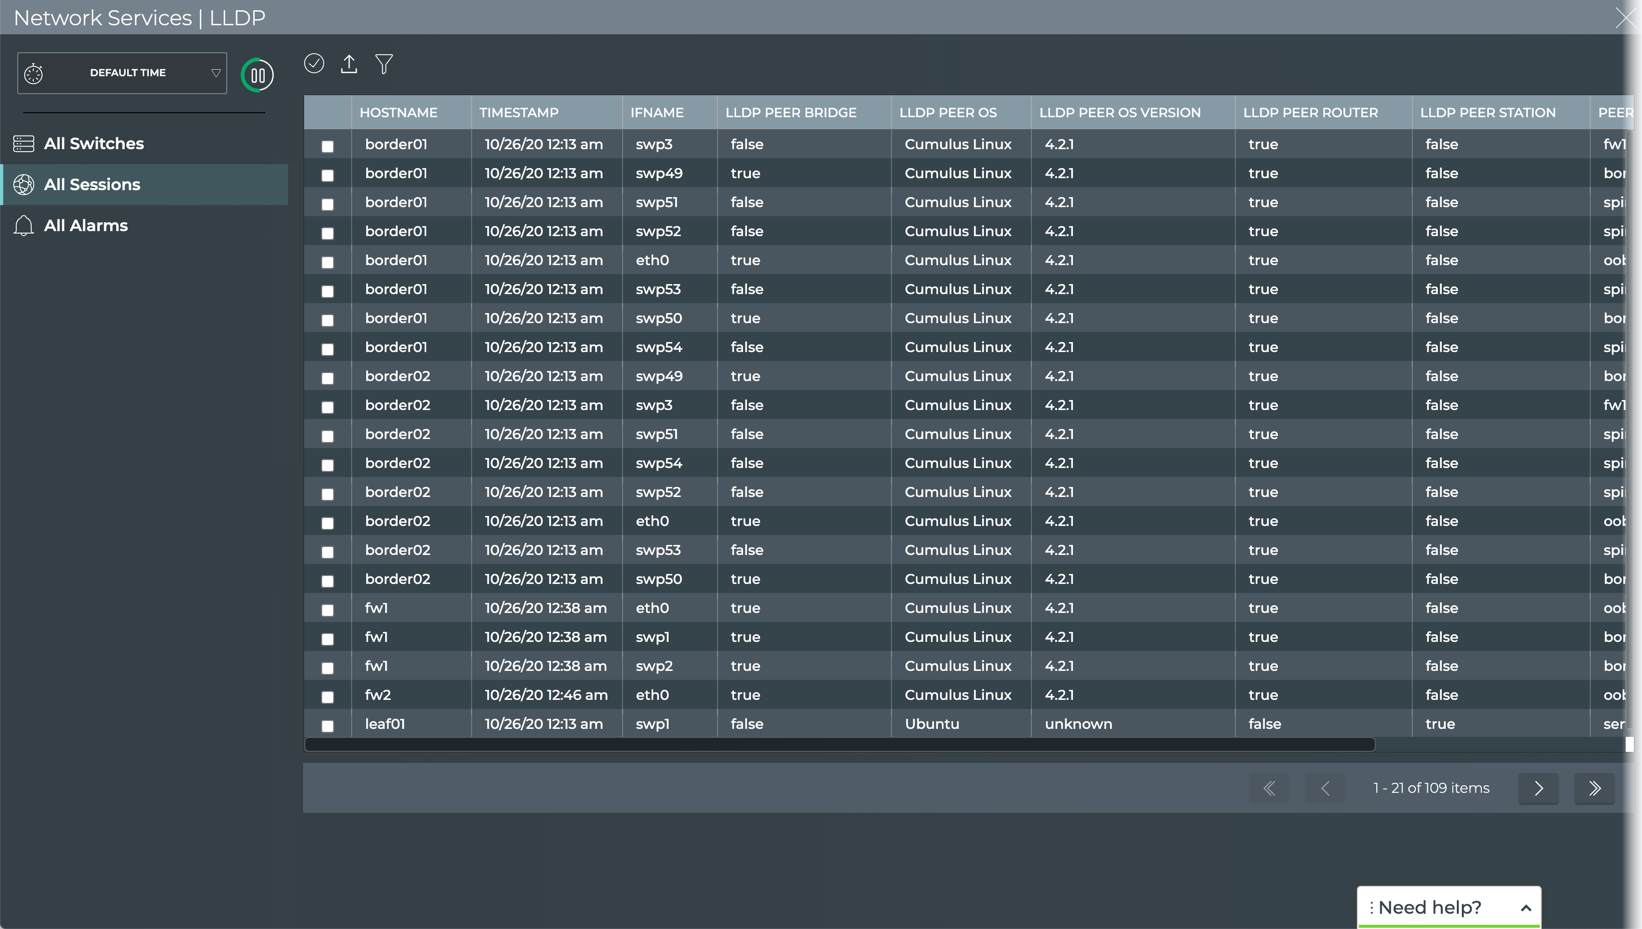
View Details for All MLAG Sessions
You can view attributes of all MLAG sessions in your network with the NetQ UI or NetQ CLI.
To view all session details:
Open the Network Services|All MLAG Sessions card.
Change to the full-screen card using the card size picker.
Click the All Sessions tab.
Return to your workbench by clicking ![]() in the top right corner.
in the top right corner.
To view session details, run netq show mlag.
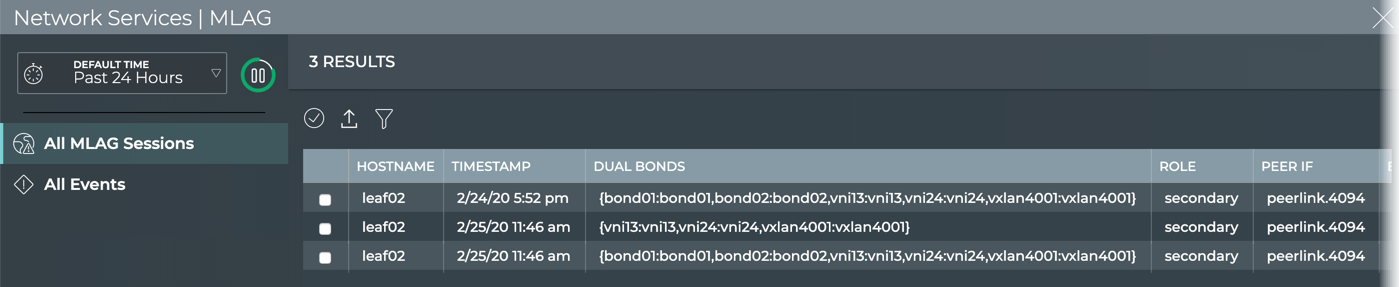
This example shows all current sessions (one per row) and the attributes associated with them.
cumulus@switch:~$ netq show mlag
Matching clag records:
Hostname          Peer              SysMac             State      Backup #Bond #Dual Last Changed
                                                                         s
----------------- ----------------- ------------------ ---------- ------ ----- ----- -------------------------
border01(P)       border02          44:38:39:be:ef:ff  up         up     3     3     Tue Oct 27 10:50:26 2020
border02          border01(P)       44:38:39:be:ef:ff  up         up     3     3     Tue Oct 27 10:46:38 2020
leaf01(P)         leaf02            44:38:39:be:ef:aa  up         up     8     8     Tue Oct 27 10:44:39 2020
leaf02            leaf01(P)         44:38:39:be:ef:aa  up         up     8     8     Tue Oct 27 10:52:15 2020
leaf03(P)         leaf04            44:38:39:be:ef:bb  up         up     8     8     Tue Oct 27 10:48:07 2020
leaf04            leaf03(P)         44:38:39:be:ef:bb  up         up     8     8     Tue Oct 27 10:48:18 2020
Monitor a Single MLAG Session
With NetQ, you can monitor the number of nodes running the MLAG service, view switches with the most peers alive and not alive, and view alarms triggered by the MLAG service. For an overview and how to configure MLAG in your data center network, refer to Multi-Chassis Link Aggregation - MLAG.
To access the single session cards, you must open the full-screen Network Services|All MLAG Sessions card, click the All Sessions tab, select the desired session, then click ![]() (Open Card).
(Open Card).
Granularity of Data Shown Based on Time Period
On the medium and large single MLAG session cards, vertically stacked heat maps represent the status of the peers; one for peers that are reachable (alive), and one for peers that are unreachable (not alive). Depending on the time period of data on the card, the number of smaller time blocks used to indicate the status varies. A vertical stack of time blocks, one from each map, includes the results from all checks during that time. The amount of saturation for each block indicates how many peers were alive. If all peers during that time period were alive for the entire time block, then the top block is 100% saturated (white) and the not alive block is zero percent saturated (gray). As peers that are not alive increase in saturation, the amount of saturation diminishes proportionally for peers that are in the alive block. The example below shows a heat map for a time period of 24 hours with the most common time periods in the table showing the resulting time blocks.
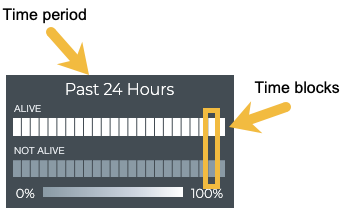
| Time Period | Number of Runs | Number Time Blocks | Amount of Time in Each Block |
|---|---|---|---|
| 6 hours | 18 | 6 | 1 hour |
| 12 hours | 36 | 12 | 1 hour |
| 24 hours | 72 | 24 | 1 hour |
| 1 week | 504 | 7 | 1 day |
| 1 month | 2,086 | 30 | 1 day |
| 1 quarter | 7,000 | 13 | 1 week |
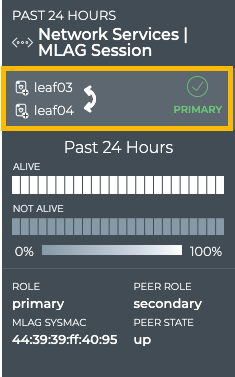
View Session Status Summary
A summary of the MLAG session is available about a given MLAG session using the NetQ UI or NetQ CLI.
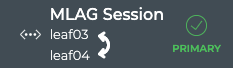
A summary of the MLAG session is available from the Network Services|MLAG Session card workflow, showing the host and peer devices participating in the session, node role, peer role and state, the associated system MAC address, and the distribution of the MLAG session state.
To view the summary:
Open or add the Network Services|All MLAG Sessions card.
Change to the full-screen card using the card size picker.
Click the All Sessions tab.
Select the session of interest, then click
 (Open Card).
Locate the medium Network Services|MLAG Session card.
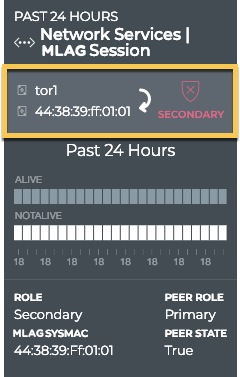
- Optionally, open the small Network Services|MLAG Session card to keep track of the session health.
Run the netq show mlag command with the hostname option.
This example shows the session information when the leaf01 switch is acting as the primary role in the session.
cumulus@switch:~$ netq leaf01 show mlag
Matching clag records:
Hostname          Peer              SysMac             State      Backup #Bond #Dual Last Changed
                                                                         s
----------------- ----------------- ------------------ ---------- ------ ----- ----- -------------------------
leaf01(P)         leaf02            44:38:39:be:ef:aa  up         up     8     8     Tue Oct 27 10:44:39 2020
View MLAG Session Peering State Changes
You can view the peering state for a given MLAG session from the medium and large MLAG Session cards. For a given time period, you can determine the stability of the MLAG session between two devices. If you experienced connectivity issues at a particular time, you can use these cards to help verify the state of the peer. If the peer was not alive more than it was alive, you can then investigate further into possible causes.
To view the state transitions for a given MLAG session on the medium card:
Open the or add the Network Services|All MLAG Sessions card.
Change to the full-screen card using the card size picker.
Click the All Sessions tab.
Select the session of interest, then click
(Open Card).Locate the medium Network Services|MLAG Session card.
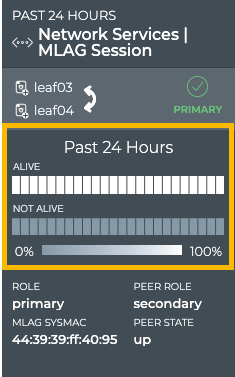
In this example, the heat map tells us that the peer switch has been alive for the entire 24-hour period.
From this card, you can also view the node role, peer role and state, and MLAG system MAC address which identify the session in more detail.
To view the peering state transitions for a given MLAG session on the large Network Services|MLAG Session card:
Open a Network Services|MLAG Session card.
Hover over the card, and change to the large card using the card size picker.
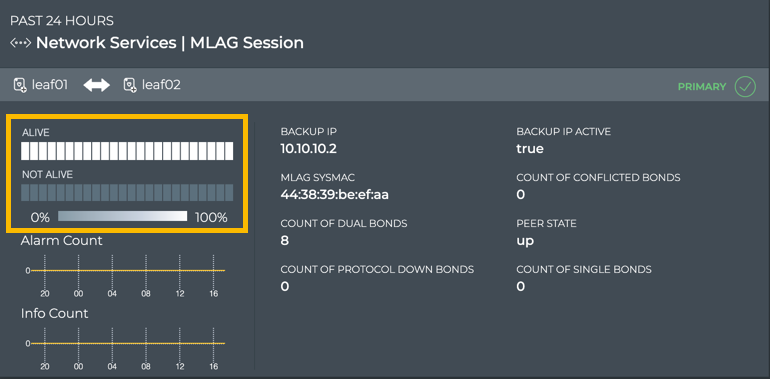
From this card, you can also view the alarm and info event counts, node role, peer role, state, and interface, MLAG system MAC address, active backup IP address, single, dual, conflicted, and protocol down bonds, and the VXLAN anycast address identifying the session in more detail.
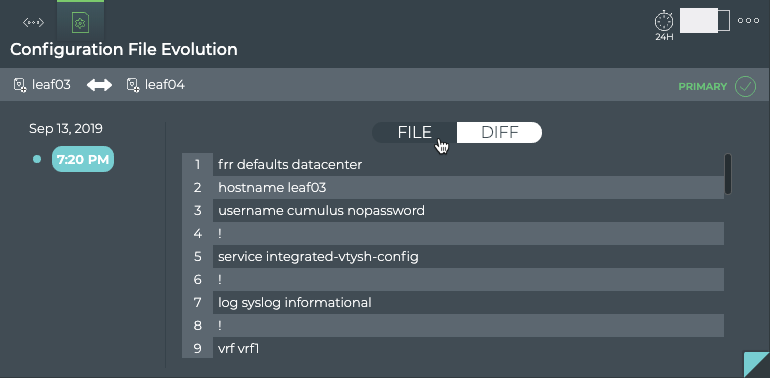
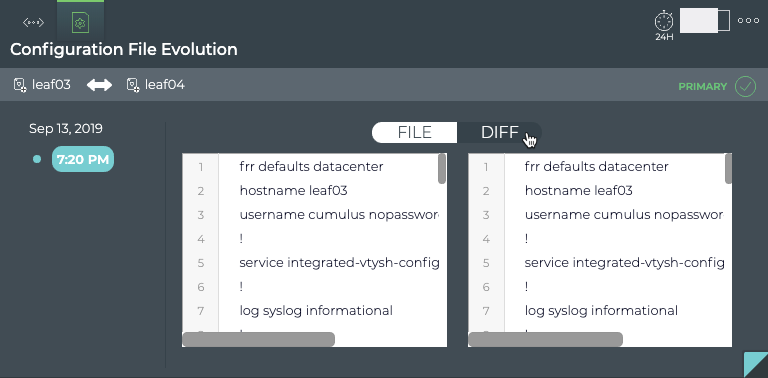
View Changes to the MLAG Service Configuration File
Each time a change is made to the configuration file for the MLAG service, NetQ logs the change and enables you to compare it with the last version using the NetQ UI. This can be useful when you are troubleshooting potential causes for alarms or sessions losing their connections.
To view the configuration file changes:
Open or add the Network Services|All MLAG Sessions card.
Switch to the full-screen card using the card size picker.
Click the All Sessions tab.
Select the session of interest, then click
(Open Card).Locate the medium Network Services|MLAG Session card.
Hover over the card, and change to the large card using the card size picker.
Hover over the card and click
 to open the Configuration File Evolution tab.
Select the time of interest on the left; when a change might have impacted the performance. Scroll down if needed.
Choose between the File view and the Diff view (selected option is dark; File by default).
The File view displays the content of the file for you to review.
The Diff view displays the changes between this version (on left) and the most recent version (on right) side by side. The changes are highlighted in red and green. In this example, we don’t have any changes after this first creation, so the same file is shown on both sides and no highlighting is present.
All MLAG Session Details
You can view attributes of all of the MLAG sessions for the devices participating in a given session with the NetQ UI and the NetQ CLI.
To view all session details:
Open or add the Network Services|All MLAG Sessions card.
Switch to the full-screen card using the card size picker.
Click the All Sessions tab.
Select the session of interest, then click
(Open Card).Locate the medium Network Services|MLAG Session card.
Hover over the card, and change to the full-screen card using the card size picker. The All MLAG Sessions tab is displayed by default.
Where to go next depends on what data you see, but a few options include:
- Open the All Events tabs to look more closely at the alarm and info events fin the network.
- Sort on other parameters:
- By Single Bonds to determine which interface sets are only connected to one of the switches.
- By Backup IP and Backup IP Active to determine if the correct backup IP address is specified for the service.
- Export the data to a file by clicking .
- Return to your workbench by clicking in the top right corner.
Run the netq show mlag command.
This example shows all MLAG sessions in the last 24 hours.
cumulus@switch:~$ netq show mlag
Matching clag records:
Hostname          Peer              SysMac             State      Backup #Bond #Dual Last Changed
                                                                         s
----------------- ----------------- ------------------ ---------- ------ ----- ----- -------------------------
border01(P)       border02          44:38:39:be:ef:ff  up         up     3     3     Tue Oct 27 10:50:26 2020
border02          border01(P)       44:38:39:be:ef:ff  up         up     3     3     Tue Oct 27 10:46:38 2020
leaf01(P)         leaf02            44:38:39:be:ef:aa  up         up     8     8     Tue Oct 27 10:44:39 2020
leaf02            leaf01(P)         44:38:39:be:ef:aa  up         up     8     8     Tue Oct 27 10:52:15 2020
leaf03(P)         leaf04            44:38:39:be:ef:bb  up         up     8     8     Tue Oct 27 10:48:07 2020
leaf04            leaf03(P)         44:38:39:be:ef:bb  up         up     8     8     Tue Oct 27 10:48:18 2020
View All MLAG Session Events
You can view all alarm and info events for the two devices on this card.
Open or add the Network Services|All MLAG Sessions card.
Switch to the full-screen card using the card size picker.
Click the All Sessions tab.
Select the session of interest, then click
(Open Card).Locate the medium Network Services|MLAG Session card.
Hover over the card, and change to the full-screen card using the card size picker.
Click the All Events tab.
Where to go next depends on what data you see, but a few options include:
- Sort on other parameters:
- By Message to determine the frequency of particular events.
- By Severity to determine the most critical events.
- By Time to find events that might have occurred at a particular time to try to correlate them with other system events.
- Export the data to a file by clicking .
- Return to your workbench by clicking in the top right corner.