Monitor Switch Performance
With the NetQ UI and NetQ CLI, you can monitor the health of individual switches, including interface performance and resource utilization.
Three categories of performance metrics are available for switches:
- System configuration: alarms, interfaces, IP and MAC addresses, VLANs, IP routes, IP neighbors, and installed software packages
- Utilization statistics: CPU, memory, disk, ACL and forwarding resources, SSD, and BTRFS
- Physical sensing: digital optics and chassis sensors
For information about the health of network services and protocols (BGP, EVPN, NTP, and so forth) running on switches, refer to the relevant layer monitoring topic.
For switch inventory information for all switches (ASIC, platform, CPU, memory, disk, and OS), refer to Monitor Switch Inventory.
View Overall Health
The NetQ UI provides several views that enable users to easily track the overall health of switch, some high-level metrics, and attributes of the switch.
View Overall Health of a Switch
When you want to view an overview of the current or past health of a particular switch, open the NetQ UI small Switch card. It is unlikely that you would have this card open for every switch in your network at the same time, but it is useful for tracking selected switches that might have been problematic in the recent past or that you have recently installed. The card shows you alarm status, a summary health score, and health trend.
To view the summary:
Click
 (Switches), then click Open a switch card.
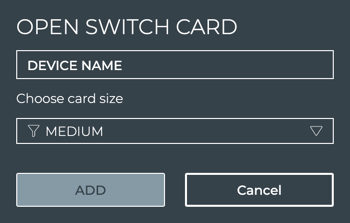
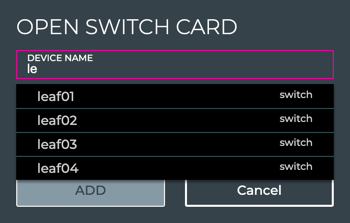
Begin typing the hostname of the switch you are interested in. Select it from the suggested matches when it appears.
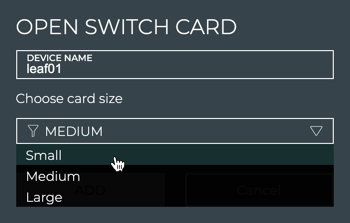
Select Small from the card size dropdown.
Click Add.
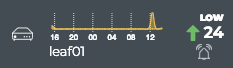
This example shows the leaf01 switch has had very few alarms overall, but the number is trending upward, with a total count of 24 alarms currently.
View High-Level Health Metrics
When you are monitoring switches that have been problematic or are newly installed, you might want to view more than a summary. Instead, seeing key performance metrics can help you determine where issues might be occurring or how new devices are functioning in the network.
To view the key metrics, use the NetQ UI to open the medium Switch card. The card shows you the overall switch health score and the scores for the key metrics that comprise that score. The key metric scores are based on the number of alarms attributed to the following activities on the switch:
- Network services, such as BGP, EVPN, MLAG, NTP, and so forth
- Interface performance
- System performance
Locate or open the relevant Switch card:
Click
(Switches), then click Open a switch card.Begin typing the hostname of the device you are interested in. Select it from the suggested matches when it appears.
Click Add.
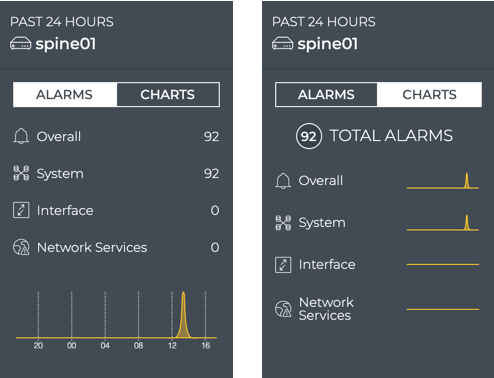
Also included on the card is the total alarm count for all of these metrics. You can view the key performance metrics as numerical scores or as line charts over time, by clicking Alarms or Charts at the top of the card.
View Switch Attributes
For a quick look at the key attributes of a particular switch, open the large Switch card.
Locate or open the relevant Switch card:
- Hover over the card, then change to the large card using the card size picker.
OR
Click
(Switches), then click Open a switch card.Begin typing the hostname of the device you are interested in. Select it from the suggested matches when it appears.
Select Large from the card size dropdown.
Click Add.
Attributes are displayed as the default tab on the large Switch card. You can view the static information about the switch, including its hostname, addresses, server and ASIC vendors and models, OS and NetQ software information. You can also view the state of the interfaces and NetQ Agent on the switch.
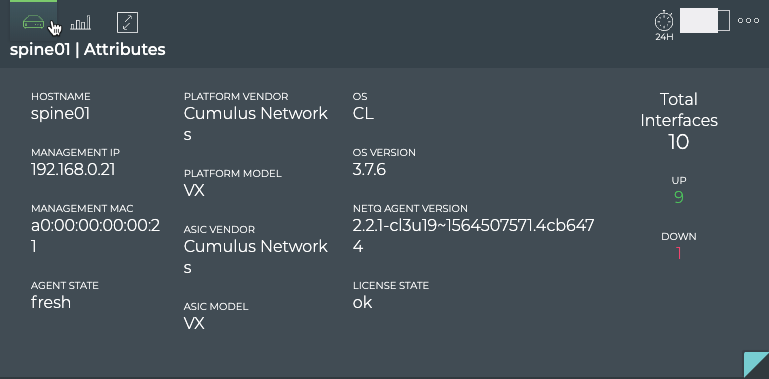
From a performance perspective, this example shows that five interfaces are down and the NetQ Agent is communicating with the NetQ appliance or VM. Investigate the interfaces (refer to interface statistics).
System Configuration
At some point in the lifecycle of a switch, you are likely to want more detail about how the switch is configured and what software is running on it. The NetQ UI and the NetQ CLI can provide this information.
View All Switch Alarms
You can focus on all critical alarms for a given switch using the NetQ UI or NetQ CLI.
To view all alarms:
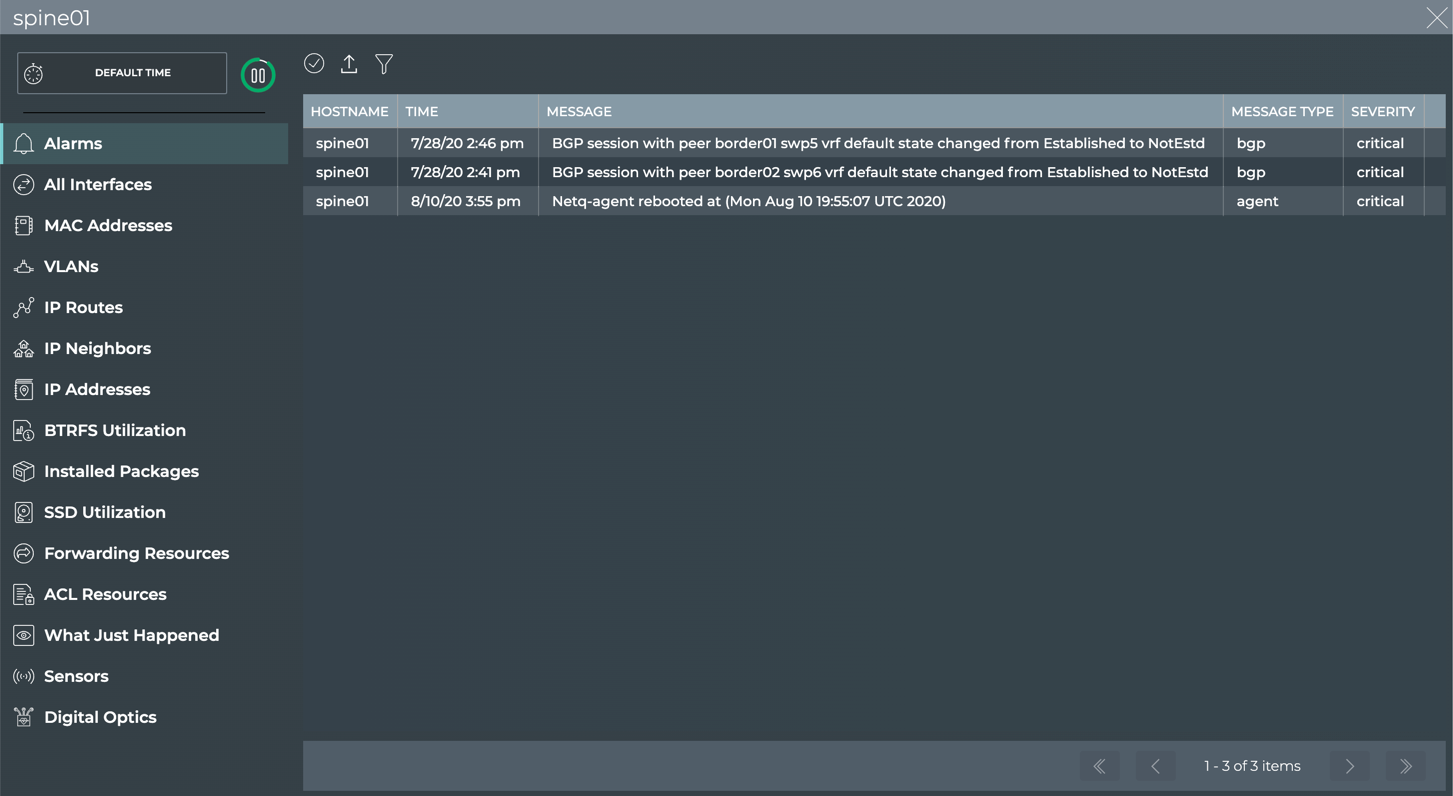
- Open the full-screen Switch card and click Alarms.
Use the filter to sort by message type.
Use the filter to look at alarms during a different time range.
Return to your workbench by clicking
 in the top right corner.
To view all critical alarms on the switch, run:
netq <hostname> show events level critical [between <text-time> and <text-endtime>] [json]
This example shows the critical alarms on spine01 in the last two months.
cumulus@switch:~$ netq spine01 show events level critical between now and 60d
Matching events records:
Hostname          Message Type             Severity         Message                             Timestamp
----------------- ------------------------ ---------------- ----------------------------------- -------------------------
spine01           agent                    critical         Netq-agent rebooted at (Mon Aug 10  Mon Aug 10 19:55:19 2020
                                                            19:55:07 UTC 2020)
View Status of All Interfaces
You can view all configured interfaces on a switch in one place making it easier to see inconsistencies in the configuration, quickly see when changes occurred, and the operational status.
To view all interfaces:
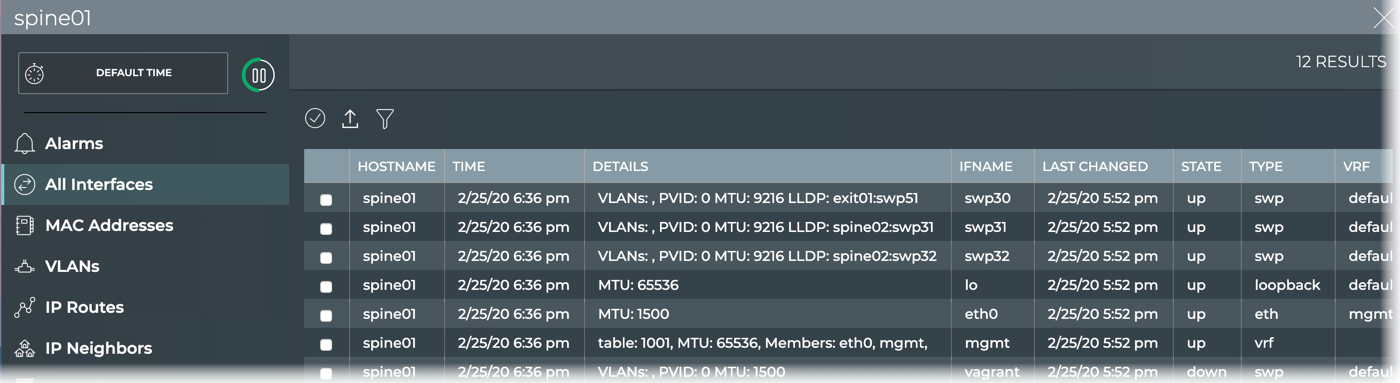
- Open the full-screen Switch card and click All Interfaces.
Look for interfaces that are down, shown in the State column.
Look for recent changes to the interfaces, shown in the Last Changed column.
View details about each interface, shown in the Details column.
Verify they are of the correct kind for their intended function, shown in the Type column.
Verify the correct VRF interface is assigned to an interface, shown in the VRF column.
To return to the workbench, click
in the top right corner.
You can view all interfaces or filter by the interface type.
To view all interfaces, run:
netq <hostname> show interfaces [<remote-interface>] [state <remote-interface-state>] [around <text-time>] [count] [json]
To view interfaces of a particular type, run:
netq <hostname> show interfaces type (bond|bridge|eth|loopback|macvlan|swp|vlan|vrf|vxlan) [state <remote-interface-state>] [around <text-time>] [count] [json]
This example shows all interfaces on the spine01 switch.
cumulus@switch:~$ netq spine01 show interfaces
Matching link records:
Hostname          Interface                 Type             State      VRF             Details                             Last Changed
----------------- ------------------------- ---------------- ---------- --------------- ----------------------------------- -------------------------
spine01           swp5                      swp              up         default         VLANs: ,                            Wed Sep 16 19:57:26 2020
                                                                                        PVID: 0 MTU: 9216 LLDP: border01:sw
                                                                                        p51
spine01           swp6                      swp              up         default         VLANs: ,                            Wed Sep 16 19:57:26 2020
                                                                                        PVID: 0 MTU: 9216 LLDP: border02:sw
                                                                                        p51
spine01           eth0                      eth              up         mgmt            MTU: 1500                           Wed Sep 16 19:57:26 2020
spine01           lo                        loopback         up         default         MTU: 65536                          Wed Sep 16 19:57:26 2020
spine01           vagrant                   swp              down       default         VLANs: , PVID: 0 MTU: 1500          Wed Sep 16 19:57:26 2020
spine01           mgmt                      vrf              up                         table: 1001, MTU: 65536,            Wed Sep 16 19:57:26 2020
                                                                                        Members:  eth0,  mgmt,
spine01           swp1                      swp              up         default         VLANs: ,                            Wed Sep 16 19:57:26 2020
                                                                                        PVID: 0 MTU: 9216 LLDP: leaf01:swp5
                                                                                        1
spine01           swp2                      swp              up         default         VLANs: ,                            Wed Sep 16 19:57:26 2020
                                                                                        PVID: 0 MTU: 9216 LLDP: leaf02:swp5
                                                                                        1
spine01           swp3                      swp              up         default         VLANs: ,                            Wed Sep 16 19:57:26 2020
                                                                                        PVID: 0 MTU: 9216 LLDP: leaf03:swp5
                                                                                        1
spine01           swp4                      swp              up         default         VLANs: ,                            Wed Sep 16 19:57:26 2020
                                                                                        PVID: 0 MTU: 9216 LLDP: leaf04:swp5
                                                                                        1
This example shows all swp type interfaces on the spine01 switch.
cumulus@switch:~$ netq spine01 show interfaces type swp
Matching link records:
Hostname          Interface                 Type             State      VRF             Details                             Last Changed
----------------- ------------------------- ---------------- ---------- --------------- ----------------------------------- -------------------------
spine01           swp5                      swp              up         default         VLANs: ,                            Wed Sep 16 19:57:26 2020
                                                                                        PVID: 0 MTU: 9216 LLDP: border01:sw
                                                                                        p51
spine01           swp6                      swp              up         default         VLANs: ,                            Wed Sep 16 19:57:26 2020
                                                                                        PVID: 0 MTU: 9216 LLDP: border02:sw
                                                                                        p51
spine01           vagrant                   swp              down       default         VLANs: , PVID: 0 MTU: 1500          Wed Sep 16 19:57:26 2020
spine01           mgmt                      vrf              up                         table: 1001, MTU: 65536,            Wed Sep 16 19:57:26 2020
                                                                                        Members:  eth0,  mgmt,
spine01           swp1                      swp              up         default         VLANs: ,                            Wed Sep 16 19:57:26 2020
                                                                                        PVID: 0 MTU: 9216 LLDP: leaf01:swp5
                                                                                        1
spine01           swp2                      swp              up         default         VLANs: ,                            Wed Sep 16 19:57:26 2020
                                                                                        PVID: 0 MTU: 9216 LLDP: leaf02:swp5
                                                                                        1
spine01           swp3                      swp              up         default         VLANs: ,                            Wed Sep 16 19:57:26 2020
                                                                                        PVID: 0 MTU: 9216 LLDP: leaf03:swp5
                                                                                        1
spine01           swp4                      swp              up         default         VLANs: ,                            Wed Sep 16 19:57:26 2020
                                                                                        PVID: 0 MTU: 9216 LLDP: leaf04:swp5
                                                                                        1
View All MAC Addresses on a Switch
You can view all MAC address currently used by a switch using the NetQ UI or the NetQ CLI.
- Open the full-screen switch card for the switch of interest.
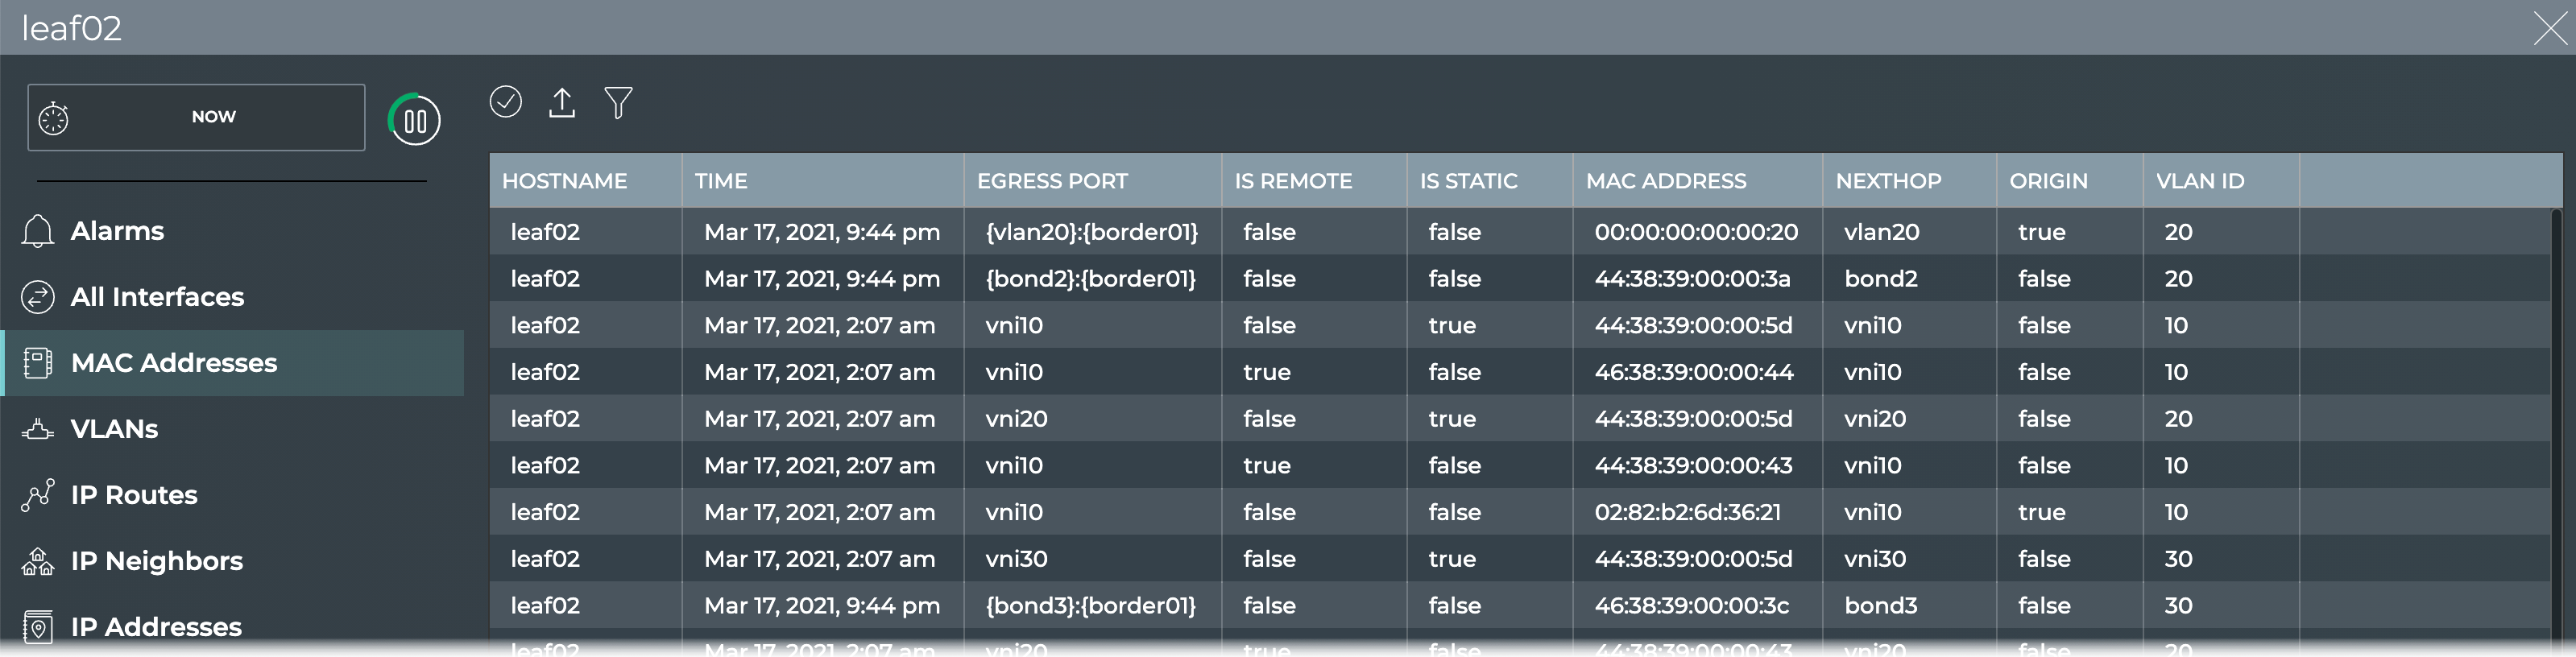
Review the addresses.
Optionally, click
 to filter by MAC address, VLAN, origin, or alternate time range.
You can view all MAC addresses on a switch, or filter the list to view a particular address, only the addresses on the egress port, a particular VLAN, or those that are owned by the switch. You can also view the number addresses.
Use the following commands to obtain this MAC address information:
netq <hostname> show macs [<mac>] [vlan <1-4096>] [origin | count] [around <text-time>] [json]
netq <hostname> show macs egress-port <egress-port> [<mac>] [vlan <1-4096>] [origin] [around <text-time>] [json]
This example shows all MAC addresses on the leaf01 switch:
cumulus@switch:~$ netq leaf01 show macs
Matching mac records:
Origin MAC Address        VLAN   Hostname          Egress Port                    Remote Last Changed
------ ------------------ ------ ----------------- ------------------------------ ------ -------------------------
yes    00:00:00:00:00:1a  10     leaf01            bridge                         no     Wed Sep 16 16:16:09 2020
no     44:38:39:00:00:5d  30     leaf01            vni30030:leaf03                yes    Wed Sep 16 16:16:09 2020
no     46:38:39:00:00:46  20     leaf01            vni30020:leaf03                yes    Wed Sep 16 16:16:09 2020
no     44:38:39:00:00:5e  20     leaf01            vni30020:leaf03                yes    Wed Sep 16 16:16:09 2020
yes    44:38:39:00:00:59  30     leaf01            bridge                         no     Wed Sep 16 16:16:09 2020
yes    44:38:39:00:00:59  4001   leaf01            bridge                         no     Wed Sep 16 16:16:09 2020
yes    44:38:39:00:00:59  4002   leaf01            bridge                         no     Wed Sep 16 16:16:09 2020
no     44:38:39:00:00:36  30     leaf01            {bond3}:{server03}             no     Wed Sep 16 16:16:09 2020
yes    44:38:39:00:00:59  20     leaf01            bridge                         no     Wed Sep 16 16:16:09 2020
yes    44:38:39:be:ef:aa  4001   leaf01            bridge                         no     Wed Sep 16 16:16:09 2020
yes    44:38:39:00:00:59  10     leaf01            bridge                         no     Wed Sep 16 16:16:09 2020
no     46:38:39:00:00:48  30     leaf01            vni30030:leaf03                yes    Wed Sep 16 16:16:09 2020
yes    44:38:39:be:ef:aa  4002   leaf01            bridge                         no     Wed Sep 16 16:16:09 2020
no     46:38:39:00:00:38  10     leaf01            {bond1}:{server01}             no     Wed Sep 16 16:16:09 2020
no     46:38:39:00:00:36  30     leaf01            {bond3}:{server03}             no     Wed Sep 16 16:16:09 2020
no     44:38:39:00:00:34  20     leaf01            {bond2}:{server02}             no     Wed Sep 16 16:16:09 2020
no     44:38:39:00:00:5e  30     leaf01            vni30030:leaf03                yes    Wed Sep 16 16:16:09 2020
no     44:38:39:00:00:3e  10     leaf01            vni30010:leaf03                yes    Wed Sep 16 16:16:09 2020
no     44:38:39:00:00:42  30     leaf01            vni30030:leaf03                yes    Wed Sep 16 16:16:09 2020
no     46:38:39:00:00:34  20     leaf01            {bond2}:{server02}             no     Wed Sep 16 16:16:09 2020
no     46:38:39:00:00:3c  30     leaf01            {bond3}:{server03}             no     Wed Sep 16 16:16:09 2020
no     46:38:39:00:00:3e  10     leaf01            vni30010:leaf03                yes    Wed Sep 16 16:16:09 2020
no     44:38:39:00:00:5e  10     leaf01            vni30010:leaf03                yes    Wed Sep 16 16:16:09 2020
no     44:38:39:00:00:5d  20     leaf01            vni30020:leaf03                yes    Wed Sep 16 16:16:09 2020
no     44:38:39:00:00:5d  10     leaf01            vni30010:leaf03                yes    Wed Sep 16 16:16:09 2020
yes    00:00:00:00:00:1b  20     leaf01            bridge                         no     Wed Sep 16 16:16:09 2020
...
This example shows all MAC addresses on VLAN 10 on the leaf01 switch:
cumulus@switch:~$ netq leaf01 show macs
Matching mac records:
Origin MAC Address        VLAN   Hostname          Egress Port                    Remote Last Changed
------ ------------------ ------ ----------------- ------------------------------ ------ -------------------------
yes    00:00:00:00:00:1a  10     leaf01            bridge                         no     Wed Sep 16 16:16:09 2020
yes    44:38:39:00:00:59  10     leaf01            bridge                         no     Wed Sep 16 16:16:09 2020
no     46:38:39:00:00:38  10     leaf01            {bond1}:{server01}             no     Wed Sep 16 16:16:09 2020
no     44:38:39:00:00:3e  10     leaf01            vni30010:leaf03                yes    Wed Sep 16 16:16:09 2020
no     46:38:39:00:00:3e  10     leaf01            vni30010:leaf03                yes    Wed Sep 16 16:16:09 2020
no     44:38:39:00:00:5e  10     leaf01            vni30010:leaf03                yes    Wed Sep 16 16:16:09 2020
no     44:38:39:00:00:5d  10     leaf01            vni30010:leaf03                yes    Wed Sep 16 16:16:09 2020
no     44:38:39:00:00:32  10     leaf01            {bond1}:{server01}             no     Wed Sep 16 16:16:09 2020
no     46:38:39:00:00:44  10     leaf01            vni30010:leaf03                yes    Wed Sep 16 16:16:09 2020
no     46:38:39:00:00:32  10     leaf01            {bond1}:{server01}             no     Wed Sep 16 16:16:09 2020
no     44:38:39:00:00:5a  10     leaf01            {peerlink}:{leaf02}            no     Wed Sep 16 16:16:09 2020
no     44:38:39:00:00:62  10     leaf01            vni30010:border01              yes    Wed Sep 16 16:16:09 2020
no     44:38:39:00:00:61  10     leaf01            vni30010:border01              yes    Wed Sep 16 16:16:09 2020
This example shows the total number of MAC address on the leaf01 switch:
cumulus@switch:~$ netq leaf01 show macs count
Count of matching mac records: 55
This example show the addresses on the bridge egress port on the leaf01 switch:
cumulus@switch:~$ netq leaf01 show macs egress-port bridge
Matching mac records:
Origin MAC Address        VLAN   Hostname          Egress Port                    Remote Last Changed
------ ------------------ ------ ----------------- ------------------------------ ------ -------------------------
yes    00:00:00:00:00:1a  10     leaf01            bridge                         no     Thu Sep 17 16:16:11 2020
yes    44:38:39:00:00:59  4001   leaf01            bridge                         no     Thu Sep 17 16:16:11 2020
yes    44:38:39:00:00:59  30     leaf01            bridge                         no     Thu Sep 17 16:16:11 2020
yes    44:38:39:00:00:59  20     leaf01            bridge                         no     Thu Sep 17 16:16:11 2020
yes    44:38:39:00:00:59  4002   leaf01            bridge                         no     Thu Sep 17 16:16:11 2020
yes    44:38:39:00:00:59  10     leaf01            bridge                         no     Thu Sep 17 16:16:11 2020
yes    44:38:39:be:ef:aa  4001   leaf01            bridge                         no     Thu Sep 17 16:16:11 2020
yes    44:38:39:be:ef:aa  4002   leaf01            bridge                         no     Thu Sep 17 16:16:11 2020
yes    00:00:00:00:00:1b  20     leaf01            bridge                         no     Thu Sep 17 16:16:11 2020
yes    00:00:00:00:00:1c  30     leaf01            bridge                         no     Thu Sep 17 16:16:11 2020
View All VLANs on a Switch
You can view all VLANs running on a given switch using the NetQ UI or NetQ CLI.
To view all VLANs on a switch:
- Open the full-screen Switch card and click VLANs.
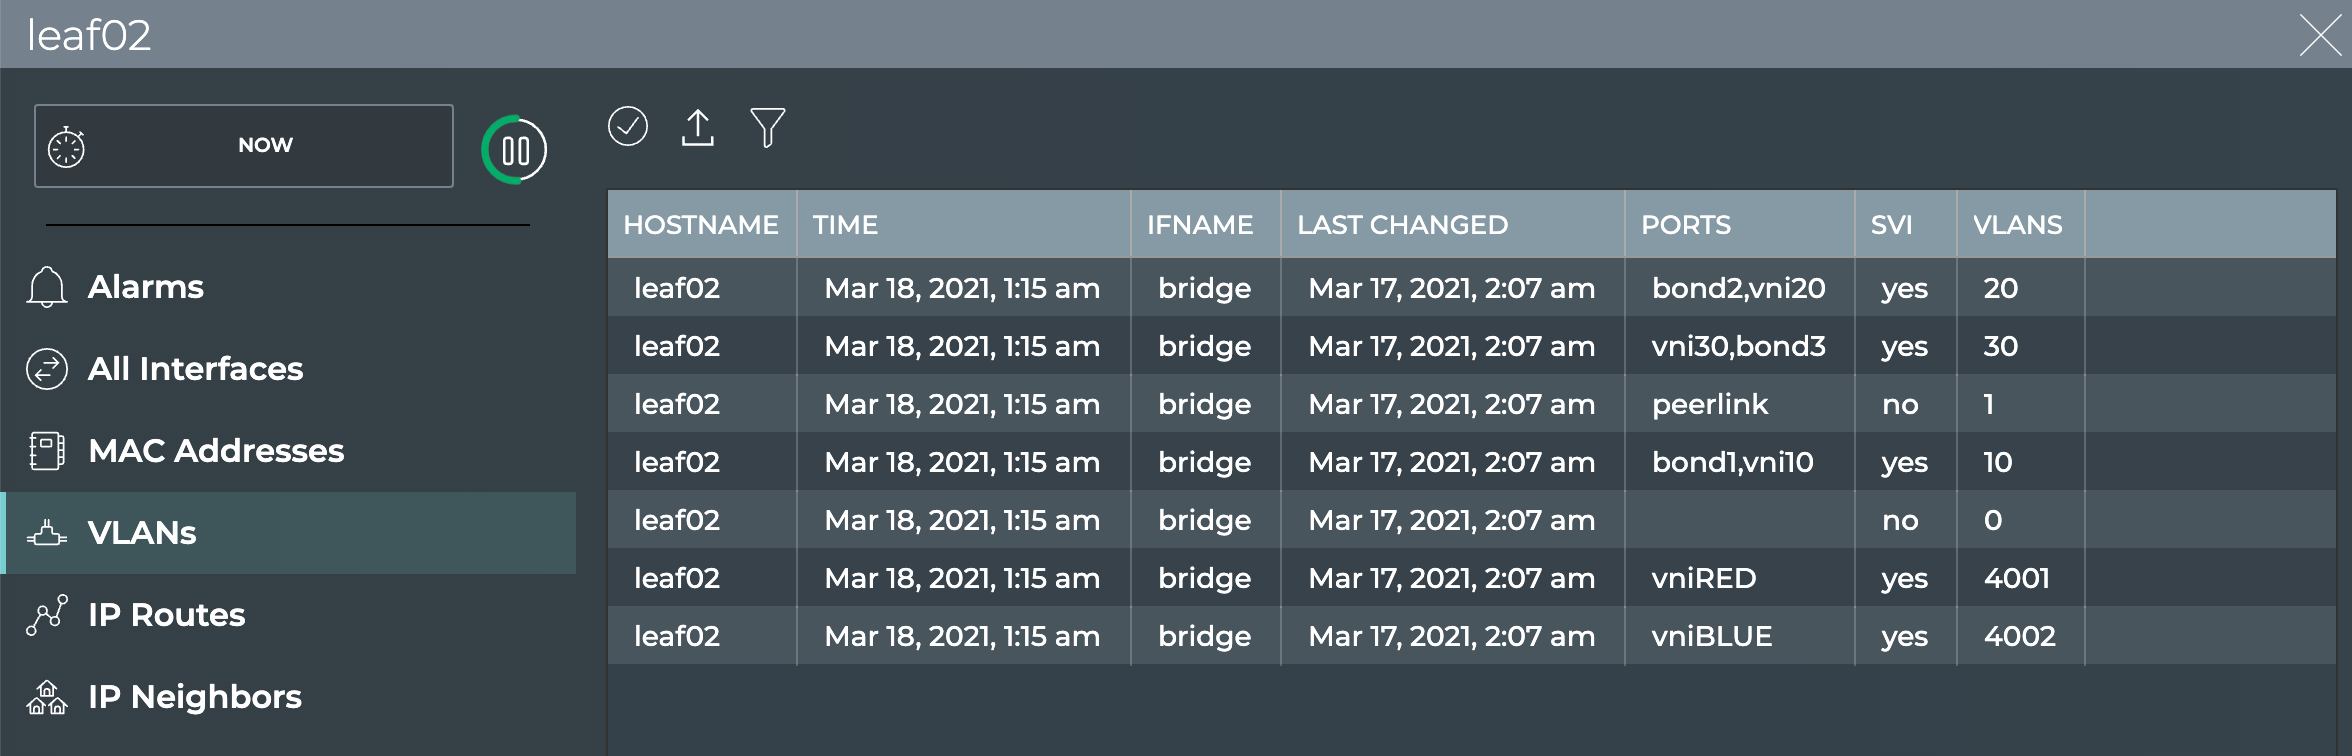
Review the VLANs.
Optionally, click
to filter by interface name or type.
To view all VLANs on a switch, run:
netq <hostname> show interfaces type vlan [state <remote-interface-state>] [around <text-time>] [count] [json]
Filter the output for VLANs with state option to view VLANs that are up or down, the around option to view VLAN information for a time in the past, or the count option to view the total number of VLANs on the device.
This example show all VLANs on the leaf01 switch:
cumulus@switch:~$ netq leaf01 show interfaces type vlan
Matching link records:
Hostname          Interface                 Type             State      VRF             Details                             Last Changed
----------------- ------------------------- ---------------- ---------- --------------- ----------------------------------- -------------------------
leaf01            vlan20                    vlan             up         RED             MTU: 9216                           Thu Sep 17 16:16:11 2020
leaf01            vlan4002                  vlan             up         BLUE            MTU: 9216                           Thu Sep 17 16:16:11 2020
leaf01            vlan4001                  vlan             up         RED             MTU: 9216                           Thu Sep 17 16:16:11 2020
leaf01            vlan30                    vlan             up         BLUE            MTU: 9216                           Thu Sep 17 16:16:11 2020
leaf01            vlan10                    vlan             up         RED             MTU: 9216                           Thu Sep 17 16:16:11 2020
leaf01            peerlink.4094             vlan             up         default         MTU: 9216                           Thu Sep 17 16:16:11 2020
This example shows the total number of VLANs on the leaf01 switch:
cumulus@switch:~$ netq leaf01 show interfaces type vlan count
Count of matching link records: 6
This example shows the VLANs on the leaf01 switch that are down:
cumulus@switch:~$ netq leaf01 show interfaces type vlan state down
No matching link records found
View All IP Routes on a Switch
You can view all IP routes currently used by a switch using the NetQ UI or the NetQ CLI.
To view all IP routes on a switch:
- Open the full-screen Switch card and click IP Routes.
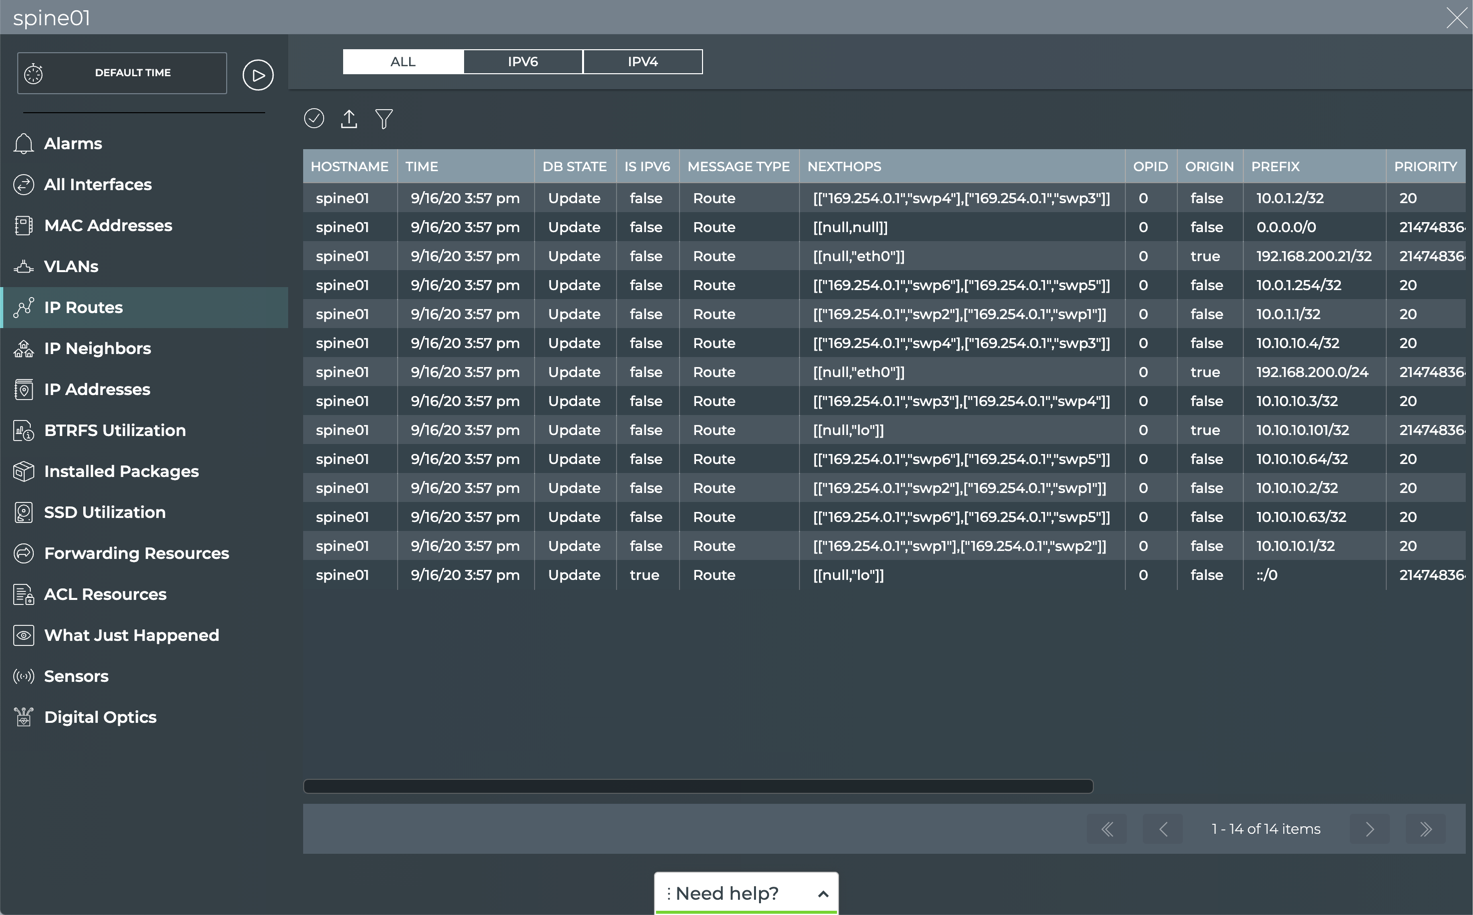
By default all IP routes are listed. Click IPv6 or IPv4 to restrict the list to only those routes.
Optionally, click
to filter by VRF or view a different time period.
To view all IPv4 and IPv6 routes or only IPv4 routes on a switch, run:
netq show ip routes [<ipv4>|<ipv4/prefixlen>] [vrf <vrf>] [origin] [around <text-time>] [json]
Optionally, filter the output with the following options:
ipv4oripv4/prefixlento view a particular IPv4 route on the switchvrfto view routes using a given VRForiginto view routes that the switch ownsaroundto view routes at a time in the past
This example shows all IP routes for the spine01 switch:
cumulus@switch:~$ netq spine01 show ip routes
Matching routes records:
Origin VRF             Prefix                         Hostname          Nexthops                            Last Changed
------ --------------- ------------------------------ ----------------- ----------------------------------- -------------------------
no     default         10.0.1.2/32                    spine01           169.254.0.1: swp3,                  Wed Sep 16 19:57:26 2020
                                                                        169.254.0.1: swp4
no     mgmt            0.0.0.0/0                      spine01           Blackhole                           Wed Sep 16 19:57:26 2020
yes    mgmt            192.168.200.21/32              spine01           eth0                                Wed Sep 16 19:57:26 2020
no     default         10.0.1.254/32                  spine01           169.254.0.1: swp5,                  Wed Sep 16 19:57:26 2020
                                                                        169.254.0.1: swp6
no     default         10.0.1.1/32                    spine01           169.254.0.1: swp1,                  Wed Sep 16 19:57:26 2020
                                                                        169.254.0.1: swp2
no     default         10.10.10.4/32                  spine01           169.254.0.1: swp3,                  Wed Sep 16 19:57:26 2020
                                                                        169.254.0.1: swp4
yes    mgmt            192.168.200.0/24               spine01           eth0                                Wed Sep 16 19:57:26 2020
no     default         10.10.10.3/32                  spine01           169.254.0.1: swp3,                  Wed Sep 16 19:57:26 2020
                                                                        169.254.0.1: swp4
yes    default         10.10.10.101/32                spine01           lo                                  Wed Sep 16 19:57:26 2020
no     default         10.10.10.64/32                 spine01           169.254.0.1: swp5,                  Wed Sep 16 19:57:26 2020
                                                                        169.254.0.1: swp6
no     default         10.10.10.2/32                  spine01           169.254.0.1: swp1,                  Wed Sep 16 19:57:26 2020
                                                                        169.254.0.1: swp2
no     default         10.10.10.63/32                 spine01           169.254.0.1: swp5,                  Wed Sep 16 19:57:26 2020
                                                                        169.254.0.1: swp6
no     default         10.10.10.1/32                  spine01           169.254.0.1: swp1,                  Wed Sep 16 19:57:26 2020
                                                                        169.254.0.1: swp2
This example shows information for the IPv4 route at 10.10.10.1 on the spine01 switch:
cumulus@switch:~$ netq spine01 show ip routes 10.10.10.1

Matching routes records:
Origin VRF             Prefix                         Hostname          Nexthops                            Last Changed
------ --------------- ------------------------------ ----------------- ----------------------------------- -------------------------
no     default         10.10.10.1/32                  spine01           169.254.0.1: swp1,                  Wed Sep 16 19:57:26 2020
                                                                        169.254.0.1: swp2
View All IP Neighbors on a Switch
You can view all IP neighbors currently known by a switch using the NetQ UI or the NetQ CLI.
To view all IP neighbors on a switch:
- Open the full-screen Switch card and click IP Neighbors.
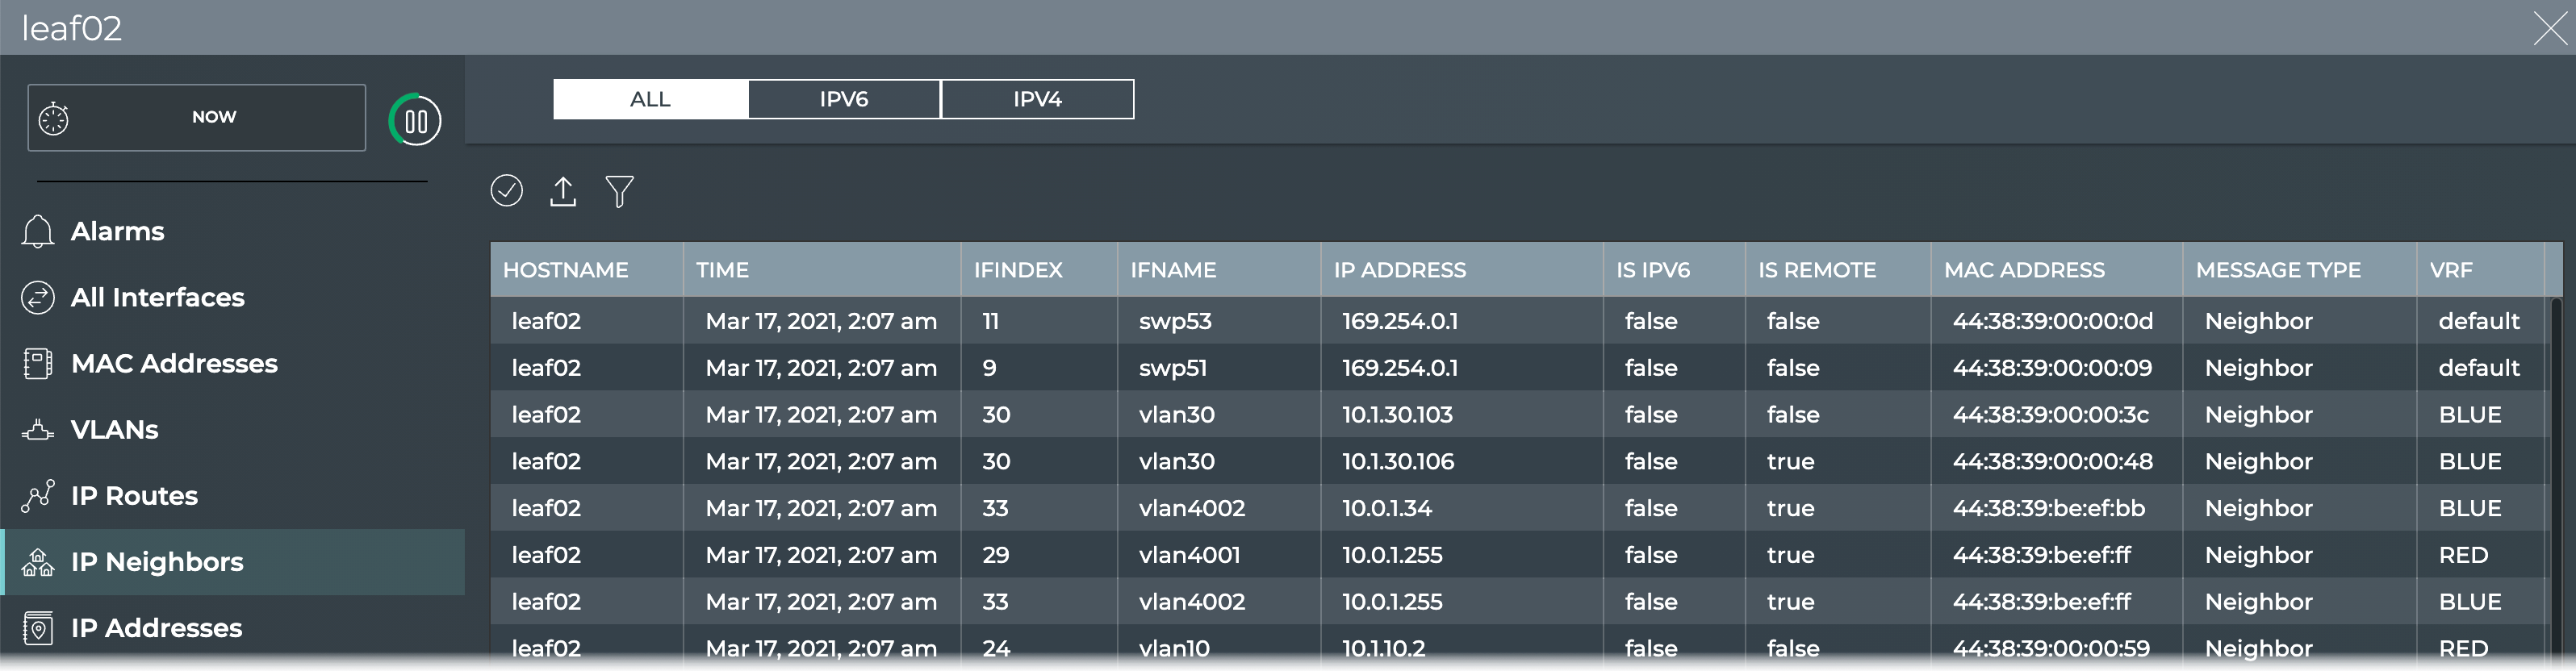
By default all IP routes are listed. Click IPv6 or IPv4 to restrict the list to only those routes.
Optionally, click
to filter by VRF or view a different time period.
To view all IP neighbors on a switch, run:
netq <hostname> show ip neighbors [<remote-interface>] [<ipv4>|<ipv4> vrf <vrf>|vrf <vrf>] [<mac>] [around <text-time>] [count] [json]
Optionally, filter the output with the following options:
ipv4,ipv4 vrf, orvrfto view the neighbor with a given IPv4 address, the neighbor with a given IPv4 address and VRF, or all neighbors using a given VRF on the switchmacto view the neighbor with a given MAC addresscountto view the total number of known IP neighborsaroundto view neighbors at a time in the past
This example shows all IP neighbors for the leaf02 switch:
cumulus@switch:~$ netq leaf02 show ip neighbors
Matching neighbor records:
IP Address                Hostname          Interface                 MAC Address        VRF             Remote Last Changed
------------------------- ----------------- ------------------------- ------------------ --------------- ------ -------------------------
10.1.10.2                 leaf02            vlan10                    44:38:39:00:00:59  RED             no     Thu Sep 17 20:25:14 2020
169.254.0.1               leaf02            swp54                     44:38:39:00:00:0f  default         no     Thu Sep 17 20:25:16 2020
192.168.200.1             leaf02            eth0                      44:38:39:00:00:6d  mgmt            no     Thu Sep 17 20:07:59 2020
169.254.0.1               leaf02            peerlink.4094             44:38:39:00:00:59  default         no     Thu Sep 17 20:25:16 2020
169.254.0.1               leaf02            swp53                     44:38:39:00:00:0d  default         no     Thu Sep 17 20:25:16 2020
10.1.20.2                 leaf02            vlan20                    44:38:39:00:00:59  RED             no     Thu Sep 17 20:25:14 2020
169.254.0.1               leaf02            swp52                     44:38:39:00:00:0b  default         no     Thu Sep 17 20:25:16 2020
10.1.30.2                 leaf02            vlan30                    44:38:39:00:00:59  BLUE            no     Thu Sep 17 20:25:14 2020
169.254.0.1               leaf02            swp51                     44:38:39:00:00:09  default         no     Thu Sep 17 20:25:16 2020
192.168.200.250           leaf02            eth0                      44:38:39:00:01:80  mgmt            no     Thu Sep 17 20:07:59 2020
This example shows the neighbor with a MAC address of 44:38:39:00:00:0b on the leaf02 switch:
cumulus@switch:~$ netq leaf02 show ip neighbors 44:38:39:00:00:0b
Matching neighbor records:
IP Address                Hostname          Interface                 MAC Address        VRF             Remote Last Changed
------------------------- ----------------- ------------------------- ------------------ --------------- ------ -------------------------
169.254.0.1               leaf02            swp52                     44:38:39:00:00:0b  default         no     Thu Sep 17 20:25:16 2020
This example shows the neighbor with an IP address of 10.1.10.2 on the leaf02 switch:
cumulus@switch:~$ netq leaf02 show ip neighbors 10.1.10.2
Matching neighbor records:
IP Address                Hostname          Interface                 MAC Address        VRF             Remote Last Changed
------------------------- ----------------- ------------------------- ------------------ --------------- ------ -------------------------
10.1.10.2                 leaf02            vlan10                    44:38:39:00:00:59  RED             no     Thu Sep 17 20:25:14 2020
View All IP Addresses on a Switch
You can view all IP addresses currently known by a switch using the NetQ UI or the NetQ CLI.
To view all IP addresses on a switch:
- Open the full-screen Switch card and click IP Addresses.
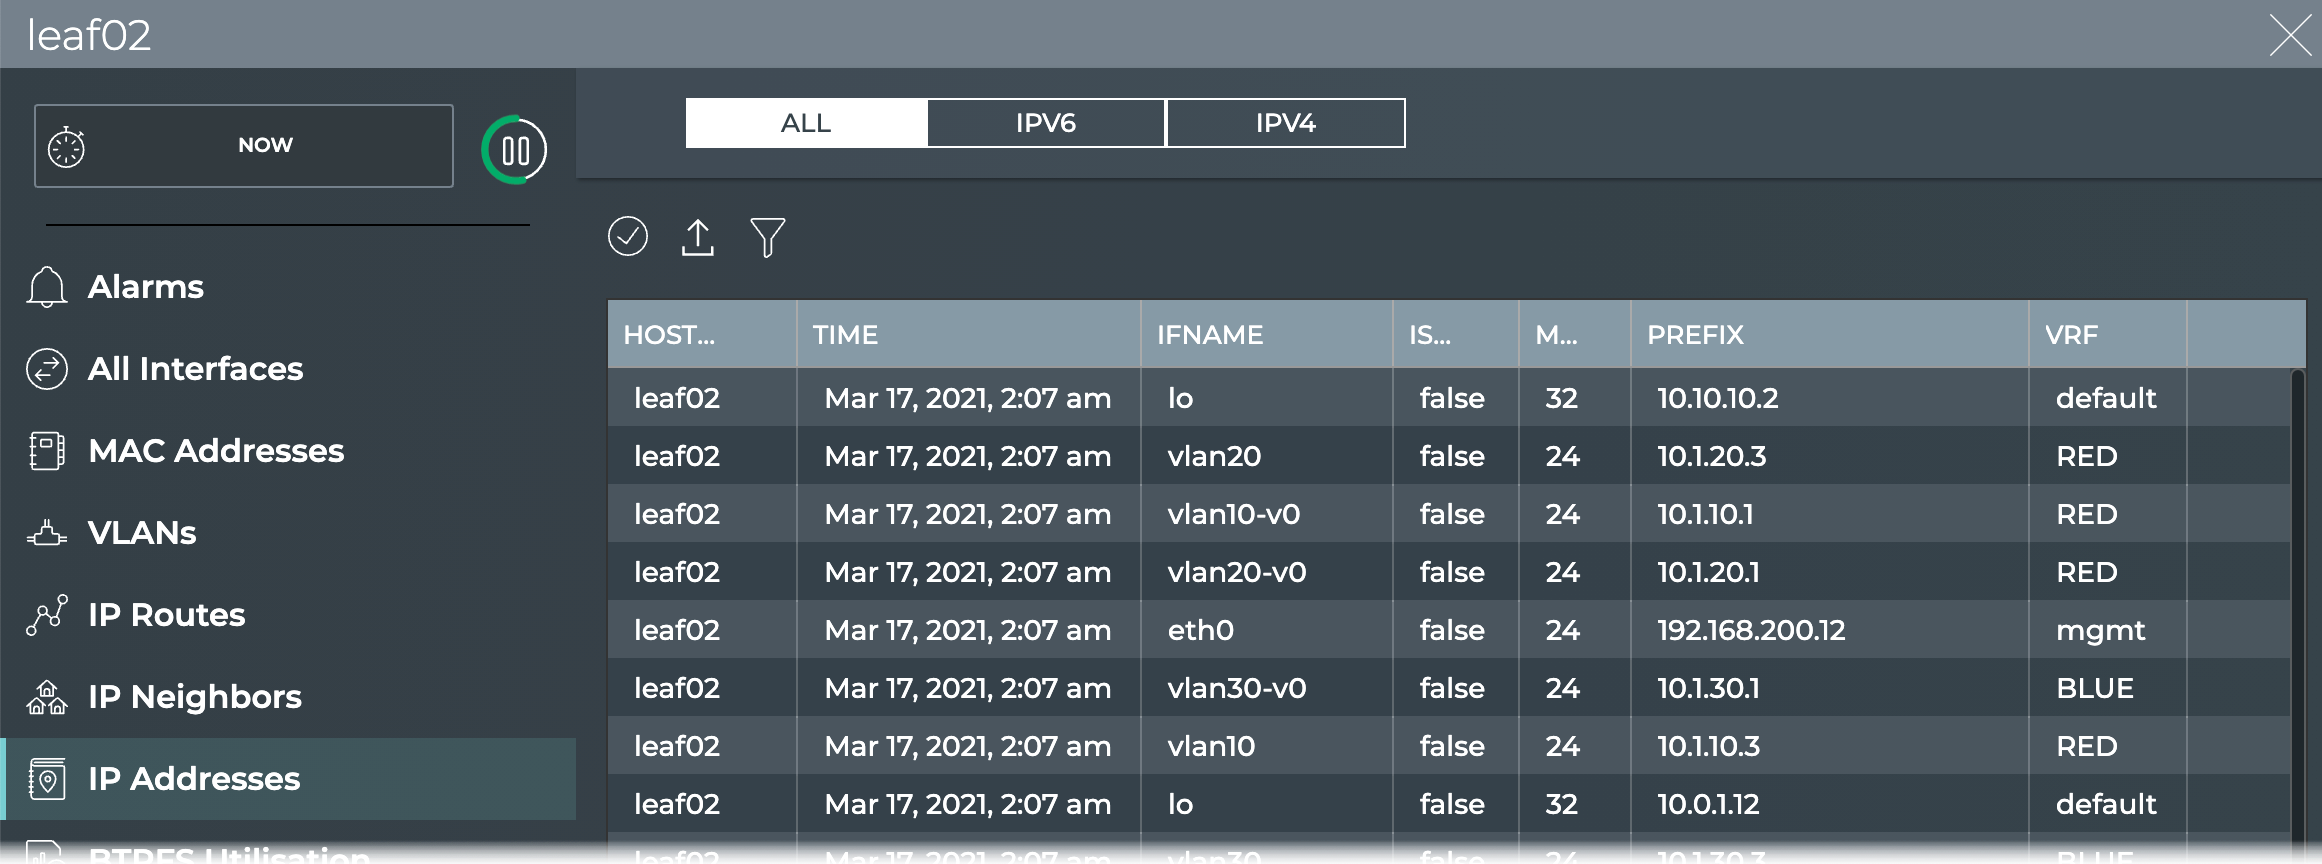
By default all IP addresses are listed. Click IPv6 or IPv4 to restrict the list to only those addresses.
Optionally, click
to filter by interface or VRF, or view a different time period.
To view all IP addresses on a switch, run:
netq <hostname> show ip addresses [<remote-interface>] [<ipv4>|<ipv4/prefixlen>] [vrf <vrf>] [around <text-time>] [count] [json]
Optionally, filter the output with the following options:
ipv4oripv4/prefixlento view a particular IPv4 address on the switchvrfto view addresses using a given VRFcountto view the total number of known IP neighborsaroundto view addresses at a time in the past
This example shows all IP address on the spine01 switch:
cumulus@switch:~$ netq spine01 show ip addresses
Matching address records:
Address                   Hostname          Interface                 VRF             Last Changed
------------------------- ----------------- ------------------------- --------------- -------------------------
192.168.200.21/24         spine01           eth0                      mgmt            Thu Sep 17 20:07:49 2020
10.10.10.101/32           spine01           lo                        default         Thu Sep 17 20:25:05 2020
This example shows all IP addresses on the leaf03 switch:
cumulus@switch:~$ netq leaf03 show ip addresses
Matching address records:
Address                   Hostname          Interface                 VRF             Last Changed
------------------------- ----------------- ------------------------- --------------- -------------------------
10.1.20.2/24              leaf03            vlan20                    RED             Thu Sep 17 20:25:08 2020
10.1.10.1/24              leaf03            vlan10-v0                 RED             Thu Sep 17 20:25:08 2020
192.168.200.13/24         leaf03            eth0                      mgmt            Thu Sep 17 20:08:11 2020
10.1.20.1/24              leaf03            vlan20-v0                 RED             Thu Sep 17 20:25:09 2020
10.0.1.2/32               leaf03            lo                        default         Thu Sep 17 20:28:12 2020
10.1.30.1/24              leaf03            vlan30-v0                 BLUE            Thu Sep 17 20:25:09 2020
10.1.10.2/24              leaf03            vlan10                    RED             Thu Sep 17 20:25:08 2020
10.10.10.3/32             leaf03            lo                        default         Thu Sep 17 20:25:05 2020
10.1.30.2/24              leaf03            vlan30                    BLUE            Thu Sep 17 20:25:08 2020
This example shows all IP addresses using the BLUE VRF on the leaf03 switch:
cumulus@switch:~$ netq leaf03 show ip addresses vrf BLUE
Matching address records:
Address                   Hostname          Interface                 VRF             Last Changed
------------------------- ----------------- ------------------------- --------------- -------------------------
10.1.30.1/24              leaf03            vlan30-v0                 BLUE            Thu Sep 17 20:25:09 2020
10.1.30.2/24              leaf03            vlan30                    BLUE            Thu Sep 17 20:25:08 2020
View All Software Packages
If you are having an issue with a particular switch, you might want to verify all installed software and whether it needs updating.
You can view all the software installed on a given switch using the NetQ UI or NetQ CLI to quickly validate versions and total software installed.
To view all software packages:
- Open the full-screen Switch card and click Installed Packages.
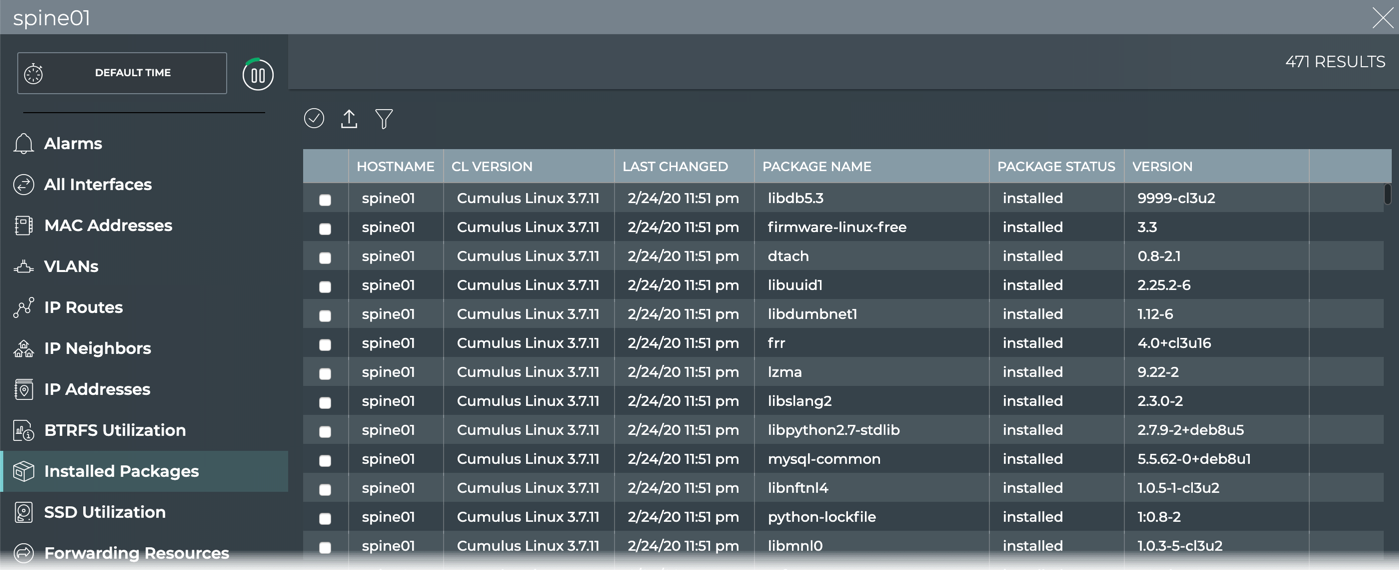
- Look for packages of interest and their version and status. Sort by a particular parameter by clicking .
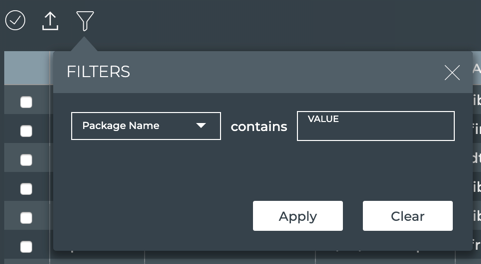
- Optionally, export the list by selecting all or specific packages, then clicking
 .
.
To view package information for a switch, run:
netq <hostname> show cl-pkg-info [<text-package-name>] [around <text-time>] [json]
Use the text-package-name option to narrow the results to a particular package or the around option to narrow the output to a particular time range.
This example shows all installed software packages for spine01.
cumulus@switch:~$ netq spine01 show cl-pkg-info
Matching package_info records:
Hostname          Package Name             Version              CL Version  Package Status       Last Changed
----------------- ------------------------ -------------------- ----------- -------------------- -------------------------
spine01           libxpm4                  1:3.5.12-1           Cumulus Lin installed            Tue May 25 16:01:24 2021
                                                                ux 4.3.0
spine01           libgdbm6                 1.18.1-4             Cumulus Lin installed            Tue May 25 16:01:24 2021
                                                                ux 4.3.0
spine01           multiarch-support        2.28-10              Cumulus Lin installed            Tue May 25 16:01:24 2021
                                                                ux 4.3.0
spine01           diffutils                1:3.7-3              Cumulus Lin installed            Tue May 25 16:01:24 2021
                                                                ux 4.3.0
spine01           adduser                  3.118                Cumulus Lin installed            Tue May 25 16:01:24 2021
                                                                ux 4.3.0
spine01           python-pkg-resources     40.8.0-1             Cumulus Lin installed            Tue May 25 16:01:24 2021
                                                                ux 4.3.0
spine01           libtiff5                 4.1.0+git191117-2~de Cumulus Lin installed            Tue May 25 16:01:24 2021
                                           b10u1                ux 4.3.0
spine01           make                     4.2.1-1.2            Cumulus Lin installed            Tue May 25 16:01:24 2021
                                                                ux 4.3.0
spine01           libpcre3                 2:8.39-12            Cumulus Lin installed            Tue May 25 16:01:24 2021
                                                                ux 4.3.0
spine01           cumulus-hyperconverged   0.1-cl4u3            Cumulus Lin installed            Tue May 25 16:01:24 2021
                                                                ux 4.3.0
spine01           python3-urllib3          1.24.1-1             Cumulus Lin installed            Tue May 25 16:01:24 2021
                                                                ux 4.3.0
spine01           python-markupsafe        1.1.0-1              Cumulus Lin installed            Tue May 25 16:01:24 2021
                                                                ux 4.3.0
spine01           libusb-0.1-4             2:0.1.12-32          Cumulus Lin installed            Tue May 25 16:01:24 2021
                                                                ux 4.3.0
spine01           cron                     3.0pl1-133-cl4u1     Cumulus Lin installed            Tue May 25 16:01:24 2021
                                                                ux 4.3.0
spine01           libsasl2-modules-db      2.1.27+dfsg-1+deb10u Cumulus Lin installed            Tue May 25 16:01:24 2021
                                           1                    ux 4.3.0

...
This example shows the ntp package on the spine01 switch.
cumulus@switch:~$ netq spine01 show cl-pkg-info ntp
Matching package_info records:
Hostname          Package Name             Version              CL Version           Package Status       Last Changed
----------------- ------------------------ -------------------- -------------------- -------------------- -------------------------
spine01           ntp                      1:4.2.8p10-cl3u2     Cumulus Linux 3.7.12 installed            Wed Aug 26 19:58:45 2020
Utilization Statistics
Utilization statistics provide a view into the operation of a switch. They indicate whether resources are becoming dangerously close to their maximum capacity or a user-defined threshold. Depending on the function of the switch, the acceptable thresholds can vary. You can use the NetQ UI or the NetQ CLI to access the utilization statistics.
View Compute Resources Utilization
You can view the current utilization of CPU, memory, and disk resources to determine whether a switch is reaching its maximum load and compare its performance with other switches.
To view the compute resources utilization:
Open the large Switch card.
Hover over the card and click
 .
.
- The card is divided into two sections, displaying hardware-related performance through a series of charts.
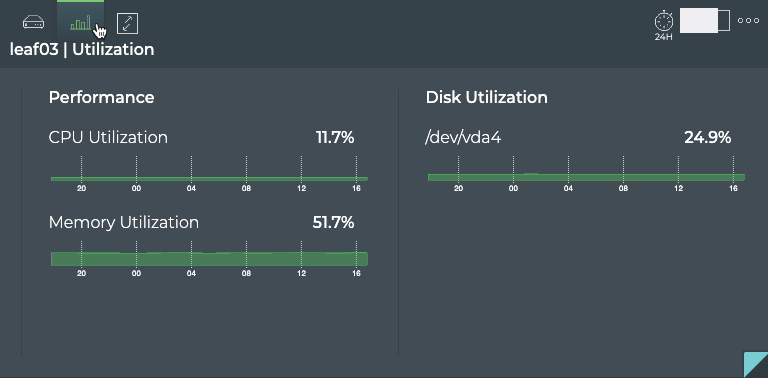
Look at the hardware performance charts.
Are there any that are reaching critical usage levels? Is usage high at a particular time of day?
Change the time period. Is the performance about the same? Better? Worse? The results can guide your decisions about upgrade options.
Open the large Switch card for a comparable switch. Is the performance similar?
You can quickly determine how many compute resources — CPU, disk and memory — the switches on your network consume.
To obtain this information, run the relevant command:
netq <hostname> show resource-util [cpu | memory] [around <text-time>] [json]
netq <hostname> show resource-util disk [<text-diskname>] [around <text-time>] [json]
When no options are included the output shows the percentage of CPU and memory being consumed as well as the amount and percentage of disk space being consumed. You can use the around option to view the information for a particular time.
This example shows the CPU, memory, and disk utilization for the leaf01 switch.
cumulus@switch:~$ netq leaf01 show resource-util
Matching resource_util records:
Hostname          CPU Utilization      Memory Utilization   Disk Name            Total                Used                 Disk Utilization     Last Updated
----------------- -------------------- -------------------- -------------------- -------------------- -------------------- -------------------- ------------------------
leaf01            4.5                  72.1                 /dev/vda4            6170849280           1230303232           20.9                 Wed Sep 16 20:35:57 2020
This example shows only the CPU utilization for the leaf01 switch.
cumulus@switch:~$ netq leaf01 show resource-util cpu
Matching resource_util records:
Hostname          CPU Utilization      Last Updated
----------------- -------------------- ------------------------
leaf01            4.2                  Wed Sep 16 20:52:12 2020
This example shows only the memory utilization for the leaf01 switch.
cumulus@switch:~$ netq leaf01 show resource-util memory
Matching resource_util records:
Hostname          Memory Utilization   Last Updated
----------------- -------------------- ------------------------
leaf01            72.1                 Wed Sep 16 20:52:12 2020
This example shows only the disk utilization for the leaf01 switch. If you have more than one disk in your switch, the output displays utilization data for all disks. If you want to view the data for only one of the disks, you must specify a disk name.
cumulus@switch:~$ netq leaf01 show resource-util disk
Matching resource_util records:
Hostname          Disk Name            Total                Used                 Disk Utilization     Last Updated
----------------- -------------------- -------------------- -------------------- -------------------- ------------------------
leaf01            /dev/vda4            6170849280           1230393344           20.9                 Wed Sep 16 20:54:14 2020
View Interface Statistics and Utilization
NetQ Agents collect performance statistics every 30 seconds for the physical interfaces on switches in your network. The NetQ Agent does not collect statistics for non-physical interfaces, such as bonds, bridges, and VXLANs. The NetQ Agent collects the following statistics:
- Statistics
- Transmit: tx_bytes, tx_carrier, tx_colls, tx_drop, tx_errs, tx_packets
- Receive: rx_bytes, rx_drop, rx_errs, rx_frame, rx_multicast, rx_packets
- Utilization
- rx_util, tx_util
- port speed
You can view these statistics and utilization data using the NetQ UI or the NetQ CLI.
Locate the switch card of interest on your workbench and change to the large size card if needed. Otherwise, open the relevant switch card:
Click
(Switches), and then select Open a switch card.Begin typing the name of the switch of interest, and select when it appears in the suggestions list.
Select the Large card size.
Click Add.
Hover over the card and click
 to open the Interface Stats tab.
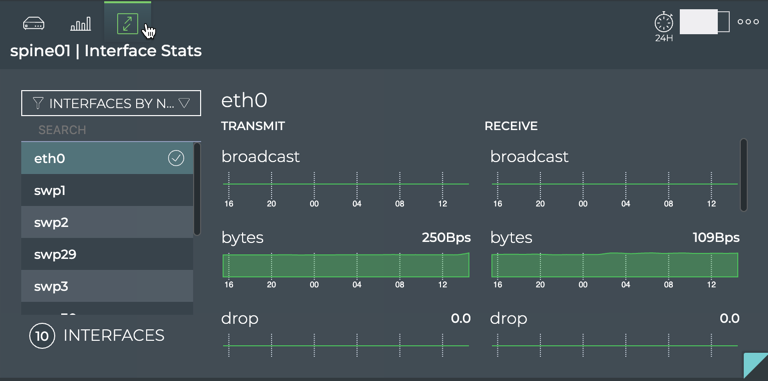
Select an interface from the list, scrolling down until you find it. By default the interfaces are sorted by Name, but you might find it easier to sort by the highest transmit or receive utilization using the filter above the list.
The charts update according to your selection. Scroll up and down to view the individual statistics. Look for high usage, a large number of drops or errors.
What you view next depends on what you see, but a couple of possibilities include:
- Open the full screen card to view details about all of the interfaces on the switch.
- Open another switch card to compare performance on a similar interface.
To view the interface statistics and utilization, run:
netq <hostname> show interface-stats [errors | all] [<physical-port>] [around <text-time>] [json]
netq <hostname> show interface-utilization [<text-port>] [tx|rx] [around <text-time>] [json]
Where the various options are:
hostnamelimits the output to a particular switcherrorslimits the output to only the transmit and receive errors found on the designated interfacesphysical-portlimits the output to a particular portaroundenables viewing of the data at a time in the pastjsonoutputs results in JSON formattext-portlimits output to a particular host and port; this option requires ahostnametx,rxlimits output to the transmit or receive values, respectively
This example shows the interface statistics for the leaf01 switch for all its physical interfaces.
cumulus@switch:~$ netq leaf01 show interface-stats
Matching proc_dev_stats records:
Hostname          Interface                 RX Packets           RX Drop              RX Errors            TX Packets           TX Drop              TX Errors            Last Updated
----------------- ------------------------- -------------------- -------------------- -------------------- -------------------- -------------------- -------------------- ------------------------
leaf01            swp1                      6147779              0                    0                    6504275              0                    0                    Tue Sep 15 19:01:56 2020
leaf01            swp54                     4325143              1                    0                    4366254              0                    0                    Tue Sep 15 19:01:56 2020
leaf01            swp52                     4415219              1                    0                    4321097              0                    0                    Tue Sep 15 19:01:56 2020
leaf01            swp53                     4298355              1                    0                    4707209              0                    0                    Tue Sep 15 19:01:56 2020
leaf01            swp3                      5489369              1                    0                    5753733              0                    0                    Tue Sep 15 19:01:56 2020
leaf01            swp49                     10325417             0                    0                    10251618             0                    0                    Tue Sep 15 19:01:56 2020
leaf01            swp51                     4498784              1                    0                    4360750              0                    0                    Tue Sep 15 19:01:56 2020
leaf01            swp2                      5697369              0                    0                    5942791              0                    0                    Tue Sep 15 19:01:56 2020
leaf01            swp50                     13885780             0                    0                    13944728             0                    0                    Tue Sep 15 19:01:56 2020
This example shows the utilization data for the leaf03 switch.
cumulus@switch:~$ netq leaf03 show interface-utilization
Matching port_stats records:
Hostname          Interface                 RX Bytes (30sec)     RX Drop (30sec)      RX Errors (30sec)    RX Util (%age)       TX Bytes (30sec)     TX Drop (30sec)      TX Errors (30sec)    TX Util (%age)       Port Speed           Last Changed
----------------- ------------------------- -------------------- -------------------- -------------------- -------------------- -------------------- -------------------- -------------------- -------------------- -------------------- --------------------
leaf03            swp1                      3937                 0                    0                    0                    4933                 0                    0                    0                    1G                   Fri Apr 24 09:35:51
                                                                                                                                                                                                                                         2020
leaf03            swp54                     2459                 0                    0                    0                    2459                 0                    0                    0                    1G                   Fri Apr 24 09:35:51
                                                                                                                                                                                                                                         2020
leaf03            swp52                     2459                 0                    0                    0                    2459                 0                    0                    0                    1G                   Fri Apr 24 09:35:51
                                                                                                                                                                                                                                         2020
leaf03            swp53                     2545                 0                    0                    0                    2545                 0                    0                    0                    1G                   Fri Apr 24 09:35:51
                                                                                                                                                                                                                                         2020
leaf03            swp3                      3937                 0                    0                    0                    4962                 0                    0                    0                    1G                   Fri Apr 24 09:35:51
                                                                                                                                                                                                                                         2020
leaf03            swp49                     27858                0                    0                    0                    7732                 0                    0                    0                    1G                   Fri Apr 24 09:35:51
                                                                                                                                                                                                                                         2020
leaf03            swp51                     1599                 0                    0                    0                    2459                 0                    0                    0                    1G                   Fri Apr 24 09:35:51
                                                                                                                                                                                                                                         2020
leaf03            swp2                      3985                 0                    0                    0                    4924                 0                    0                    0                    1G                   Fri Apr 24 09:35:51
                                                                                                                                                                                                                                         2020
leaf03            swp50                     7575                 0                    0                    0                    28221                0                    0                    0                    1G                   Fri Apr 24 09:35:51
This example shows only the transmit utilization data for the border01 switch.
cumulus@switch:~$ netq border01 show interface-utilization tx
Matching port_stats records:
Hostname          Interface                 TX Bytes (30sec)     TX Drop (30sec)      TX Errors (30sec)    TX Util (%age)       Port Speed           Last Changed
----------------- ------------------------- -------------------- -------------------- -------------------- -------------------- -------------------- --------------------
border01          swp1                      0                    0                    0                    0                    Unknown              Fri Apr 24 09:33:20
                                                                                                                                                     2020
border01          swp54                     2461                 0                    0                    0                    1G                   Fri Apr 24 09:33:20
                                                                                                                                                     2020
View ACL Resource Utilization
You can monitor the incoming and outgoing access control lists (ACLs) configured on a switch. This ACL resource information is available from the NetQ UI and NetQ CLI.
Both the Switch card and netq show cl-resource acl command display the ingress/egress IPv4/IPv6 filter/mangle, ingress 802.1x filter, ingress mirror, ingress/egress PBR IPv4/IPv6 filter/mangle, ACL Regions, 18B/32B/54B Rules Key, and layer 4 port range checker.
To view ACL resource utilization on a switch:
Open the Switch card for a switch by searching in the Global Search field.
Hover over the card and change to the full-screen card using the size picker.
Click ACL Resources.
- To return to your workbench, click in the top right corner of the card.
To view ACL resource utilization on a switch, run:
netq <hostname> show cl-resource acl [ingress | egress] [around <text-time>] [json]
Use the egress or ingress options to show only the outgoing or incoming ACLs. Use the around option to show this information for a time in the past.
This example shows the ACL resources available and currently used by the leaf01 switch.
cumulus@switch:~$ netq leaf01 show cl-resource acl
Matching cl_resource records:
Hostname          In IPv4 filter       In IPv4 Mangle       In IPv6 filter       In IPv6 Mangle       In 8021x filter      In Mirror            In PBR IPv4 filter   In PBR IPv6 filter   Eg IPv4 filter       Eg IPv4 Mangle       Eg IPv6 filter       Eg IPv6 Mangle       ACL Regions          18B Rules Key        32B Rules Key        54B Rules Key        L4 Port range Checke Last Updated
                                                                                                                                                                                                                                                                                                                                                                  rs
----------------- -------------------- -------------------- -------------------- -------------------- -------------------- -------------------- -------------------- -------------------- -------------------- -------------------- -------------------- -------------------- -------------------- -------------------- -------------------- -------------------- -------------------- ------------------------
leaf01            36,512(7%)           0,0(0%)              30,768(3%)           0,0(0%)              0,0(0%)              0,0(0%)              0,0(0%)              0,0(0%)              29,256(11%)          0,0(0%)              0,0(0%)              0,0(0%)              0,0(0%)              0,0(0%)              0,0(0%)              0,0(0%)              2,24(8%)             Mon Jan 13 03:34:11 2020
You can also view this same information in JSON format.
cumulus@switch:~$ netq leaf01 show cl-resource acl json
{
    "cl_resource": [
        {
            "egIpv4Filter": "29,256(11%)",
            "egIpv4Mangle": "0,0(0%)",
            "inIpv6Filter": "30,768(3%)",
            "egIpv6Mangle": "0,0(0%)",
            "inIpv4Mangle": "0,0(0%)",
            "hostname": "leaf01",
            "inMirror": "0,0(0%)",
            "egIpv6Filter": "0,0(0%)",
            "lastUpdated": 1578886451.885,
            "54bRulesKey": "0,0(0%)",
            "aclRegions": "0,0(0%)",
            "in8021XFilter": "0,0(0%)",
            "inIpv4Filter": "36,512(7%)",
            "inPbrIpv6Filter": "0,0(0%)",
            "18bRulesKey": "0,0(0%)",
            "l4PortRangeCheckers": "2,24(8%)",
            "inIpv6Mangle": "0,0(0%)",
            "32bRulesKey": "0,0(0%)",
            "inPbrIpv4Filter": "0,0(0%)"
	}
    ],
    "truncatedResult":false
}
View Forwarding Resource Utilization
You can monitor the amount of forwarding resources used by a switch, currently or at a time in the past using the NetQ UI and NetQ CLI.
To view forwarding resources utilization on a switch:
Open the Switch card for a switch by searching in the Global Search field.
Hover over the card and change to the full-screen card using the size picker.
Click Forwarding Resources.
- To return to your workbench, click in the top right corner of the card.
To view forwarding resources utilization on a switch, run:
netq <hostname> show cl-resource forwarding [around <text-time>] [json]
Use the around option to show this information for a time in the past.
This example shows the forwarding resources used by the spine02 switch.
cumulus@switch:~$ netq spine02 show cl-resource forwarding
Matching cl_resource records:
Hostname          IPv4 host entries    IPv6 host entries    IPv4 route entries   IPv6 route entries   ECMP nexthops        MAC entries          Total Mcast Routes   Last Updated
----------------- -------------------- -------------------- -------------------- -------------------- -------------------- -------------------- -------------------- ------------------------
spine02           9,16384(0%)          0,0(0%)              290,131072(0%)       173,20480(0%)        54,16330(0%)         26,32768(0%)         0,8192(0%)           Mon Jan 13 03:34:11 2020
You can also view this same information in JSON format.
cumulus@switch:~$ netq spine02 show cl-resource forwarding  json
{
    "cl_resource": [
        {
            "macEntries": "26,32768(0%)",
            "ecmpNexthops": "54,16330(0%)",
            "ipv4HostEntries": "9,16384(0%)",
            "hostname": "spine02",
            "lastUpdated": 1578886451.884,
            "ipv4RouteEntries": "290,131072(0%)",
            "ipv6HostEntries": "0,0(0%)",
            "ipv6RouteEntries": "173,20480(0%)",
            "totalMcastRoutes": "0,8192(0%)"
	}
    ],
    "truncatedResult":false
}
View SSD Utilization
For NetQ Appliances that have 3ME3 solid state drives (SSDs) installed (primarily in on-premises deployments), you can view the utilization of the drive on-demand. NetQ generates an alarm for drives that drop below 10% health, or have more than a two percent loss of health in 24 hours, indicating the need to rebalance the drive. Tracking SSD utilization over time enables you to see any downward trend or instability of the drive before you receive an alarm.
To view SSD utilization:
- Open the full screen Switch card and click SSD Utilization.
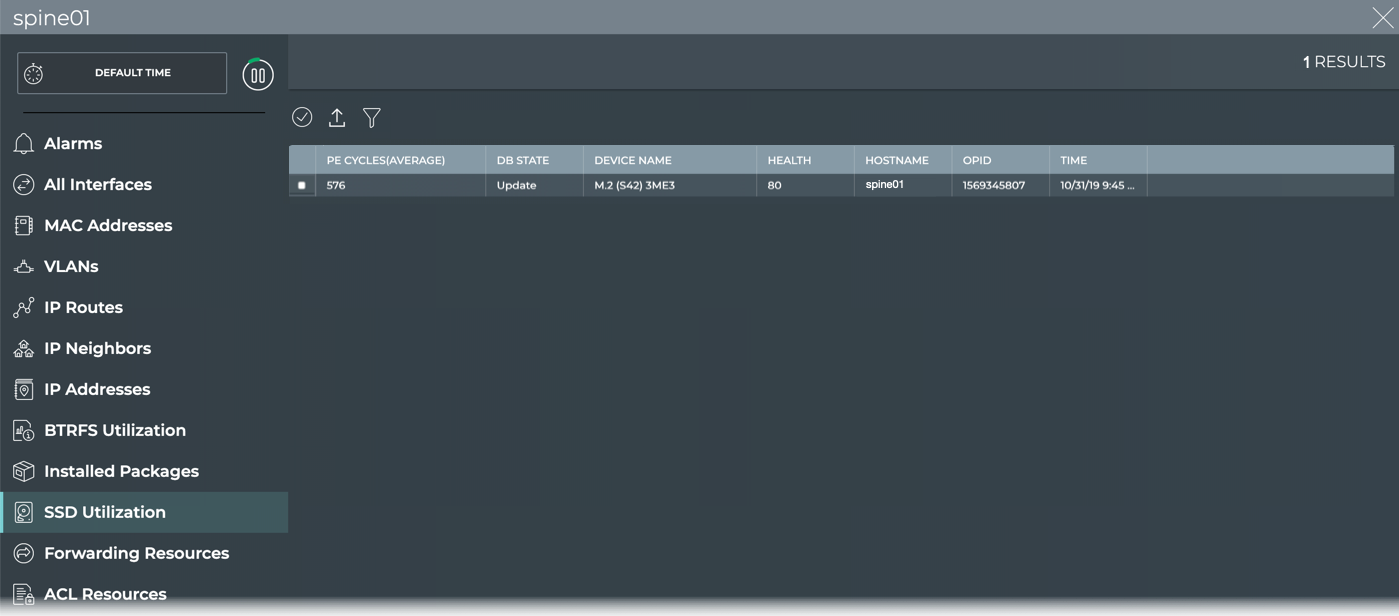
View the average PE Cycles value for a given drive. Is it higher than usual?
View the Health value for a given drive. Is it lower than usual? Less than 10%?
Consider adding the switch cards that are suspect to a workbench for easy tracking.
To view SDD utilization, run:
netq <hostname> show cl-ssd-util [around <text-time>] [json]
This example shows the utilization for spine02 which has this type of SSD.
cumulus@switch:~$ netq spine02 show cl-ssd-util
Hostname        Remaining PE Cycle (%)  Current PE Cycles executed      Total PE Cycles supported       SSD Model               Last Changed
spine02         80                      576                             2880                            M.2 (S42) 3ME3          Thu Oct 31 00:15:06 2019
This output indicates that this drive is in a good state overall with 80% of its PE cycles remaining. Use the around option to view this information around a particular time in the past.
View Disk Storage After BTRFS Allocation
Customers running Cumulus Linux 3.x which uses the BTRFS (b-tree file system) might experience issues with disk space management. This is a known problem of BTRFS because it does not perform periodic garbage collection, or rebalancing. If left unattended, these errors can make it impossible to rebalance the partitions on the disk. To avoid this issue, NVIDIA recommends rebalancing the BTRFS partitions in a preemptive manner, but only when absolutely needed to avoid reduction in the lifetime of the disk. By tracking the state of the disk space usage, users can determine when they should rebalance.
For details about when to perform a recommended rebalance, refer to When to Rebalance BTRFS Partitions.
To view the disk state:
Open the full-screen Switch card for a switch of interest:
- Type the switch name in the Global Search entry field, then use the card size picker to open the full-screen card, or
- Click (Switches), select Open a switch card, enter the switch name and select the full-screen card size.
Click BTRFS Utilization.
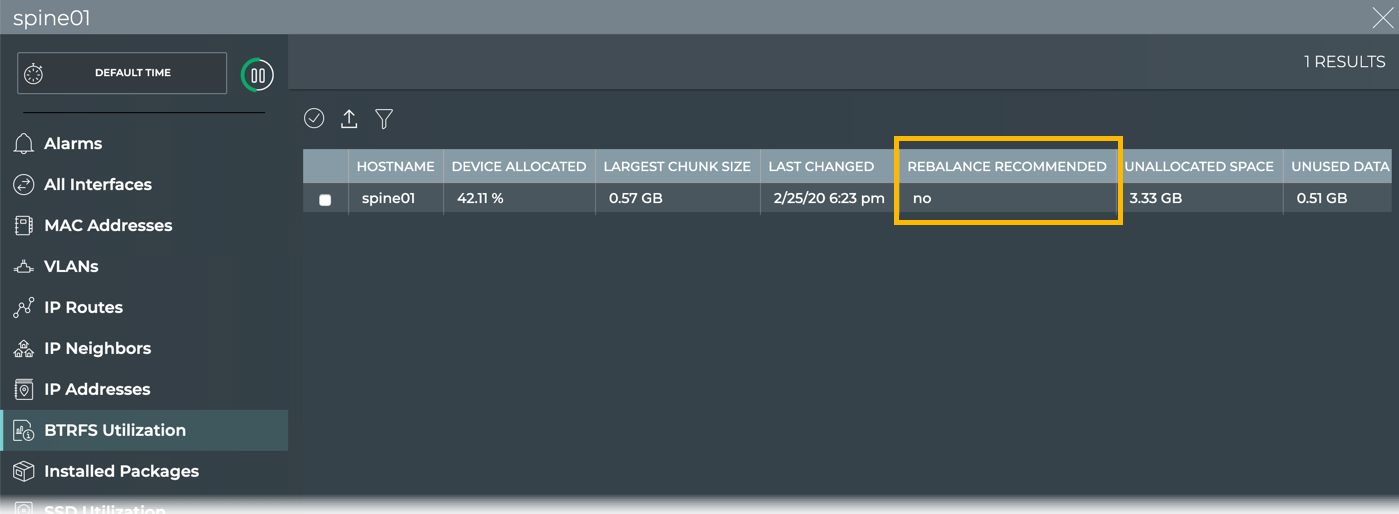
Look for the Rebalance Recommended column.
If the value in that column says Yes, then you are strongly encouraged to rebalance the BTRFS partitions. If it says No, then you can review the other values in the table to determine if you are getting close to needing a rebalance, and come back to view this table at a later time.
To view the disk utilization and whether a rebalance is recommended, run:
netq show cl-btrfs-util [around <text-time>] [json]
This example shows the utilization on the leaf01 switch:
cumulus@switch:~$ netq leaf01 show cl-btrfs-info
Matching btrfs_info records:
Hostname          Device Allocated     Unallocated Space    Largest Chunk Size   Unused Data Chunks S Rebalance Recommende Last Changed
                                                                                 pace                 d
----------------- -------------------- -------------------- -------------------- -------------------- -------------------- -------------------------
leaf01            37.79 %              3.58 GB              588.5 MB             771.91 MB            yes                  Wed Sep 16 21:25:17 2020
Look for the Rebalance Recommended column. If the value in that column says Yes, then you are strongly encouraged to rebalance the BTRFS partitions. If it says No, then you can review the other values in the output to determine if you are getting close to needing a rebalance, and come back to view this data at a later time.
Optionally, use the around option to view the information for a particular time in the past.
Physical Sensing
Physical sensing features provide a view into the health of the switch chassis, including:
- Power supply units (PSUs)
- Fans
- Digital optics modules
- Temperature in various locations
View Chassis Health with Sensors
Fan, power supply unit (PSU), and temperature sensors are available to provide additional data about the switch operation.
Sensor information is available from the NetQ UI and NetQ CLI.
- PSU Sensor card: view sensor name, current/previous state, input/output power, and input/output voltage on all devices (table)
- Fan Sensor card: view sensor name, description, current/maximum/minimum speed, and current/previous state on all devices (table)
- Temperature Sensor card: view sensor name, description, minimum/maximum threshold, current/critical(maximum)/lower critical (minimum) threshold, and current/previous state on all devices (table)
netq show sensors: view sensor name, description, current state, and time when data was last changed on all devices for all or one sensor type
Power Supply Unit Health
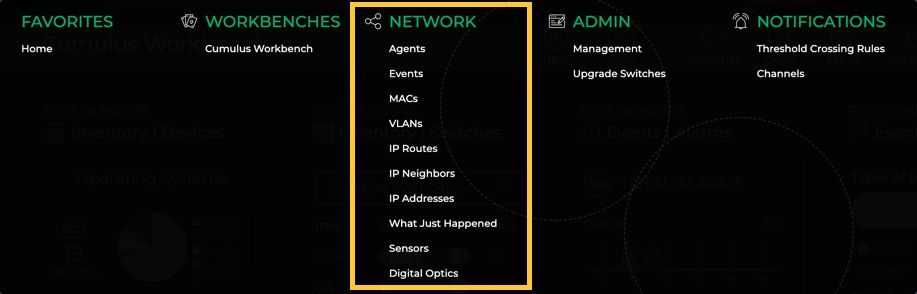
- Click
 (main menu), then click Sensors in the Network heading.
- The PSU tab is displayed by default.
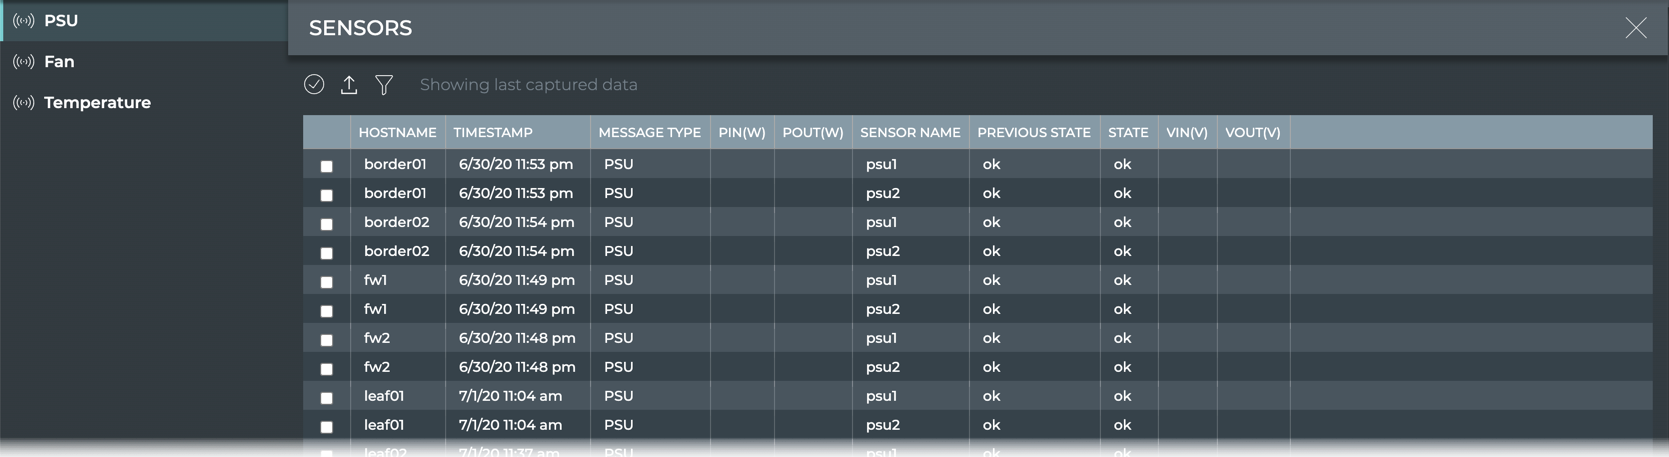
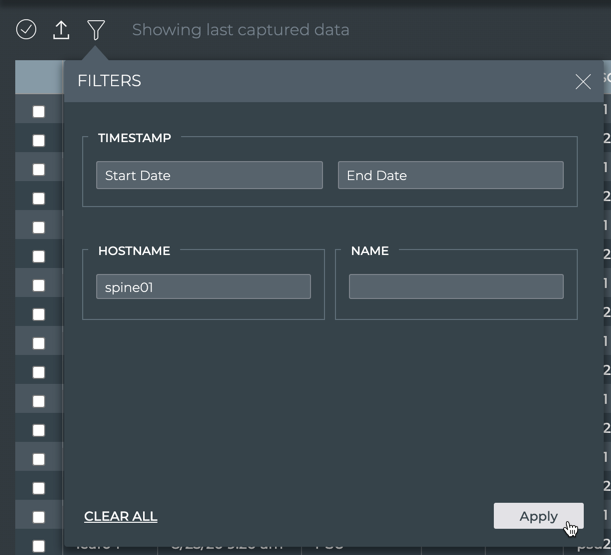
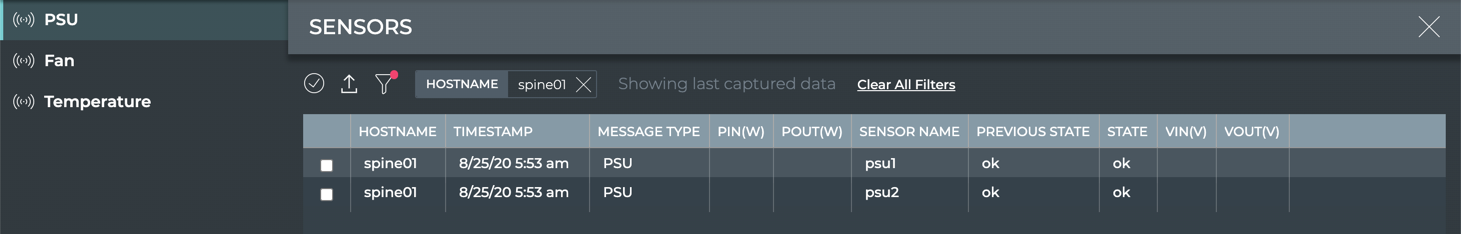
Click
to quickly locate a switch that does not appear on the first page of the switch list.Enter a hostname in the Hostname field.
| PSU Parameter | Description |
|---|---|
| Hostname | Name of the switch or host where the power supply is installed |
| Timestamp | Date and time the data was captured |
| Message Type | Type of sensor message; always PSU in this table |
| PIn(W) | Input power (Watts) for the PSU on the switch or host |
| POut(W) | Output power (Watts) for the PSU on the switch or host |
| Sensor Name | User-defined name for the PSU |
| Previous State | State of the PSU when data was captured in previous window |
| State | State of the PSU when data was last captured |
| VIn(V) | Input voltage (Volts) for the PSU on the switch or host |
| VOut(V) | Output voltage (Volts) for the PSU on the switch or host |
- To return to your workbench, click in the top right corner of the card.
Fan Health
Click
(main menu), then click Sensors in the Network heading.Click Fan.
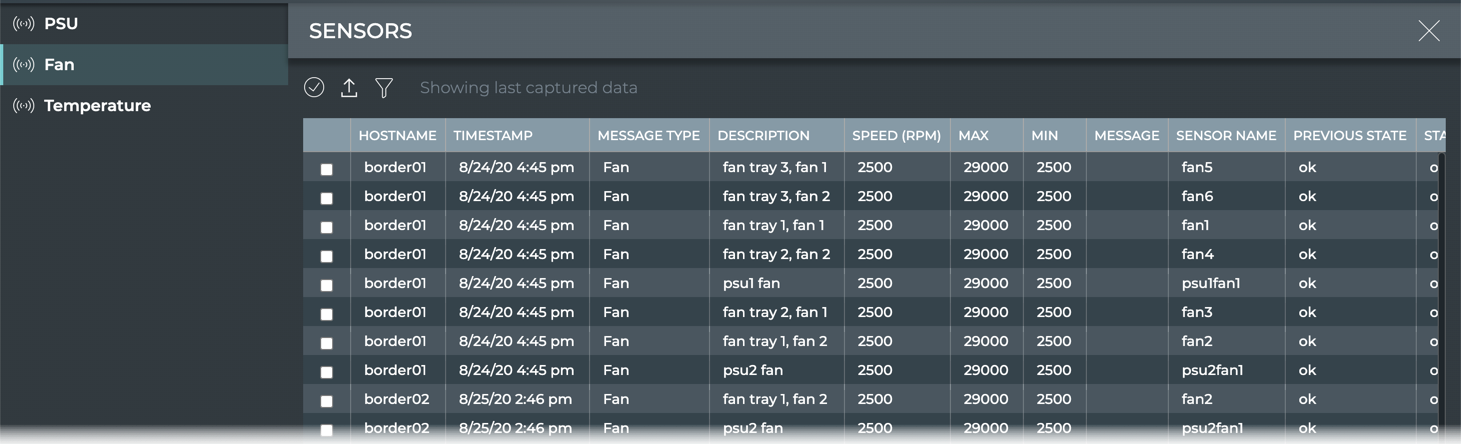
Click
to quickly locate a switch that does not appear on the first page of the switch list.Enter a hostname in the Hostname field.
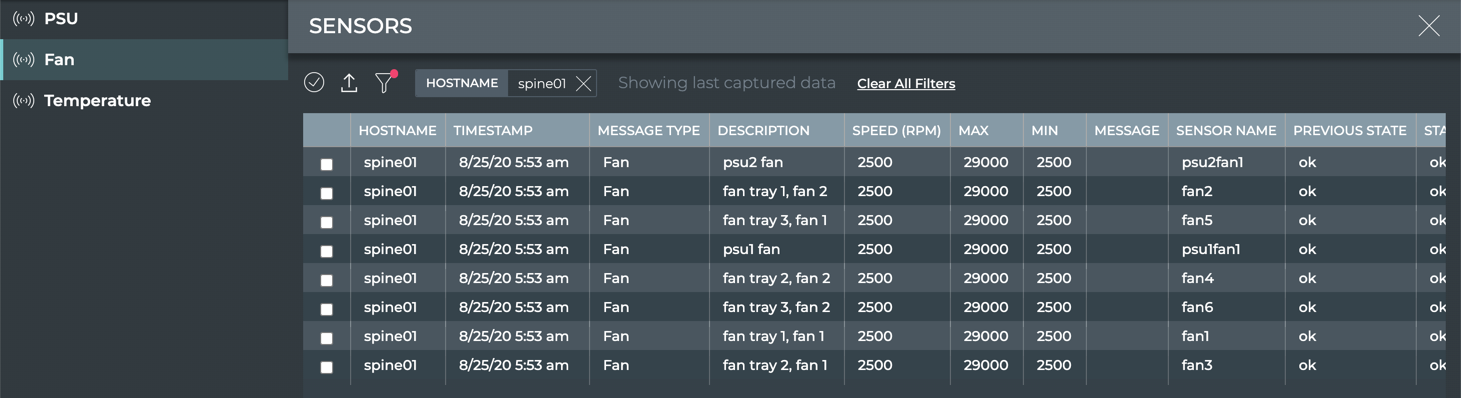
| Fan Parameter | Description |
|---|---|
| Hostname | Name of the switch or host where the fan is installed |
| Timestamp | Date and time the data was captured |
| Message Type | Type of sensor message; always Fan in this table |
| Description | User specified description of the fan |
| Speed (RPM) | Revolution rate of the fan (revolutions per minute) |
| Max | Maximum speed (RPM) |
| Min | Minimum speed (RPM) |
| Message | Message |
| Sensor Name | User-defined name for the fan |
| Previous State | State of the fan when data was captured in previous window |
| State | State of the fan when data was last captured |
- To return to your workbench, click in the top right corner of the card.
Temperature Information
Click
(main menu), then click Sensors in the Network heading.Click Temperature.
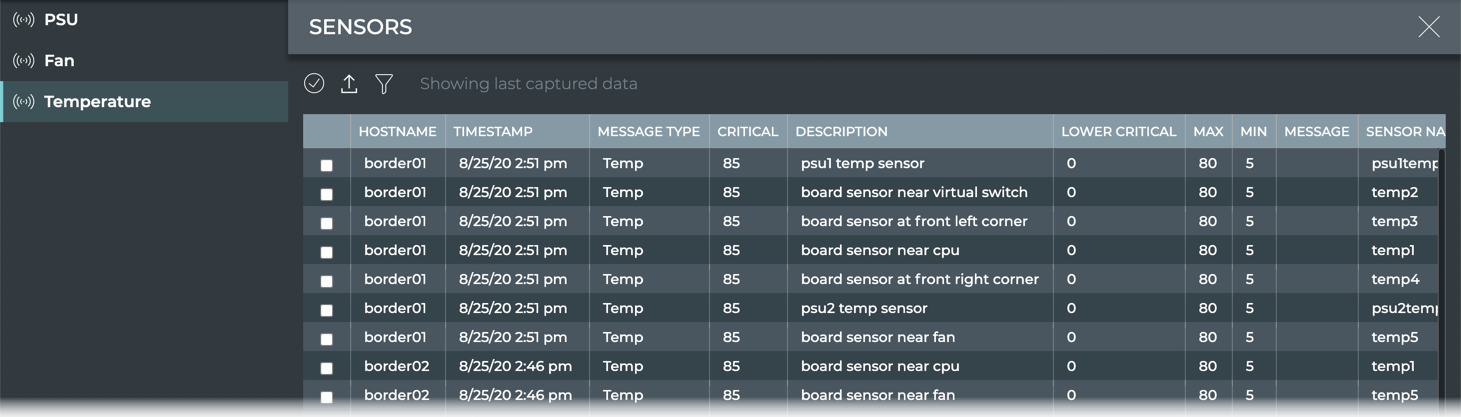
Click
to quickly locate a switch that does not appear on the first page of the switch list.Enter a hostname in the Hostname field.
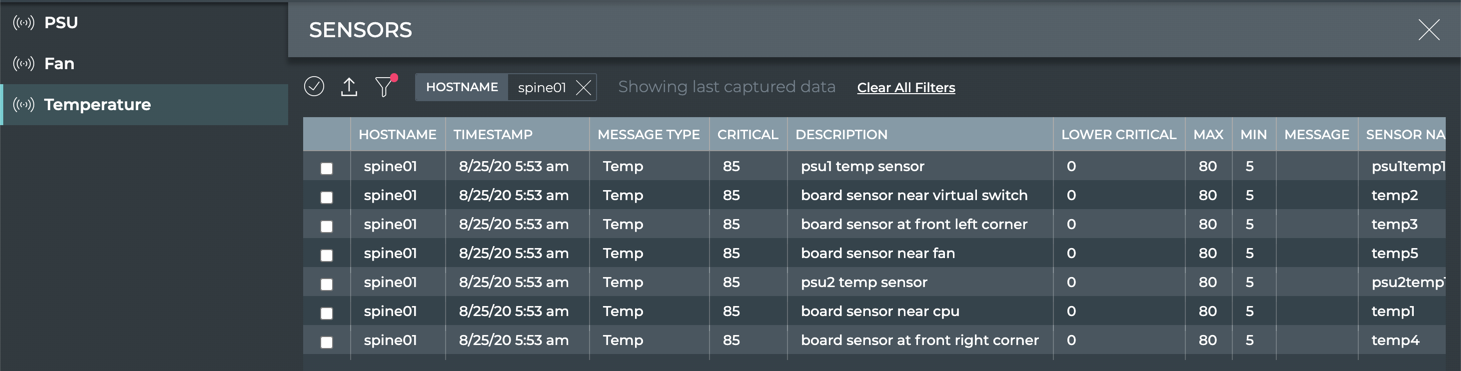
| Temperature Parameter | Description |
|---|---|
| Hostname | Name of the switch or host where the temperature sensor is installed |
| Timestamp | Date and time the data was captured |
| Message Type | Type of sensor message; always Temp in this table |
| Critical | Current critical maximum temperature (°C) threshold setting |
| Description | User specified description of the temperature sensor |
| Lower Critical | Current critical minimum temperature (°C) threshold setting |
| Max | Maximum temperature threshold setting |
| Min | Minimum temperature threshold setting |
| Message | Message |
| Sensor Name | User-defined name for the temperature sensor |
| Previous State | State of the fan when data was captured in previous window |
| State | State of the fan when data was last captured |
| Temperature(Celsius) | Current temperature (°C) measured by sensor |
- To return to your workbench, click in the top right corner of the card.
View All Sensor Information for a Switch
To view information for power supplies, fans, and temperature sensors on a switch, run:
netq <hostname> show sensors all [around <text-time>] [json]
Use the around option to view sensor information for a time in the past.
This example show every sensor on the border01 switch.
cumulus@switch:~$ netq border01 show sensors all
Matching sensors records:
Hostname          Name            Description                         State      Message                             Last Changed
----------------- --------------- ----------------------------------- ---------- ----------------------------------- -------------------------
border01          fan3            fan tray 2, fan 1                   ok                                             Wed Apr 22 17:07:56 2020
border01          fan1            fan tray 1, fan 1                   ok                                             Wed Apr 22 17:07:56 2020
border01          fan6            fan tray 3, fan 2                   ok                                             Wed Apr 22 17:07:56 2020
border01          fan5            fan tray 3, fan 1                   ok                                             Wed Apr 22 17:07:56 2020
border01          psu2fan1        psu2 fan                            ok                                             Wed Apr 22 17:07:56 2020
border01          fan2            fan tray 1, fan 2                   ok                                             Wed Apr 22 17:07:56 2020
border01          fan4            fan tray 2, fan 2                   ok                                             Wed Apr 22 17:07:56 2020
border01          psu1fan1        psu1 fan                            ok                                             Wed Apr 22 17:07:56 2020
View Only Power Supply Health
To view information from all PSU sensors or PSU sensors with a given name on a given switch, run:
netq <hostname> show sensors psu [<psu-name>] [around <text-time>] [json]
Use the psu-name option to view all PSU sensors with a particular name. Use the around option to view sensor information for a time in the past.
Use Tab completion to determine the names of the PSUs in your switches.
cumulus@switch:~$ netq <hostname> show sensors psu <press tab>
around  :  Go back in time to around ...
json    :  Provide output in JSON
psu1    :  Power Supply
psu2    :  Power Supply
<ENTER>
This example shows information from all PSU sensors on the border01 switch.
cumulus@switch:~$ netq border01 show sensor psu

Matching sensors records:
Hostname          Name            State      Pin(W)       Pout(W)        Vin(V)       Vout(V)        Message                             Last Changed
----------------- --------------- ---------- ------------ -------------- ------------ -------------- ----------------------------------- -------------------------
border01          psu1            ok                                                                                                     Tue Aug 25 21:45:21 2020
border01          psu2            ok                                                                                                     Tue Aug 25
This example shows the state of psu2 on the leaf01 switch.
cumulus@switch:~$ netq leaf01 show sensors psu psu2
Matching sensors records:
Hostname          Name            State      Message                             Last Changed
----------------- --------------- ---------- ----------------------------------- -------------------------
leaf01            psu2            ok                                             Sun Apr 21 20:07:12 2019
View Only Fan Health
To view information from all fan sensors or fan sensors with a given name on your switch, run:
netq <hostname> show sensors fan [<fan-name>] [around <text-time>] [json]
Use the fan-name option to view all fan sensors with a particular name. Use the around option to view sensor information for a time in the past.
Use tab completion to determine the names of the fans in your switches:
cumulus@switch:~$ netq show sensors fan <<press tab>>
   around : Go back in time to around ...
   fan1 : Fan Name
   fan2 : Fan Name
   fan3 : Fan Name
   fan4 : Fan Name
   fan5 : Fan Name
   fan6 : Fan Name
   json : Provide output in JSON
   psu1fan1 : Fan Name
   psu2fan1 : Fan Name
   <ENTER>
This example shows information from all fan sensors on the leaf01 switch.
cumulus@switch:~$ netq leaf01 show sensors fan
Matching sensors records:
Hostname          Name            Description                         State      Speed      Max      Min      Message                             Last Changed
----------------- --------------- ----------------------------------- ---------- ---------- -------- -------- ----------------------------------- -------------------------
leaf01            psu2fan1        psu2 fan                            ok         2500       29000    2500                                         Wed Aug 26 16:14:41 2020
leaf01            fan5            fan tray 3, fan 1                   ok         2500       29000    2500                                         Wed Aug 26 16:14:41 2020
leaf01            fan3            fan tray 2, fan 1                   ok         2500       29000    2500                                         Wed Aug 26 16:14:41 2020
leaf01            fan1            fan tray 1, fan 1                   ok         2500       29000    2500                                         Wed Aug 26 16:14:41 2020
leaf01            fan6            fan tray 3, fan 2                   ok         2500       29000    2500                                         Wed Aug 26 16:14:41 2020
leaf01            fan2            fan tray 1, fan 2                   ok         2500       29000    2500                                         Wed Aug 26 16:14:41 2020
leaf01            psu1fan1        psu1 fan                            ok         2500       29000    2500                                         Wed Aug 26 16:14:41 2020
leaf01            fan4            fan tray 2, fan 2                   ok         2500       29000    2500                                         Wed Aug 26 16:14:41 2020
This example shows the state of all fans with the name fan1 on the leaf02 switch.
cumulus@switch:~$ netq leaf02 show sensors fan fan1
Hostname          Name            Description                         State      Speed      Max      Min      Message                             Last Changed
----------------- --------------- ----------------------------------- ---------- ---------- -------- -------- ----------------------------------- -------------------------
leaf02            fan1            fan tray 1, fan 1                   ok         2500       29000    2500                                         Fri Apr 19 16:01:41 2019
View Only Temperature Information
To view information from all temperature sensors or temperature sensors with a given name on a switch, run:
netq <hostname> show sensors temp [<temp-name>] [around <text-time>] [json]
Use the temp-name option to view all PSU sensors with a particular name. Use the around option to view sensor information for a time in the past.
Use tab completion to determine the names of the temperature sensors on your devices:
cumulus@switch:~$ netq show sensors temp <press tab>
    around     :  Go back in time to around ...
    json       :  Provide output in JSON
    psu1temp1  :  Temp Name
    psu2temp1  :  Temp Name
    temp1      :  Temp Name
    temp2      :  Temp Name
    temp3      :  Temp Name
    temp4      :  Temp Name
    temp5      :  Temp Name
    <ENTER>
This example shows the state of all temperature sensors on the leaf01 switch.
cumulus@switch:~$ netq leaf01 show sensors temp

Matching sensors records:
Hostname          Name            Description                         State      Temp     Critical Max      Min      Message                             Last Changed
----------------- --------------- ----------------------------------- ---------- -------- -------- -------- -------- ----------------------------------- -------------------------
leaf01            psu1temp1       psu1 temp sensor                    ok         25       85       80       5                                            Wed Aug 26 16:14:41 2020
leaf01            temp5           board sensor near fan               ok         25       85       80       5                                            Wed Aug 26 16:14:41 2020
leaf01            temp4           board sensor at front right corner  ok         25       85       80       5                                            Wed Aug 26 16:14:41 2020
leaf01            temp1           board sensor near cpu               ok         25       85       80       5                                            Wed Aug 26 16:14:41 2020
leaf01            temp2           board sensor near virtual switch    ok         25       85       80       5                                            Wed Aug 26 16:14:41 2020
leaf01            temp3           board sensor at front left corner   ok         25       85       80       5                                            Wed Aug 26 16:14:41 2020
leaf01            psu2temp1       psu2 temp sensor                    ok         25       85       80       5                                            Wed Aug 26 16:14:41 2020
This example shows the state of the psu1temp1 temperature sensor on the leaf01 switch. the name .
cumulus@switch:~$ netq leaf01 show sensors temp psu2temp1
Matching sensors records:
Hostname          Name            Description                         State      Temp     Critical Max      Min      Message                             Last Changed
----------------- --------------- ----------------------------------- ---------- -------- -------- -------- -------- ----------------------------------- -------------------------
leaf01            psu2temp1       psu2 temp sensor                    ok         25       85       80       5                                            Wed Aug 26 16:14:41 2020
View Digital Optics Health
Digital optics module information is available regarding the performance degradation or complete outage of any digital optics modules on a switch using the NetQ UI and NetQ CLI.
- Switch card:
- Large: view trends of laser bias current, laser output power, received signal average optical power, and module temperature/voltage for given interface (graphics)
- Full screen: view laser bias current, laser output power, received signal average optical power, and module temperature/voltage (table)
- Digital Optics card: view laser bias current, laser output power, received signal average optical power, and module temperature/voltage (table)
netq show dom typecommand: view laser bias current, laser output power, received signal average optical power, and module temperature/voltage
Open a switch card by searching for a switch by hostname in Global Search.
Hover over the card and change to the large card using the card size picker.
Hover over card and click
 .
.Select the interface of interest.
Click the interface name if visible in the list on the left, scroll down the list to find it, or search for interface.
Choose the digital optical monitoring (DOM) parameter of interest from the dropdown. The card updates according to your selections.
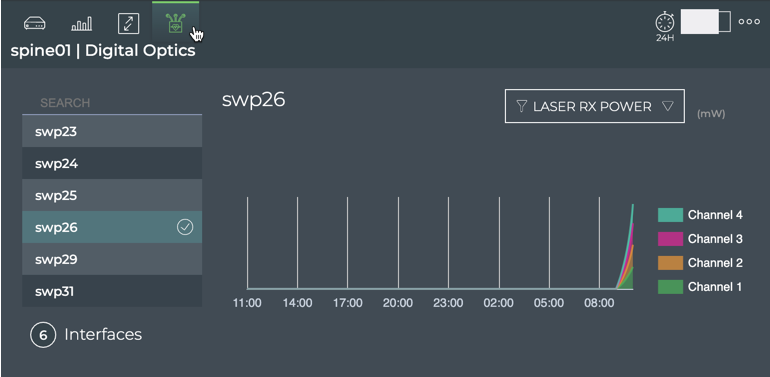
Choose alternate interfaces and DOM parameters to view other charts.
Hover over the card and change to the full-screen card using the card size picker.
Click Digital Optics.
Click the DOM parameter at the top.
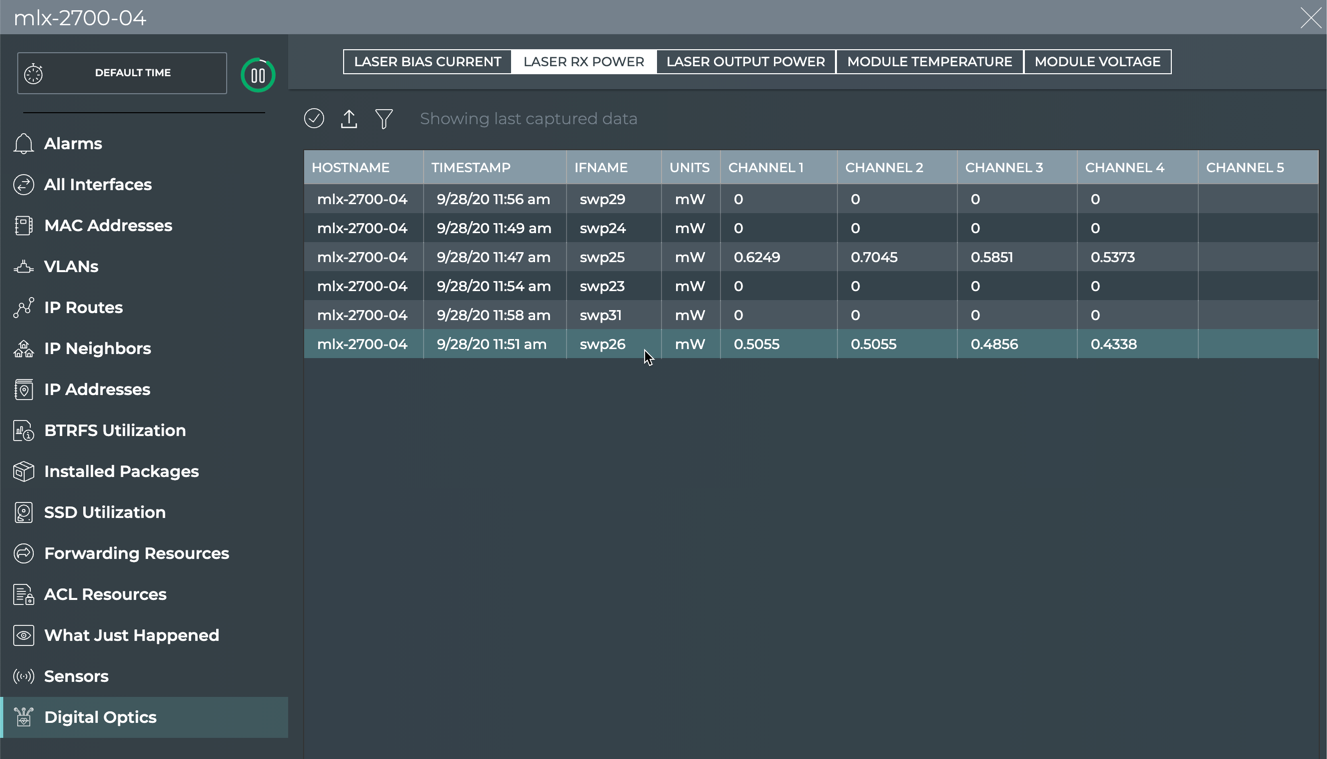
- Review the laser parameter values by interface and channel. Review the module parameters by interface.
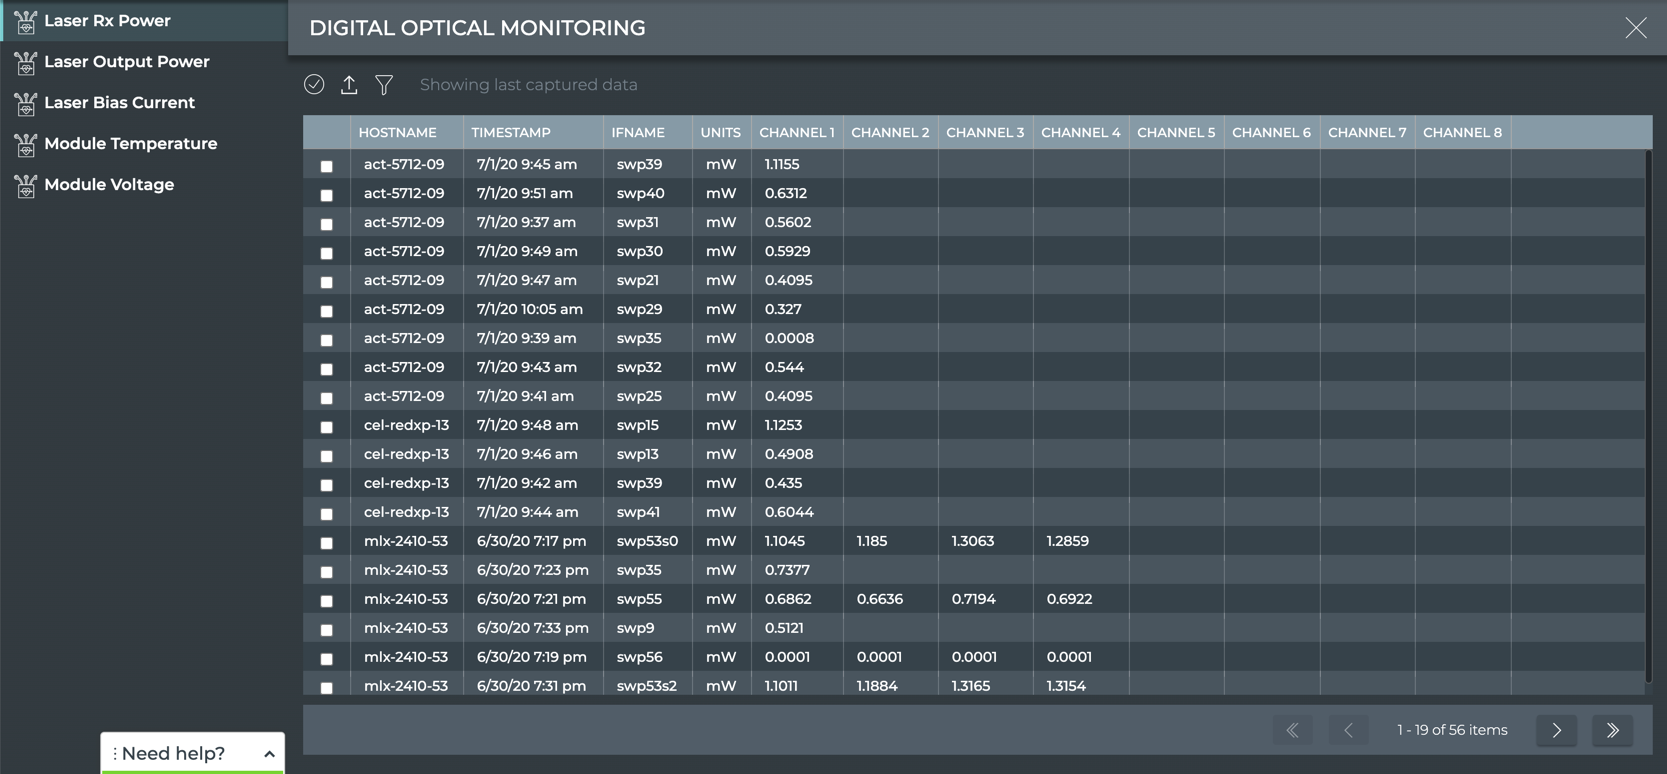
- Click (main menu), then click Digital Optics in the Network heading.
- The Laser Rx Power tab is displayed by default.
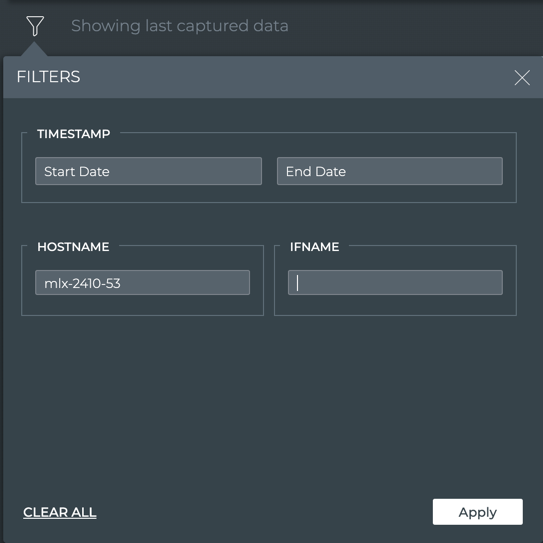
Click
to quickly locate a switch that does not appear on the first page of the switch list.Enter the hostname of the switch you want to view, and optionally an interface, then click Apply.
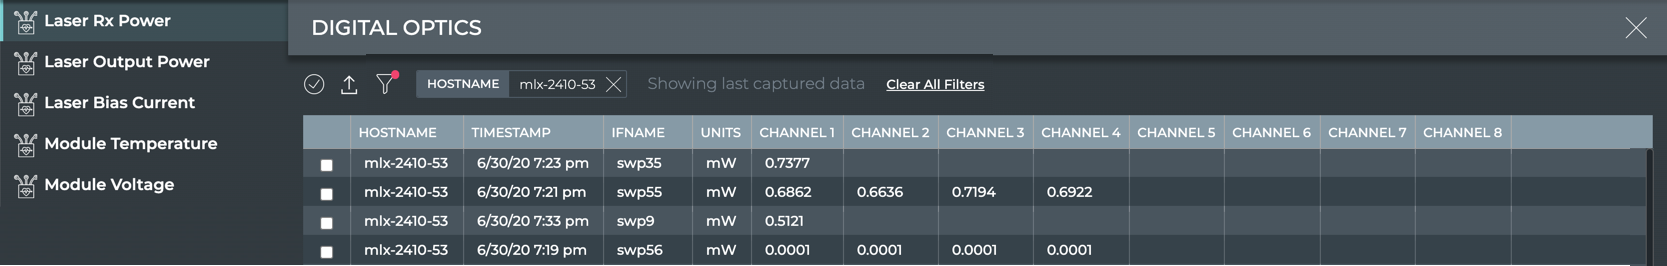
- Click another tab to view other optical parameters for a switch. Filter for the switch on each tab.
| Laser Parameter | Description |
|---|---|
| Hostname | Name of the switch or host where the digital optics module resides |
| Timestamp | Date and time the data was captured |
| If Name | Name of interface where the digital optics module is installed |
| Units | Measurement unit for the power (mW) or current (mA) |
| Channel 1–8 | Value of the power or current on each channel where the digital optics module is transmitting |
| Module Parameter | Description |
|---|---|
| Hostname | Name of the switch or host where the digital optics module resides |
| Timestamp | Date and time the data was captured |
| If Name | Name of interface where the digital optics module is installed |
| Degree C | Current module temperature, measured in degrees Celsius |
| Degree F | Current module temperature, measured in degrees Fahrenheit |
| Units | Measurement unit for module voltage; Volts |
| Value | Current module voltage |
- To return to your workbench, click in the top right corner of the card.
To view digital optics information for a switch, run one of the following:
netq <hostname> show dom type (laser_rx_power|laser_output_power|laser_bias_current) [interface <text-dom-port-anchor>] [channel_id <text-channel-id>] [around <text-time>] [json]
netq <hostname> show dom type (module_temperature|module_voltage) [interface <text-dom-port-anchor>] [around <text-time>] [json]
This example shows module temperature information for the spine01 switch.
cumulus@switch:~$ netq spine01 show dom type module_temp
Matching dom records:
Hostname          Interface  type                 high_alarm_threshold low_alarm_threshold  high_warning_thresho low_warning_threshol value                Last Updated
                                                                                            ld                   d
----------------- ---------- -------------------- -------------------- -------------------- -------------------- -------------------- -------------------- ------------------------
spine01           swp53s0    module_temperature   {‘degree_c’: 85,     {‘degree_c’: -10,    {‘degree_c’: 70,     {‘degree_c’: 0,      {‘degree_c’: 32,     Wed Jul  1 15:25:56 2020
                                                  ‘degree_f’: 185}     ‘degree_f’: 14}      ‘degree_f’: 158}     ‘degree_f’: 32}      ‘degree_f’: 89.6}
spine01           swp35      module_temperature   {‘degree_c’: 75,     {‘degree_c’: -5,     {‘degree_c’: 70,     {‘degree_c’: 0,      {‘degree_c’: 27.82,  Wed Jul  1 15:25:56 2020
                                                  ‘degree_f’: 167}     ‘degree_f’: 23}      ‘degree_f’: 158}     ‘degree_f’: 32}      ‘degree_f’: 82.08}
spine01           swp55      module_temperature   {‘degree_c’: 75,     {‘degree_c’: -5,     {‘degree_c’: 70,     {‘degree_c’: 0,      {‘degree_c’: 26.29,  Wed Jul  1 15:25:56 2020
                                                  ‘degree_f’: 167}     ‘degree_f’: 23}      ‘degree_f’: 158}     ‘degree_f’: 32}      ‘degree_f’: 79.32}
spine01           swp9       module_temperature   {‘degree_c’: 78,     {‘degree_c’: -13,    {‘degree_c’: 73,     {‘degree_c’: -8,     {‘degree_c’: 25.57,  Wed Jul  1 15:25:56 2020
                                                  ‘degree_f’: 172.4}   ‘degree_f’: 8.6}     ‘degree_f’: 163.4}   ‘degree_f’: 17.6}    ‘degree_f’: 78.02}
spine01           swp56      module_temperature   {‘degree_c’: 78,     {‘degree_c’: -10,    {‘degree_c’: 75,     {‘degree_c’: -5,     {‘degree_c’: 29.43,  Wed Jul  1 15:25:56 2020
                                                  ‘degree_f’: 172.4}   ‘degree_f’: 14}      ‘degree_f’: 167}     ‘degree_f’: 23}      ‘degree_f’: 84.97}
spine01           swp53s2    module_temperature   {‘degree_c’: 85,     {‘degree_c’: -10,    {‘degree_c’: 70,     {‘degree_c’: 0,      {‘degree_c’: 32,     Wed Jul  1 15:25:55 2020
                                                  ‘degree_f’: 185}     ‘degree_f’: 14}      ‘degree_f’: 158}     ‘degree_f’: 32}      ‘degree_f’: 89.6}
spine01           swp6       module_temperature   {‘degree_c’: 80,     {‘degree_c’: -10,    {‘degree_c’: 75,     {‘degree_c’: -5,     {‘degree_c’: 25.04,  Wed Jul  1 15:25:55 2020
                                                  ‘degree_f’: 176}     ‘degree_f’: 14}      ‘degree_f’: 167}     ‘degree_f’: 23}      ‘degree_f’: 77.07}
spine01           swp7       module_temperature   {‘degree_c’: 85,     {‘degree_c’: -5,     {‘degree_c’: 80,     {‘degree_c’: 0,      {‘degree_c’: 24.14,  Wed Jul  1 15:25:56 2020
                                                  ‘degree_f’: 185}     ‘degree_f’: 23}      ‘degree_f’: 176}     ‘degree_f’: 32}      ‘degree_f’: 75.45}
spine01           swp53s3    module_temperature   {‘degree_c’: 85,     {‘degree_c’: -10,    {‘degree_c’: 70,     {‘degree_c’: 0,      {‘degree_c’: 32,     Wed Jul  1 15:25:56 2020
                                                  ‘degree_f’: 185}     ‘degree_f’: 14}      ‘degree_f’: 158}     ‘degree_f’: 32}      ‘degree_f’: 89.6}
spine01           swp11      module_temperature   {‘degree_c’: 95,     {‘degree_c’: -50,    {‘degree_c’: 93,     {‘degree_c’: -48,    {‘degree_c’: 23.75,  Wed Jul  1 15:25:56 2020
                                                  ‘degree_f’: 203}     ‘degree_f’: -58}     ‘degree_f’: 199.4}   ‘degree_f’: -54.4}   ‘degree_f’: 74.75}
spine01           swp49      module_temperature   {‘degree_c’: 65,     {‘degree_c’: 10,     {‘degree_c’: 60,     {‘degree_c’: 15,     {‘degree_c’: 23.18,  Wed Jul  1 15:25:56 2020
                                                  ‘degree_f’: 149}     ‘degree_f’: 50}      ‘degree_f’: 140}     ‘degree_f’: 59}      ‘degree_f’: 73.72}
spine01           swp12      module_temperature   {‘degree_c’: 75,     {‘degree_c’: -5,     {‘degree_c’: 70,     {‘degree_c’: 0,      {‘degree_c’: 32.31,  Wed Jul  1 15:25:56 2020
                                                  ‘degree_f’: 167}     ‘degree_f’: 23}      ‘degree_f’: 158}     ‘degree_f’: 32}      ‘degree_f’: 90.16}
spine01           swp53s1    module_temperature   {‘degree_c’: 85,     {‘degree_c’: -10,    {‘degree_c’: 70,     {‘degree_c’: 0,      {‘degree_c’: 32,     Wed Jul  1 15:25:56 2020
                                                  ‘degree_f’: 185}     ‘degree_f’: 14}      ‘degree_f’: 158}     ‘degree_f’: 32}      ‘degree_f’: 89.6}
spine01           swp34      module_temperature   {‘degree_c’: 80,     {‘degree_c’: -10,    {‘degree_c’: 70,     {‘degree_c’: 0,      {‘degree_c’: 24.93,  Wed Jul  1 15:25:55 2020
                                                  ‘degree_f’: 176}     ‘degree_f’: 14}      ‘degree_f’: 158}     ‘degree_f’: 32}      ‘degree_f’: 76.87}
spine01           swp3       module_temperature   {‘degree_c’: 90,     {‘degree_c’: -40,    {‘degree_c’: 85,     {‘degree_c’: -40,    {‘degree_c’: 25.15,  Wed Jul  1 15:25:55 2020
                                                  ‘degree_f’: 194}     ‘degree_f’: -40}     ‘degree_f’: 185}     ‘degree_f’: -40}     ‘degree_f’: 77.27}
spine01           swp8       module_temperature   {‘degree_c’: 78,     {‘degree_c’: -13,    {‘degree_c’: 73,     {‘degree_c’: -8,     {‘degree_c’: 24.1,   Wed Jul  1 15:25:55 2020
                                                  ‘degree_f’: 172.4}   ‘degree_f’: 8.6}     ‘degree_f’: 163.4}   ‘degree_f’: 17.6}    ‘degree_f’: 75.38}
spine01           swp52      module_temperature   {‘degree_c’: 75,     {‘degree_c’: -5,     {‘degree_c’: 70,     {‘degree_c’: 0,      {‘degree_c’: 20.55,  Wed Jul  1 15:25:56 2020
                                                  ‘degree_f’: 167}     ‘degree_f’: 23}      ‘degree_f’: 158}     ‘degree_f’: 32}      ‘degree_f’: 68.98}
spine01           swp10      module_temperature   {‘degree_c’: 78,     {‘degree_c’: -13,    {‘degree_c’: 73,     {‘degree_c’: -8,     {‘degree_c’: 25.39,  Wed Jul  1 15:25:55 2020
                                                  ‘degree_f’: 172.4}   ‘degree_f’: 8.6}     ‘degree_f’: 163.4}   ‘degree_f’: 17.6}    ‘degree_f’: 77.7}
spine01           swp31      module_temperature   {‘degree_c’: 75,     {‘degree_c’: -5,     {‘degree_c’: 70,     {‘degree_c’: 0,      {‘degree_c’: 27.05,  Wed Jul  1 15:25:56 2020
                                                  ‘degree_f’: 167}     ‘degree_f’: 23}      ‘degree_f’: 158}     ‘degree_f’: 32}      ‘degree_f’: 80.69}