Monitor the OSPF Service
OSPF maintains the view of the network topology conceptually as a directed graph. Each router represents a vertex in the graph. Each link between neighboring routers represents a unidirectional edge and has an associated weight (called cost) that is either automatically derived from its bandwidth or administratively assigned. Using the weighted topology graph, each router computes a shortest path tree (SPT) with itself as the root, and applies the results to build its forwarding table. For more information about OSPF operation and how to configure OSPF to run in your data center network, refer to Open Shortest Path First - OSPF or Open Shortest Path First v3 - OSPFv3.
If you have OSPF running on your switches and hosts, NetQ enables you to view the health of the OSPF service on a networkwide and a per session basis, giving greater insight into all aspects of the service. For each device, you can view its associated interfaces, areas, peers, state, and type of OSPF running (numbered or unnumbered). Additionally, you can view the information at an earlier point in time and filter against a particular device, interface, or area.
You accomplish this in the NetQ UI through two card workflows, one for the service and one for the session, and in the NetQ CLI with the netq show ospf command.
Monitor the OSPF Service Networkwide
With NetQ, you can monitor OSPF performance across the network:
- Network Services|All OSPF Sessions
- Small: view number of nodes running OSPF service and number and distribution of alarms
- Medium: view number and distribution of nodes running OSPF service, total sessions, unestablished sessions, and alarms
- Large: view number and distribution of nodes running OSPF service, total sessions, unestablished sessions, and alarms, switches with the most established sessions/alarms
- Full-screen: view and filter configuration and status for all switches, all sessions, and all alarms
netq show ospfcommand: view configuration and status for all devices, including interface, area, type, state, peer hostname and interface, and last time each device changed
When entering a time value, you must include a numeric value and the unit of measure:
- w: weeks
- d: days
- h: hours
- m: minutes
- s: seconds
- now
For the between option, you can enter the start (text-time) and end time (text-endtime) values as most recent first and least recent second, or vice versa. The values do not have to have the same unit of measure.
View Service Status Summary
You can view a summary of the OSPF service from the NetQ UI or the NetQ CLI.
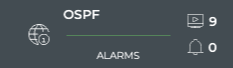
To view the summary, open the Network Services|All OSPF Sessions card. In this example, the number of devices running the OSPF service is nine (9) and the number and distribution of related critical severity alarms is zero (0).
To view OSPF service status, run:
netq show ospf
This example shows all devices included in OSPF unnumbered routing, the assigned areas, state, peer and interface, and the last time this information changed.
cumulus@switch:~$ netq show ospf
Matching ospf records:
Hostname          Interface                 Area         Type             State      Peer Hostname     Peer Interface            Last Changed
----------------- ------------------------- ------------ ---------------- ---------- ----------------- ------------------------- -------------------------
leaf01            swp51                     0.0.0.0      Unnumbered       Full       spine01           swp1                      Thu Feb  7 14:42:16 2019
leaf01            swp52                     0.0.0.0      Unnumbered       Full       spine02           swp1                      Thu Feb  7 14:42:16 2019
leaf02            swp51                     0.0.0.0      Unnumbered       Full       spine01           swp2                      Thu Feb  7 14:42:16 2019
leaf02            swp52                     0.0.0.0      Unnumbered       Full       spine02           swp2                      Thu Feb  7 14:42:16 2019
leaf03            swp51                     0.0.0.0      Unnumbered       Full       spine01           swp3                      Thu Feb  7 14:42:16 2019
leaf03            swp52                     0.0.0.0      Unnumbered       Full       spine02           swp3                      Thu Feb  7 14:42:16 2019
leaf04            swp51                     0.0.0.0      Unnumbered       Full       spine01           swp4                      Thu Feb  7 14:42:16 2019
leaf04            swp52                     0.0.0.0      Unnumbered       Full       spine02           swp4                      Thu Feb  7 14:42:16 2019
spine01           swp1                      0.0.0.0      Unnumbered       Full       leaf01            swp51                     Thu Feb  7 14:42:16 2019
spine01           swp2                      0.0.0.0      Unnumbered       Full       leaf02            swp51                     Thu Feb  7 14:42:16 2019
spine01           swp3                      0.0.0.0      Unnumbered       Full       leaf03            swp51                     Thu Feb  7 14:42:16 2019
spine01           swp4                      0.0.0.0      Unnumbered       Full       leaf04            swp51                     Thu Feb  7 14:42:16 2019
spine02           swp1                      0.0.0.0      Unnumbered       Full       leaf01            swp52                     Thu Feb  7 14:42:16 2019
spine02           swp2                      0.0.0.0      Unnumbered       Full       leaf02            swp52                     Thu Feb  7 14:42:16 2019
spine02           swp3                      0.0.0.0      Unnumbered       Full       leaf03            swp52                     Thu Feb  7 14:42:16 2019
spine02           swp4                      0.0.0.0      Unnumbered       Full       leaf04            swp52                     Thu Feb  7 14:42:16 2019
View the Distribution of Sessions
It is useful to know the number of network nodes running the OSPF protocol over a period of time, as it gives you insight into the amount of traffic associated with and breadth of use of the protocol. It is also useful to view the health of the sessions.
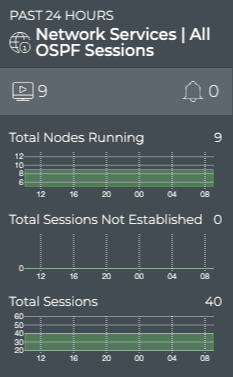
To view these distributions, open the medium Network Services|All OSPF Sessions card. In this example, there are nine nodes running the service with a total of 40 sessions. This has not changed over the past 24 hours.
To view the number of switches running the OSPF service, run:
netq show ospf
Count the switches in the output.
This example shows four leaf switches and two spine switches are running the OSPF service, for a total of six switches.
cumulus@switch:~$ netq show ospf
Matching ospf records:
Hostname          Interface                 Area         Type             State      Peer Hostname     Peer Interface            Last Changed
----------------- ------------------------- ------------ ---------------- ---------- ----------------- ------------------------- -------------------------
leaf01            swp51                     0.0.0.0      Unnumbered       Full       spine01           swp1                      Thu Feb  7 14:42:16 2019
leaf01            swp52                     0.0.0.0      Unnumbered       Full       spine02           swp1                      Thu Feb  7 14:42:16 2019
leaf02            swp51                     0.0.0.0      Unnumbered       Full       spine01           swp2                      Thu Feb  7 14:42:16 2019
leaf02            swp52                     0.0.0.0      Unnumbered       Full       spine02           swp2                      Thu Feb  7 14:42:16 2019
leaf03            swp51                     0.0.0.0      Unnumbered       Full       spine01           swp3                      Thu Feb  7 14:42:16 2019
leaf03            swp52                     0.0.0.0      Unnumbered       Full       spine02           swp3                      Thu Feb  7 14:42:16 2019
leaf04            swp51                     0.0.0.0      Unnumbered       Full       spine01           swp4                      Thu Feb  7 14:42:16 2019
leaf04            swp52                     0.0.0.0      Unnumbered       Full       spine02           swp4                      Thu Feb  7 14:42:16 2019
spine01           swp1                      0.0.0.0      Unnumbered       Full       leaf01            swp51                     Thu Feb  7 14:42:16 2019
spine01           swp2                      0.0.0.0      Unnumbered       Full       leaf02            swp51                     Thu Feb  7 14:42:16 2019
spine01           swp3                      0.0.0.0      Unnumbered       Full       leaf03            swp51                     Thu Feb  7 14:42:16 2019
spine01           swp4                      0.0.0.0      Unnumbered       Full       leaf04            swp51                     Thu Feb  7 14:42:16 2019
spine02           swp1                      0.0.0.0      Unnumbered       Full       leaf01            swp52                     Thu Feb  7 14:42:16 2019
spine02           swp2                      0.0.0.0      Unnumbered       Full       leaf02            swp52                     Thu Feb  7 14:42:16 2019
spine02           swp3                      0.0.0.0      Unnumbered       Full       leaf03            swp52                     Thu Feb  7 14:42:16 2019
spine02           swp4                      0.0.0.0      Unnumbered       Full       leaf04            swp52                     Thu Feb  7 14:42:16 2019
To compare this count with the count at another time, run the netq show ospf command with the around option. Count the devices running OSPF at that time. Repeat with another time to collect a picture of changes over time.
View Devices with the Most OSPF Sessions
You can view the load from OSPF on your switches and hosts using the large Network Services card. This data enables you to see which switches are handling the most OSPF traffic currently, validate that is what you expect based on your network design, and compare that with data from an earlier time to look for any differences.
To view switches and hosts with the most OSPF sessions:
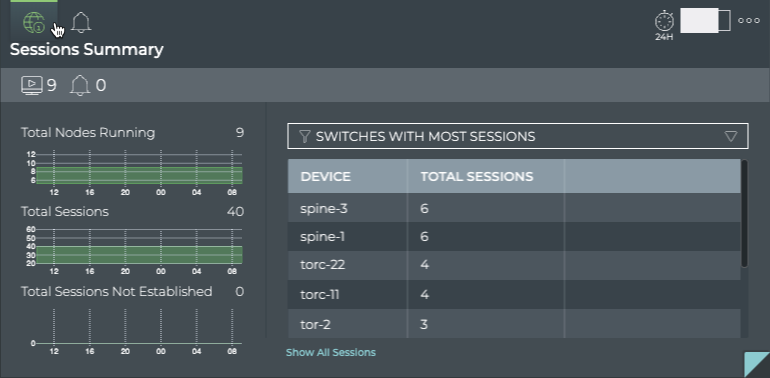
Open the large Network Services|All OSPF Sessions card.
Select Switches with Most Sessions from the filter above the table.
The table content sorts by this characteristic, listing nodes running the most OSPF sessions at the top. Scroll down to view those with the fewest sessions.
To compare this data with the same data at a previous time:
Open another large OSPF Service card.
Move the new card next to the original card if needed.
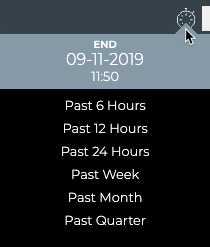
Change the time period for the data on the new card by hovering over the card and clicking
 .
.Select the time period that you want to compare with the original time. We chose Past Week for this example.
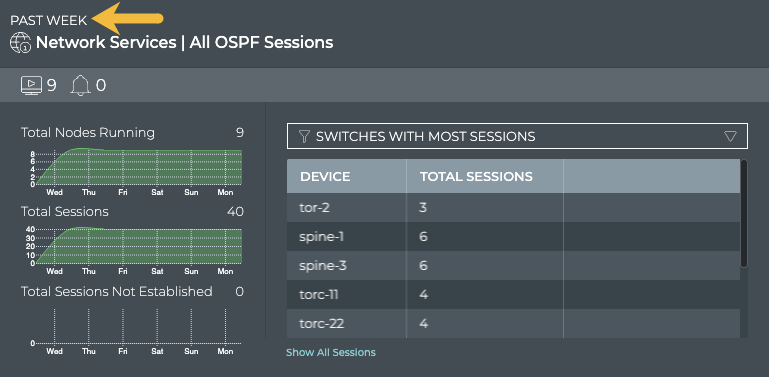
To determine the devices with the most sessions, run netq show ospf. Then count the sessions on each device.
In this example, the leaf01-04 switches each have two sessions and the spine01-02 switches have four session each. Therefore the spine switches have the most sessions.
cumulus@switch:~$ netq show ospf
Matching ospf records:
Hostname          Interface                 Area         Type             State      Peer Hostname     Peer Interface            Last Changed
----------------- ------------------------- ------------ ---------------- ---------- ----------------- ------------------------- -------------------------
leaf01            swp51                     0.0.0.0      Unnumbered       Full       spine01           swp1                      Thu Feb  7 14:42:16 2019
leaf01            swp52                     0.0.0.0      Unnumbered       Full       spine02           swp1                      Thu Feb  7 14:42:16 2019
leaf02            swp51                     0.0.0.0      Unnumbered       Full       spine01           swp2                      Thu Feb  7 14:42:16 2019
leaf02            swp52                     0.0.0.0      Unnumbered       Full       spine02           swp2                      Thu Feb  7 14:42:16 2019
leaf03            swp51                     0.0.0.0      Unnumbered       Full       spine01           swp3                      Thu Feb  7 14:42:16 2019
leaf03            swp52                     0.0.0.0      Unnumbered       Full       spine02           swp3                      Thu Feb  7 14:42:16 2019
leaf04            swp51                     0.0.0.0      Unnumbered       Full       spine01           swp4                      Thu Feb  7 14:42:16 2019
leaf04            swp52                     0.0.0.0      Unnumbered       Full       spine02           swp4                      Thu Feb  7 14:42:16 2019
spine01           swp1                      0.0.0.0      Unnumbered       Full       leaf01            swp51                     Thu Feb  7 14:42:16 2019
spine01           swp2                      0.0.0.0      Unnumbered       Full       leaf02            swp51                     Thu Feb  7 14:42:16 2019
spine01           swp3                      0.0.0.0      Unnumbered       Full       leaf03            swp51                     Thu Feb  7 14:42:16 2019
spine01           swp4                      0.0.0.0      Unnumbered       Full       leaf04            swp51                     Thu Feb  7 14:42:16 2019
spine02           swp1                      0.0.0.0      Unnumbered       Full       leaf01            swp52                     Thu Feb  7 14:42:16 2019
spine02           swp2                      0.0.0.0      Unnumbered       Full       leaf02            swp52                     Thu Feb  7 14:42:16 2019
spine02           swp3                      0.0.0.0      Unnumbered       Full       leaf03            swp52                     Thu Feb  7 14:42:16 2019
spine02           swp4                      0.0.0.0      Unnumbered       Full       leaf04            swp52                     Thu Feb  7 14:42:16 2019
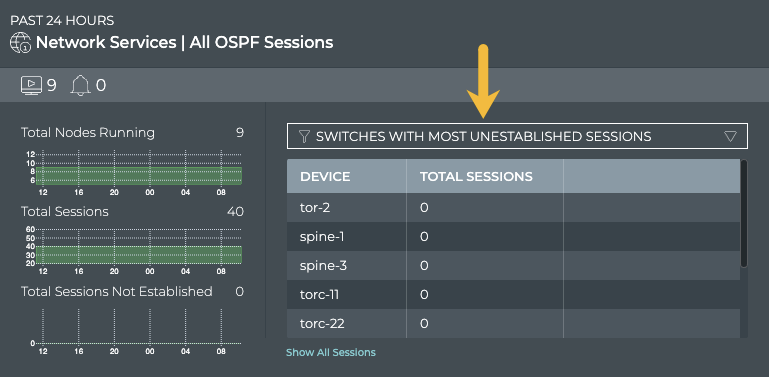
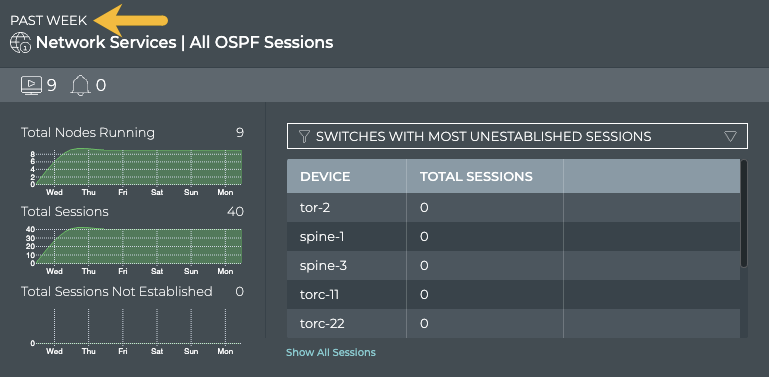
View Devices with the Most Unestablished OSPF Sessions
You can identify switches and hosts that are experiencing difficulties establishing OSPF sessions; both currently and in the past using the NetQ UI.
To view switches with the most unestablished OSPF sessions:
Open the large Network Services|All OSPF Sessions card.
Select Switches with Most Unestablished Sessions from the filter above the table.
The table content sorts by this characteristic, listing nodes with the most unestablished OSPF sessions at the top. Scroll down to view those with the fewest unestablished sessions.
Where to go next depends on what data you see, but a couple of options include:
Change the time period for the data to compare with a prior time.
If the same switches are consistently indicating the most unestablished sessions, you might want to look more carefully at those switches using the Switches card workflow to determine probable causes. Refer to Monitor Switch Performance.
Click Show All Sessions to investigate all OSPF sessions with events in the full screen card.
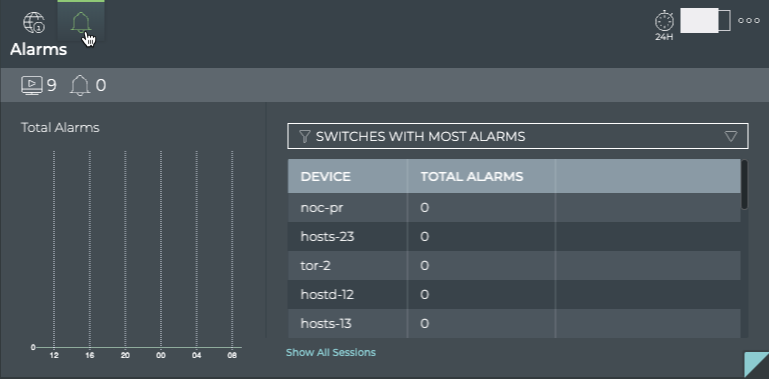
View Devices with the Most OSPF-related Alarms
Switches or hosts experiencing a large number of OSPF alarms might indicate a configuration or performance issue that needs further investigation. You can view the devices sorted by the number of OSPF alarms and then use the Switches card workflow or the Alarms card workflow to gather more information about possible causes for the alarms. Compare the number of nodes running OSPF with unestablished sessions with the alarms present at the same time to determine if there is any correlation between the issues and the ability to establish an OSPF session.
To view switches with the most OSPF alarms:
Open the large OSPF Service card.
Hover over the header and click
 .
.Select Switches with Most Alarms from the filter above the table.
The table content is sorted by this characteristic, listing nodes with the most OSPF alarms at the top. Scroll down to view those with the fewest alarms.
Where to go next depends on what data you see, but a few options include:
- Change the time period for the data to compare with a prior time. If the same switches are consistently indicating the most alarms, you might want to look more carefully at those switches using the Switches card workflow.
- Click Show All Sessions to investigate all OSPF sessions with events in the full screen card.
View All OSPF Events
You can view all of the OSPF-related events in the network using the NetQ UI or the NetQ CLI.
The Network Services|All OSPF Sessions card enables you to view all of the OSPF events in the designated time period.
To view all OSPF events:
Open the full-screen Network Services|All OSPF Sessions card.
Click All Alarms in the navigation panel. By default, events are listed in most recent to least recent order.
Where to go next depends on what data you see, but a couple of options include:
- Open one of the other full-screen tabs in this flow to focus on devices or sessions.
- Export the data for use in another analytics tool, by clicking
 and providing a name for the data file.
To view OSPF events, run:
netq [<hostname>] show events [level info | level error | level warning | level critical | level debug] type ospf [between <text-time> and <text-endtime>] [json]
For example:
- To view all OSPF events, run
netq show events type ospf. - To view only critical OSPF events, run
netq show events level critical type ospf. - To view all OSPF events in the past three days, run
netq show events type ospf between now and 3d.
View Details for All Devices Running OSPF
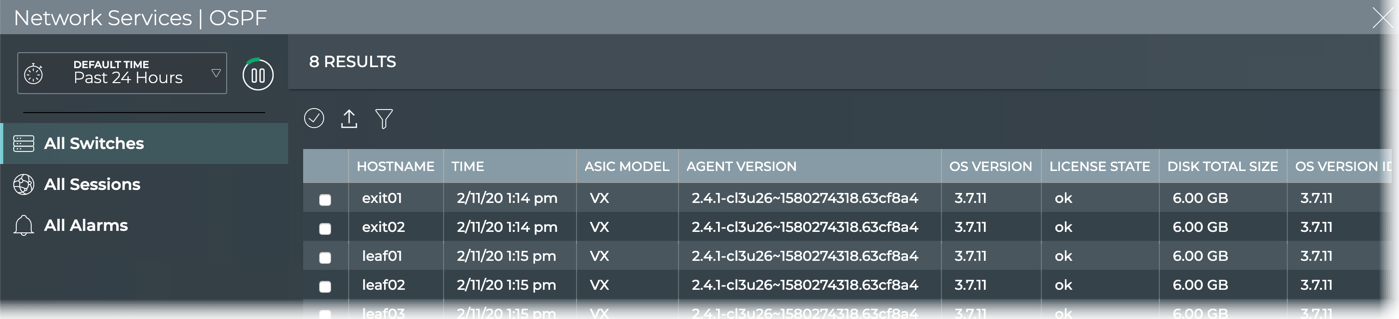
You can view all stored attributes of all switches and hosts running OSPF in your network in the full screen card.
To view all device details, open the full screen OSPF Service card and click the All Switches tab.
To return to your workbench, click ![]() in the top right corner.
in the top right corner.
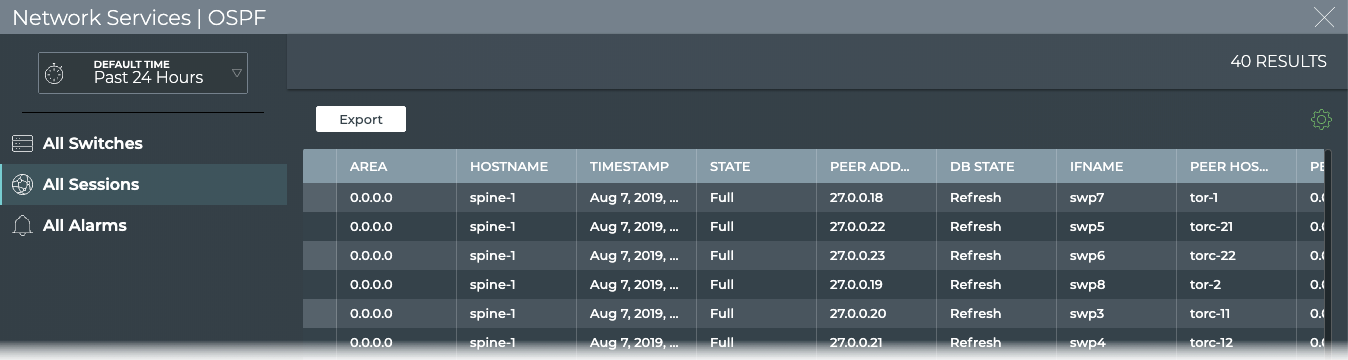
View Details for All OSPF Sessions
You can view all stored attributes of all OSPF sessions in your network with the NetQ UI or the NetQ CLI.
To view all session details, open the full screen Network Services|All OSPF Sessions card and click the All Sessions tab.
To return to your workbench, click ![]() in the top right corner.
in the top right corner.
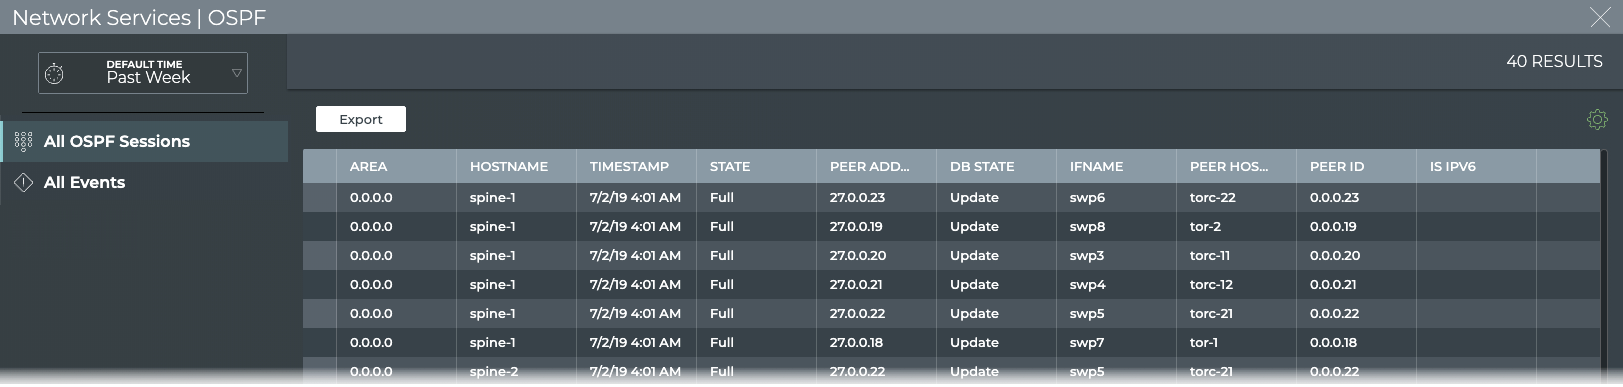
Use the icons above the table to select/deselect, filter, and export items in the list. Refer to Table Settings for more detail. To return to original display of results, click the associated tab.
To view session details, run netq show ospf.
This example show all current sessions and the attributes associated with them.
cumulus@switch:~$ netq show ospf
Matching ospf records:
Hostname          Interface                 Area         Type             State      Peer Hostname     Peer Interface            Last Changed
----------------- ------------------------- ------------ ---------------- ---------- ----------------- ------------------------- -------------------------
leaf01            swp51                     0.0.0.0      Unnumbered       Full       spine01           swp1                      Thu Feb  7 14:42:16 2019
leaf01            swp52                     0.0.0.0      Unnumbered       Full       spine02           swp1                      Thu Feb  7 14:42:16 2019
leaf02            swp51                     0.0.0.0      Unnumbered       Full       spine01           swp2                      Thu Feb  7 14:42:16 2019
leaf02            swp52                     0.0.0.0      Unnumbered       Full       spine02           swp2                      Thu Feb  7 14:42:16 2019
leaf03            swp51                     0.0.0.0      Unnumbered       Full       spine01           swp3                      Thu Feb  7 14:42:16 2019
leaf03            swp52                     0.0.0.0      Unnumbered       Full       spine02           swp3                      Thu Feb  7 14:42:16 2019
leaf04            swp51                     0.0.0.0      Unnumbered       Full       spine01           swp4                      Thu Feb  7 14:42:16 2019
leaf04            swp52                     0.0.0.0      Unnumbered       Full       spine02           swp4                      Thu Feb  7 14:42:16 2019
spine01           swp1                      0.0.0.0      Unnumbered       Full       leaf01            swp51                     Thu Feb  7 14:42:16 2019
spine01           swp2                      0.0.0.0      Unnumbered       Full       leaf02            swp51                     Thu Feb  7 14:42:16 2019
spine01           swp3                      0.0.0.0      Unnumbered       Full       leaf03            swp51                     Thu Feb  7 14:42:16 2019
spine01           swp4                      0.0.0.0      Unnumbered       Full       leaf04            swp51                     Thu Feb  7 14:42:16 2019
spine02           swp1                      0.0.0.0      Unnumbered       Full       leaf01            swp52                     Thu Feb  7 14:42:16 2019
spine02           swp2                      0.0.0.0      Unnumbered       Full       leaf02            swp52                     Thu Feb  7 14:42:16 2019
spine02           swp3                      0.0.0.0      Unnumbered       Full       leaf03            swp52                     Thu Feb  7 14:42:16 2019
spine02           swp4                      0.0.0.0      Unnumbered       Full       leaf04            swp52                     Thu Feb  7 14:42:16 2019
Monitor a Single OSPF Session
With NetQ, you can monitor the performance of a single OSPF session using the NetQ UI or the NetQ CLI.
- Network Services|OSPF Session
- Small: view devices participating in the session and summary status
- Medium: view devices participating in the session, summary status, session state changes, and key identifiers of the session
- Large: view devices participating in the session, summary status, session state changes, event distribution and counts, attributes of the session, and the running OSPF configuration and changes to the configuration file
- Full-screen: view all session attributes and all events
netq <hostname> show ospfcommand: view configuration and status for session by hostname, including interface, area, type, state, peer hostname, peer interface, and the last time this information changed
For an overview and how to configure OSPF to run in your data center network, refer to Open Shortest Path First - OSPF or Open Shortest Path First v3 - OSPFv3.
To access the single session cards, you must open the full screen Network Services|All OSPF Sessions card, click the All Sessions tab, select the desired session, then click ![]() (Open Card).
(Open Card).
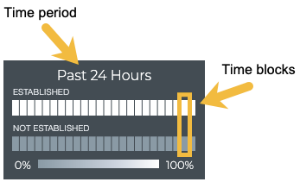
Granularity of Data Shown Based on Time Period
On the medium and large single OSPF session cards, vertically stacked heat maps represent the status of the sessions; one for established sessions, and one for unestablished sessions. Depending on the time period of data on the card, the number of smaller time blocks used to indicate the status varies. A vertical stack of time blocks, one from each map, includes the results from all checks during that time. The results appear by how saturated the color is for each block. If all sessions during that time period were established for the entire time block, then the top block is 100% saturated (white) and the unestablished block is zero percent saturated (gray). As sessions that are not established increase in saturation, the sessions that are established block is proportionally reduced in saturation. The following example heat map is for a time period of 24 hours, with the most common time periods in the table showing the resulting time blocks.
| Time Period | Number of Runs | Number Time Blocks | Amount of Time in Each Block |
|---|---|---|---|
| 6 hours | 18 | 6 | 1 hour |
| 12 hours | 36 | 12 | 1 hour |
| 24 hours | 72 | 24 | 1 hour |
| 1 week | 504 | 7 | 1 day |
| 1 month | 2,086 | 30 | 1 day |
| 1 quarter | 7,000 | 13 | 1 week |
View Session Status Summary
You can view a summary of a given OSPF session from the NetQ UI or NetQ CLI.
To view the summary:
Open the Network Services|All OSPF Sessions card.
Switch to the full-screen card using the card size picker.
Click the All Sessions tab.
Select the session of interest, then click
 (Open Card).
Optionally, switch to the small OSPF Session card.

To view a session summary, run:
netq <hostname> show ospf [<remote-interface>] [area <area-id>] [around <text-time>] [json]
Where:
remote-interfacespecifies the interface on host nodeareafilters for sessions occurring in a designated OSPF areaaroundshows status at a time in the pastjsonoutputs the results in JSON format
This example show OSPF sessions on the leaf01 switch:
cumulus@switch:~$ netq leaf01 show ospf
Matching ospf records:
Hostname          Interface                 Area         Type             State      Peer Hostname     Peer Interface            Last Changed
----------------- ------------------------- ------------ ---------------- ---------- ----------------- ------------------------- -------------------------
leaf01            swp51                     0.0.0.0      Unnumbered       Full       spine01           swp1                      Thu Feb  7 14:42:16 2019
leaf01            swp52                     0.0.0.0      Unnumbered       Full       spine02           swp1                      Thu Feb  7 14:42:16 2019
This example shows OSPF sessions for all devices using the swp51 interface on the host node.
cumulus@switch:~$ netq show ospf swp51
Matching ospf records:
Hostname          Interface                 Area         Type             State      Peer Hostname     Peer Interface            Last Changed
----------------- ------------------------- ------------ ---------------- ---------- ----------------- ------------------------- -------------------------
leaf01            swp51                     0.0.0.0      Unnumbered       Full       spine01           swp1                      Thu Feb  7 14:42:16 2019
leaf02            swp51                     0.0.0.0      Unnumbered       Full       spine01           swp2                      Thu Feb  7 14:42:16 2019
leaf03            swp51                     0.0.0.0      Unnumbered       Full       spine01           swp3                      Thu Feb  7 14:42:16 2019
leaf04            swp51                     0.0.0.0      Unnumbered       Full       spine01           swp4                      Thu Feb  7 14:42:16 2019
View OSPF Session State Changes
You can view the state of a given OSPF session from the medium and large Network Service|All OSPF Sessions card. For a given time period, you can determine the stability of the OSPF session between two devices. If you experienced connectivity issues at a particular time, you can use these cards to help verify the state of the session. If it was not established more than it was established, you can then investigate further into possible causes.
To view the state transitions for a given OSPF session, on the medium OSPF Session card:
Open the Network Services|All OSPF Sessions card.
Switch to the full-screen card using the card size picker.
Click the All Sessions tab.
Select the session of interest. The full-screen card closes automatically.
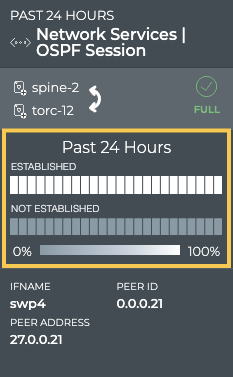
The heat map indicates the status of the session over the designated time period. In this example, the session has been established for the entire time period.
From this card, you can also view the interface name, peer address, and peer id identifying the session in more detail.
To view the state transitions for a given OSPF session on the large OSPF Session card:
Open a Network Services|OSPF Session card.
Hover over the card, and change to the large card using the card size picker.
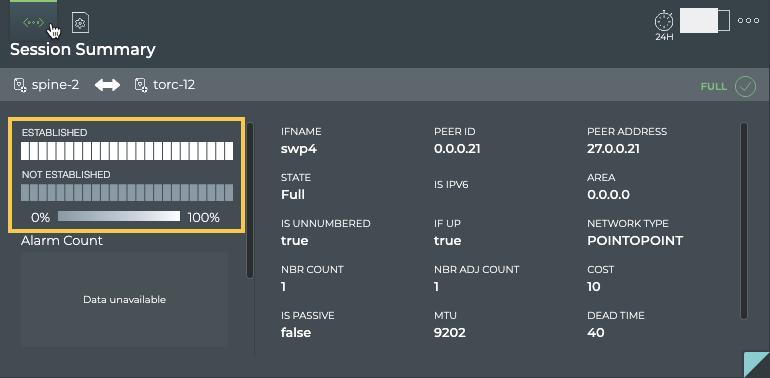
From this card, you can view the alarm and info event counts, interface name, peer address and peer id, state, and several other parameters identifying the session in more detail.
View Changes to the OSPF Service Configuration File
Each time a change is made to the configuration file for the OSPF service, NetQ logs the change and enables you to compare it with the last version using the NetQ UI. This can be useful when you are troubleshooting potential causes for alarms or sessions losing their connections.
To view the configuration file changes:
Open or add the Network Services|All OSPF Sessions card.
Switch to the full-screen card.
Click the All Sessions tab.
Select the session of interest. The full-screen card closes automatically.
Hover over the card, and change to the large card using the card size picker.
Hover over the card and click
 to open the Configuration File Evolution tab.
Select the time of interest on the left; when a change might have impacted the performance. Scroll down if needed.
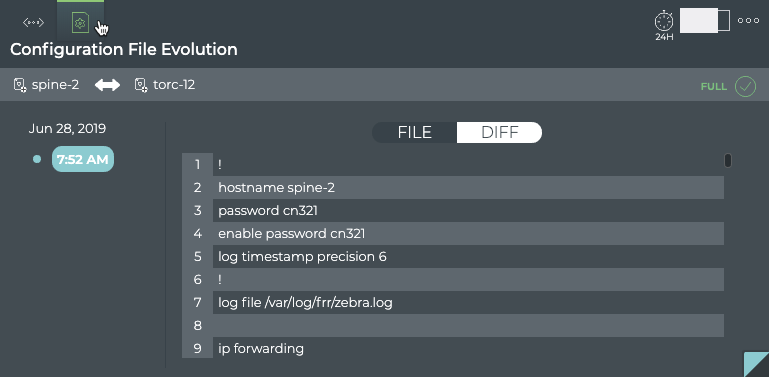
Choose between the File view and the Diff view (selected option is dark; File by default).
The File view displays the content of the file for you to review.
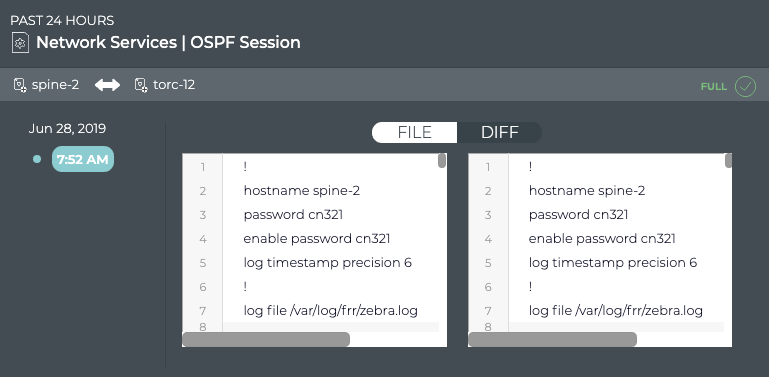
The Diff view displays the changes between this version (on left) and the most recent version (on right) side by side. The changes are highlighted in red and green. In this example, we don’t have a change to highlight, so it shows the same file on both sides.
View All OSPF Session Details
You can view attributes of all of the OSPF sessions for the devices participating in a given session with the NetQ UI and the NetQ CLI.
To view all session details:
Open or add the Network Services|All OSPF Sessions card.
Switch to the full-screen card.
Click the All Sessions tab.
Select the session of interest. The full-screen card closes automatically.
Hover over the card, and change to the full-screen card using the card size picker.
- To return to your workbench, click
 in the top right corner.
Run the netq show ospf command.
This example shows all OSPF sessions. Filter by remote interface or area to narrow the listing. Scroll until you find the session of interest.
cumulus@switch:~$ netq show ospf
Matching ospf records:
Hostname          Interface                 Area         Type             State      Peer Hostname     Peer Interface            Last Changed
----------------- ------------------------- ------------ ---------------- ---------- ----------------- ------------------------- -------------------------
leaf01            swp51                     0.0.0.0      Unnumbered       Full       spine01           swp1                      Thu Feb  7 14:42:16 2019
leaf01            swp52                     0.0.0.0      Unnumbered       Full       spine02           swp1                      Thu Feb  7 14:42:16 2019
leaf02            swp51                     0.0.0.0      Unnumbered       Full       spine01           swp2                      Thu Feb  7 14:42:16 2019
leaf02            swp52                     0.0.0.0      Unnumbered       Full       spine02           swp2                      Thu Feb  7 14:42:16 2019
leaf03            swp51                     0.0.0.0      Unnumbered       Full       spine01           swp3                      Thu Feb  7 14:42:16 2019
leaf03            swp52                     0.0.0.0      Unnumbered       Full       spine02           swp3                      Thu Feb  7 14:42:16 2019
leaf04            swp51                     0.0.0.0      Unnumbered       Full       spine01           swp4                      Thu Feb  7 14:42:16 2019
leaf04            swp52                     0.0.0.0      Unnumbered       Full       spine02           swp4                      Thu Feb  7 14:42:16 2019
spine01           swp1                      0.0.0.0      Unnumbered       Full       leaf01            swp51                     Thu Feb  7 14:42:16 2019
spine01           swp2                      0.0.0.0      Unnumbered       Full       leaf02            swp51                     Thu Feb  7 14:42:16 2019
spine01           swp3                      0.0.0.0      Unnumbered       Full       leaf03            swp51                     Thu Feb  7 14:42:16 2019
spine01           swp4                      0.0.0.0      Unnumbered       Full       leaf04            swp51                     Thu Feb  7 14:42:16 2019
spine02           swp1                      0.0.0.0      Unnumbered       Full       leaf01            swp52                     Thu Feb  7 14:42:16 2019
spine02           swp2                      0.0.0.0      Unnumbered       Full       leaf02            swp52                     Thu Feb  7 14:42:16 2019
spine02           swp3                      0.0.0.0      Unnumbered       Full       leaf03            swp52                     Thu Feb  7 14:42:16 2019
spine02           swp4                      0.0.0.0      Unnumbered       Full       leaf04            swp52                     Thu Feb  7 14:42:16 2019
View All Events for a Given Session
You can view all alarm and info events for the devices participating in a given session with the NetQ UI.
To view all events:
Open or add the Network Services|All OSPF Sessions card.
Switch to the full-screen card.
Click the All Sessions tab.
Select the session of interest. The full-screen card closes automatically.
Hover over the card, and change to the full-screen card using the card size picker.
Click the All Events tab.
To return to your workbench, click
in the top right corner.