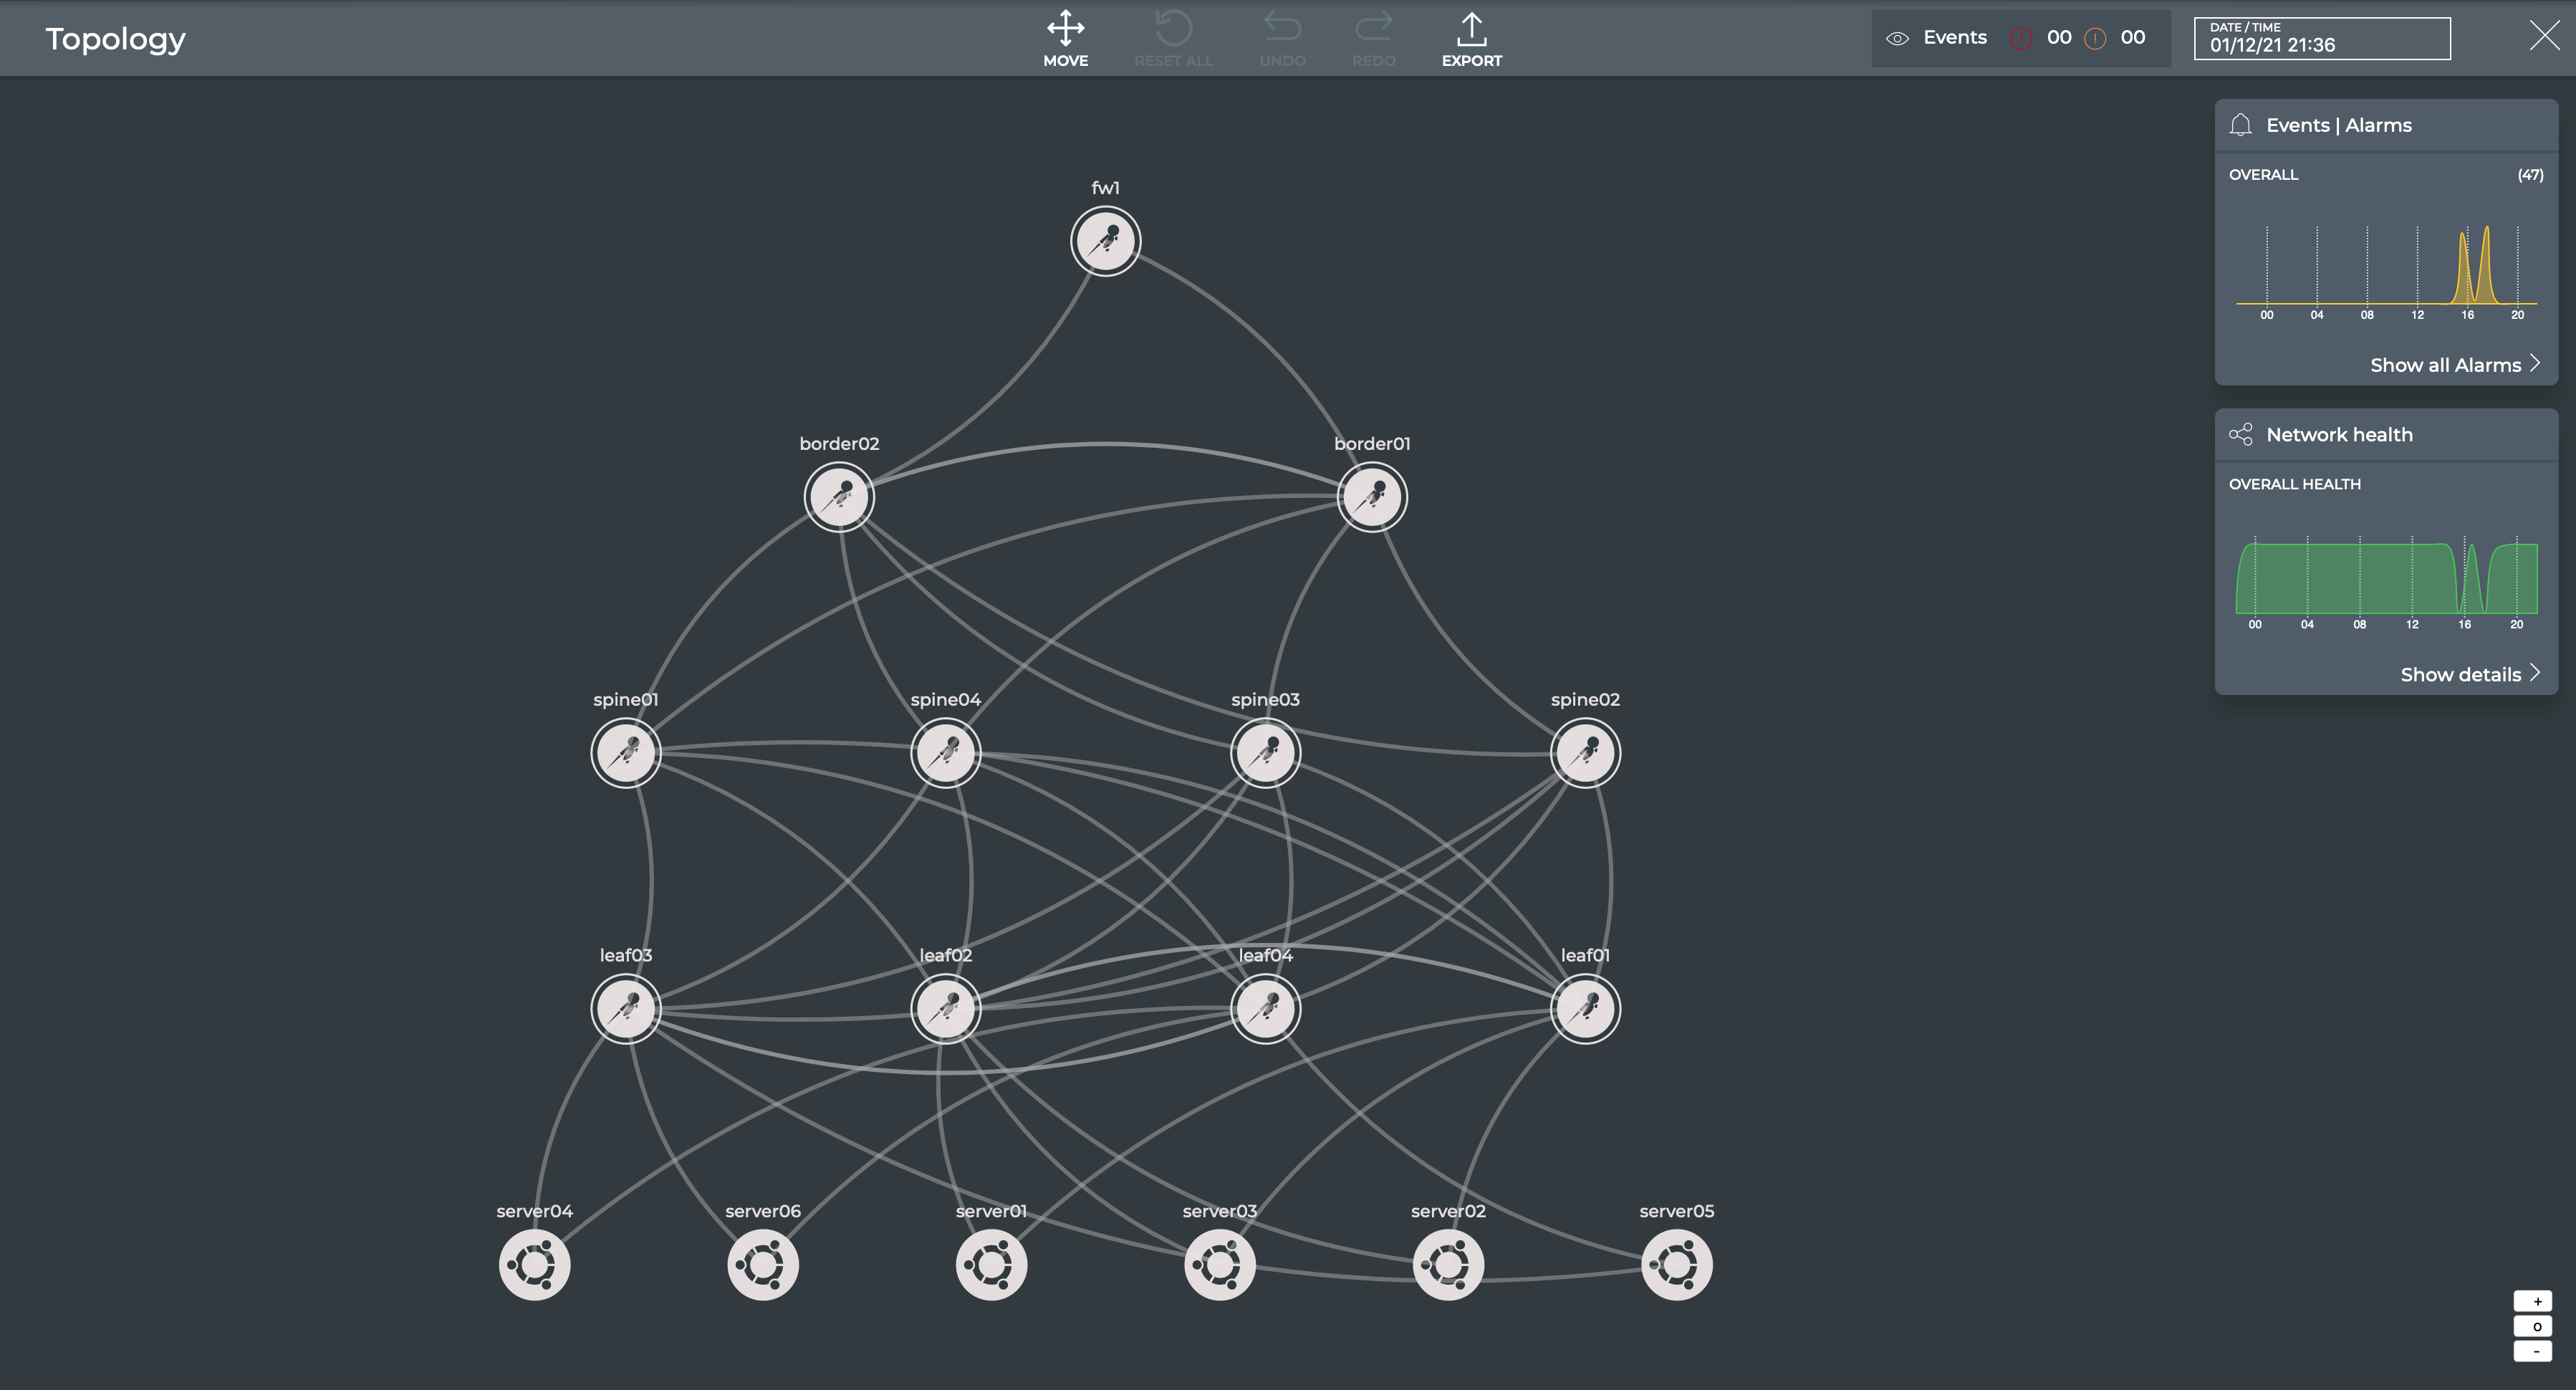
Monitor Using Topology View
The core capabilities of NetQ enable you to monitor your network by viewing performance and configuration data about your individual network devices and the entire fabric networkwide. The topics contained in this section describe monitoring tasks you can perform from a topology view rather than through the NetQ UI card workflows or the NetQ CLI.
Access the Topology View
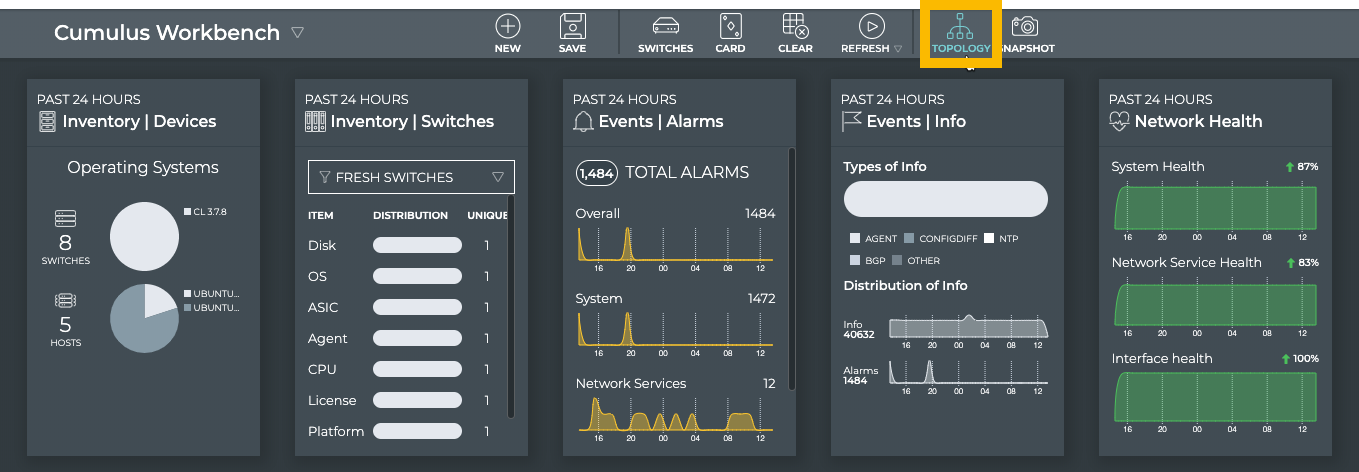
To open the topology view, click ![]() in any workbench header.
in any workbench header.
This opens the full screen view of your network topology.
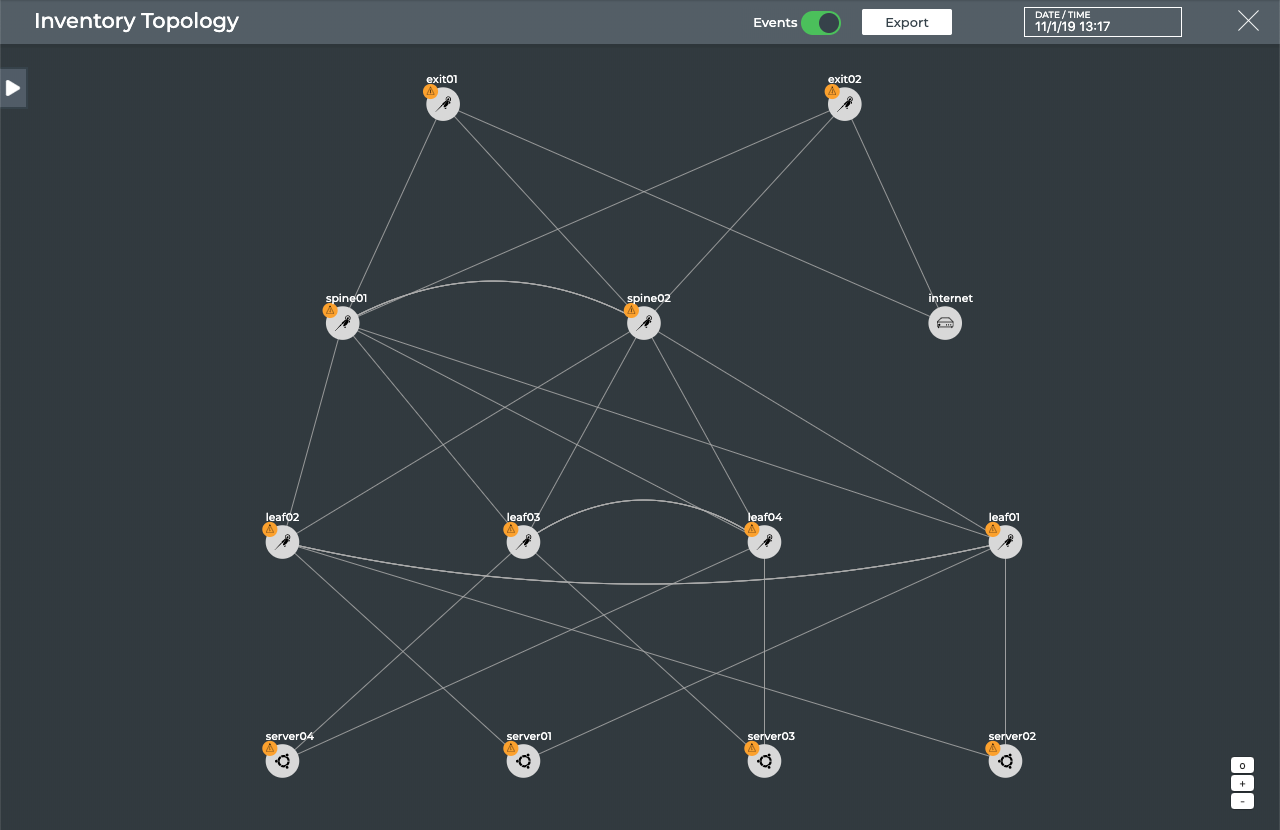
This document uses the Cumulus Networks reference topology for all examples.
To close the view, click ![]() in the top right corner.
in the top right corner.
Topology Overview
The topology view provides a visual representation of your Linux network, showing the connections and device information for all monitored nodes, for an alternate monitoring and troubleshooting perspective. The topology view uses a number of icons and elements to represent the nodes and their connections as follows:
| Symbol | Usage |
|---|---|
| Switch running Cumulus Linux OS | |
| Switch running RedHat, Ubuntu, or CentOS | |
| Host with unknown operating system | |
| Host running Ubuntu | |
| Red | Alarm (critical) event is present on the node |
| Yellow | Info event is present |
| Lines | Physical links or connections |
Interact with the Topology
There are a number of ways in which you can interact with the topology.
Move the Topology Focus
You can move the focus on the topology closer to view a smaller number of nodes, or further out to view a larger number of nodes. As with mapping applications, the node labels appear and disappear as you move in and out on the diagram for better readability. To zoom, you can use:
- The zoom controls,
 , in the bottom right corner of the screen; the ‘+’ zooms you in closer, the ‘-’ moves you further out, and the ‘o’ resets to the default size.
 - A scrolling motion on your mouse.
- Your trackpad.
You can also click anywhere on the topology, and drag it left, right, up, or down to view a different portion of the network diagram. This is especially helpful with larger topologies.
View Data About the Network
You can hover over the various elements to view data about them. Hovering over a node highlights its connections to other nodes, temporarily de-emphasizing all other connections.
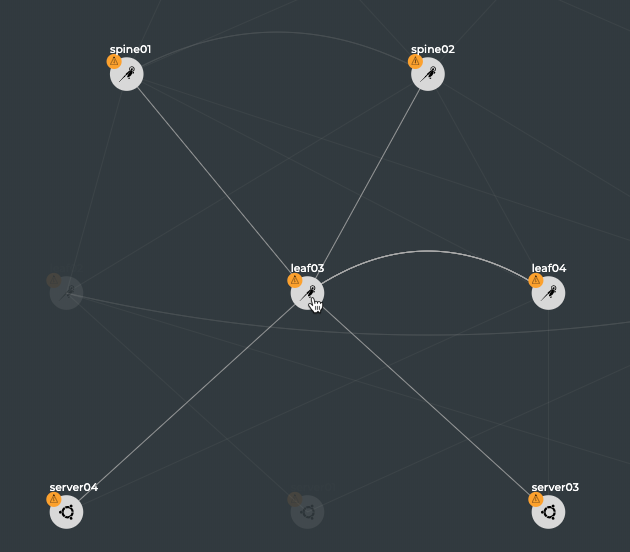
Hovering over a line highlights the connection and displays the interface ports used on each end of the connection. All other connections are temporarily de-emphasized.
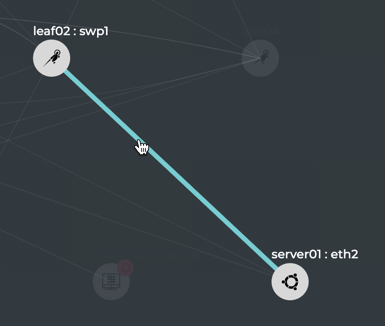
You can also click on the nodes and links to open the Configuration Panel with additional data about them.
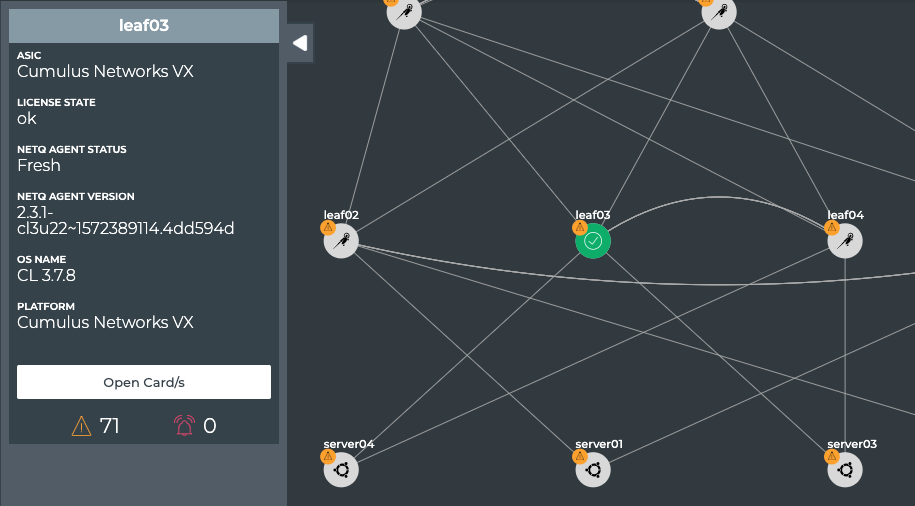
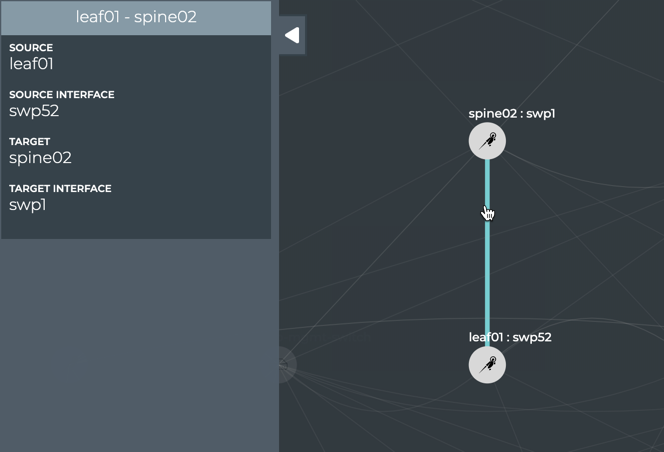
From the Configuration Panel, you can view the following data about nodes and links:
| Node Data | Description |
|---|---|
| ASIC | Name of the ASIC used in the switch. A value of Cumulus Networks VX indicates a virtual machine. |
| NetQ Agent Status | Operational status of the NetQ Agent on the switch; Fresh, Rotten. |
| NetQ Agent Version | Version ID of the NetQ Agent on the switch. |
| OS Name | Operating system running on the switch. |
| Platform | Vendor and name of the switch hardware. |
| Open Card/s | Opens the Event |
| Number of alarm events present on the switch. | |
| Number of info events present on the switch. |
| Link Data | Description |
|---|---|
| Source | Switch where the connection originates |
| Source Interface | Port on the source switch used by the connection |
| Target | Switch where the connection ends |
| Target Interface | Port on the destination switch used by the connection |
After reviewing the provided information, click ![]() to close the panel, or to view data for another node or link without closing the panel, simply click on that element. The panel is hidden by default.
to close the panel, or to view data for another node or link without closing the panel, simply click on that element. The panel is hidden by default.
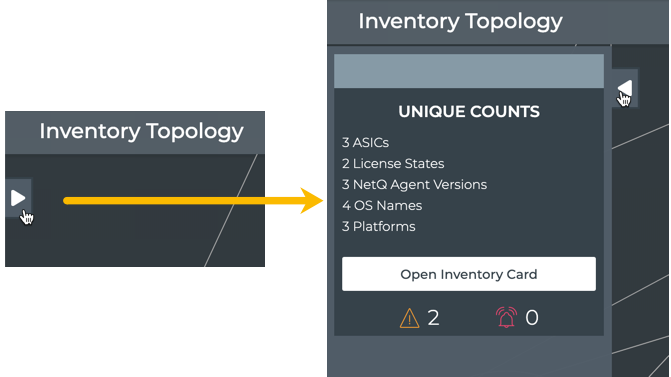
When no devices or links are selected, you can view the unique count of items in the network by clicking on the ![]() on the upper left to open the count summary. Click
on the upper left to open the count summary. Click ![]() to close the panel.
to close the panel.
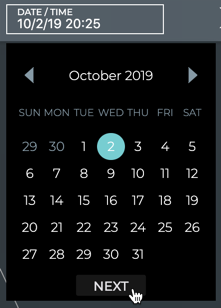
You can change the time period for the data as well. This enables you to view the state of the network in the past and compare it with the current state. Click in the timestamp box in the topology header to select an alternate time period.
Hide Events on Topology Diagram
You can hide the event symbols on the topology diagram. Simple move the Events toggle in the header to the left. Move the toggle to the right to show them again.

Export Your NetQ Topology Data
The topology view provides the option to export your topology information as a JSON file. Click Export in the header.

The JSON file will be similar to this example:
{"inventory":{"unique_counts":{"asic":3,"netq_agent_version":3,"os":4,"platform":3}},"name":"topology","tiers":{"0":"Tier 0","1":"Tier 1","2":"Tier 2","3":"Tier 3"},"links":[{"id":35,"interfaces":[{"interface":"swp1","node":"leaf04"},{"interface":"eth2","node":"server03"}]},{"id":10,"interfaces":[{"interface":"swp51","node":"exit02"},{"interface":"swp29","node":"spine01"}]},{"id":32,"interfaces":[{"interface":"swp2","node":"leaf03"},{"interface":"eth1","node":"server04"}]},{"id":13,"interfaces":[{"interface":"swp51","node":"leaf02"},{"interface":"swp2","node":"spine01"}]},{"id":26,"interfaces":[{"interface":"swp44","node":"exit01"},{"interface":"swp1","node":"internet"}]},{"id":30,"interfaces":[{"interface":"swp31","node":"spine01"},{"interface":"swp31","node":"spine02"}]},{"id":23,"interfaces":[{"interface":"swp1","node":"leaf01"},{"interface":"eth1","node":"server01"}]},{"id":42,"interfaces":[{"interface":"swp51","node":"exit01"},{"interface":"swp30","node":"spine01"}]},{"id":17,"interfaces":[{"interface":"swp52","node":"exit02"},{"interface":"swp29","node":"spine02"}]},{"id":24,"interfaces":[{"interface":"swp50","node":"leaf03"},{"interface":"swp50","node":"leaf04"}]},{"id":9,"interfaces":[{"interface":"eth0","node":"server04"},{"interface":"swp5","node":"oob-mgmt-switch"}]},{"id":28,"interfaces":[{"interface":"swp50","node":"leaf01"},{"interface":"swp50","node":"leaf02"}]},{"id":40,"interfaces":[{"interface":"swp51","node":"leaf04"},{"interface":"swp4","node":"spine01"}]},{"id":12,"interfaces":[{"interface":"swp32","node":"spine01"},{"interface":"swp32","node":"spine02"}]},{"id":29,"interfaces":[{"interface":"eth0","node":"leaf01"},{"interface":"swp6","node":"oob-mgmt-switch"}]},{"id":25,"interfaces":[{"interface":"swp51","node":"leaf03"},{"interface":"swp3","node":"spine01"}]},{"id":22,"interfaces":[{"interface":"swp1","node":"leaf03"},{"interface":"eth1","node":"server03"}]},
...
{"inventory":{"asic":"Cumulus Networks VX","netq_agent_status":"Fresh","netq_agent_version":"2.2.1-cl3u19~1564507571.4cb6474","os":"CL 3.7.6","platform":"Cumulus Networks VX"},"name":"leaf04","tier":1,"interfaces":[{"name":"swp50","connected_to":{"interface":"swp50","link":24,"node":"leaf03"}},{"name":"swp51","connected_to":{"interface":"swp4","link":40,"node":"spine01"}},{"name":"swp2","connected_to":{"interface":"eth2","link":5,"node":"server04"}},{"name":"swp1","connected_to":{"interface":"eth2","link":35,"node":"server03"}},{"name":"swp49","connected_to":{"interface":"swp49","link":2,"node":"leaf03"}},{"name":"swp52","connected_to":{"interface":"swp4","link":11,"node":"spine02"}}],"protocol":{"bgp":false,"clag":false,"evpn":false,"lldp":true,"vni":[]},"events":{"count_alarm":0,"count_info":0}}],"events":{"count_alarm":0,"count_info":0}}
Rearrange the Topology Layout
NetQ automatically generates the network topology and positions the nodes automatically. In large topologies, the position of the nodes might not be suitable for easy viewing. You can move the components of the topology around on screen to suit your needs. You can save the new layout so other users can see it.
Consider the following topology:
Click
 the Move icon.
In the example below, we switch the positions of the two border switches (border01 and border02):
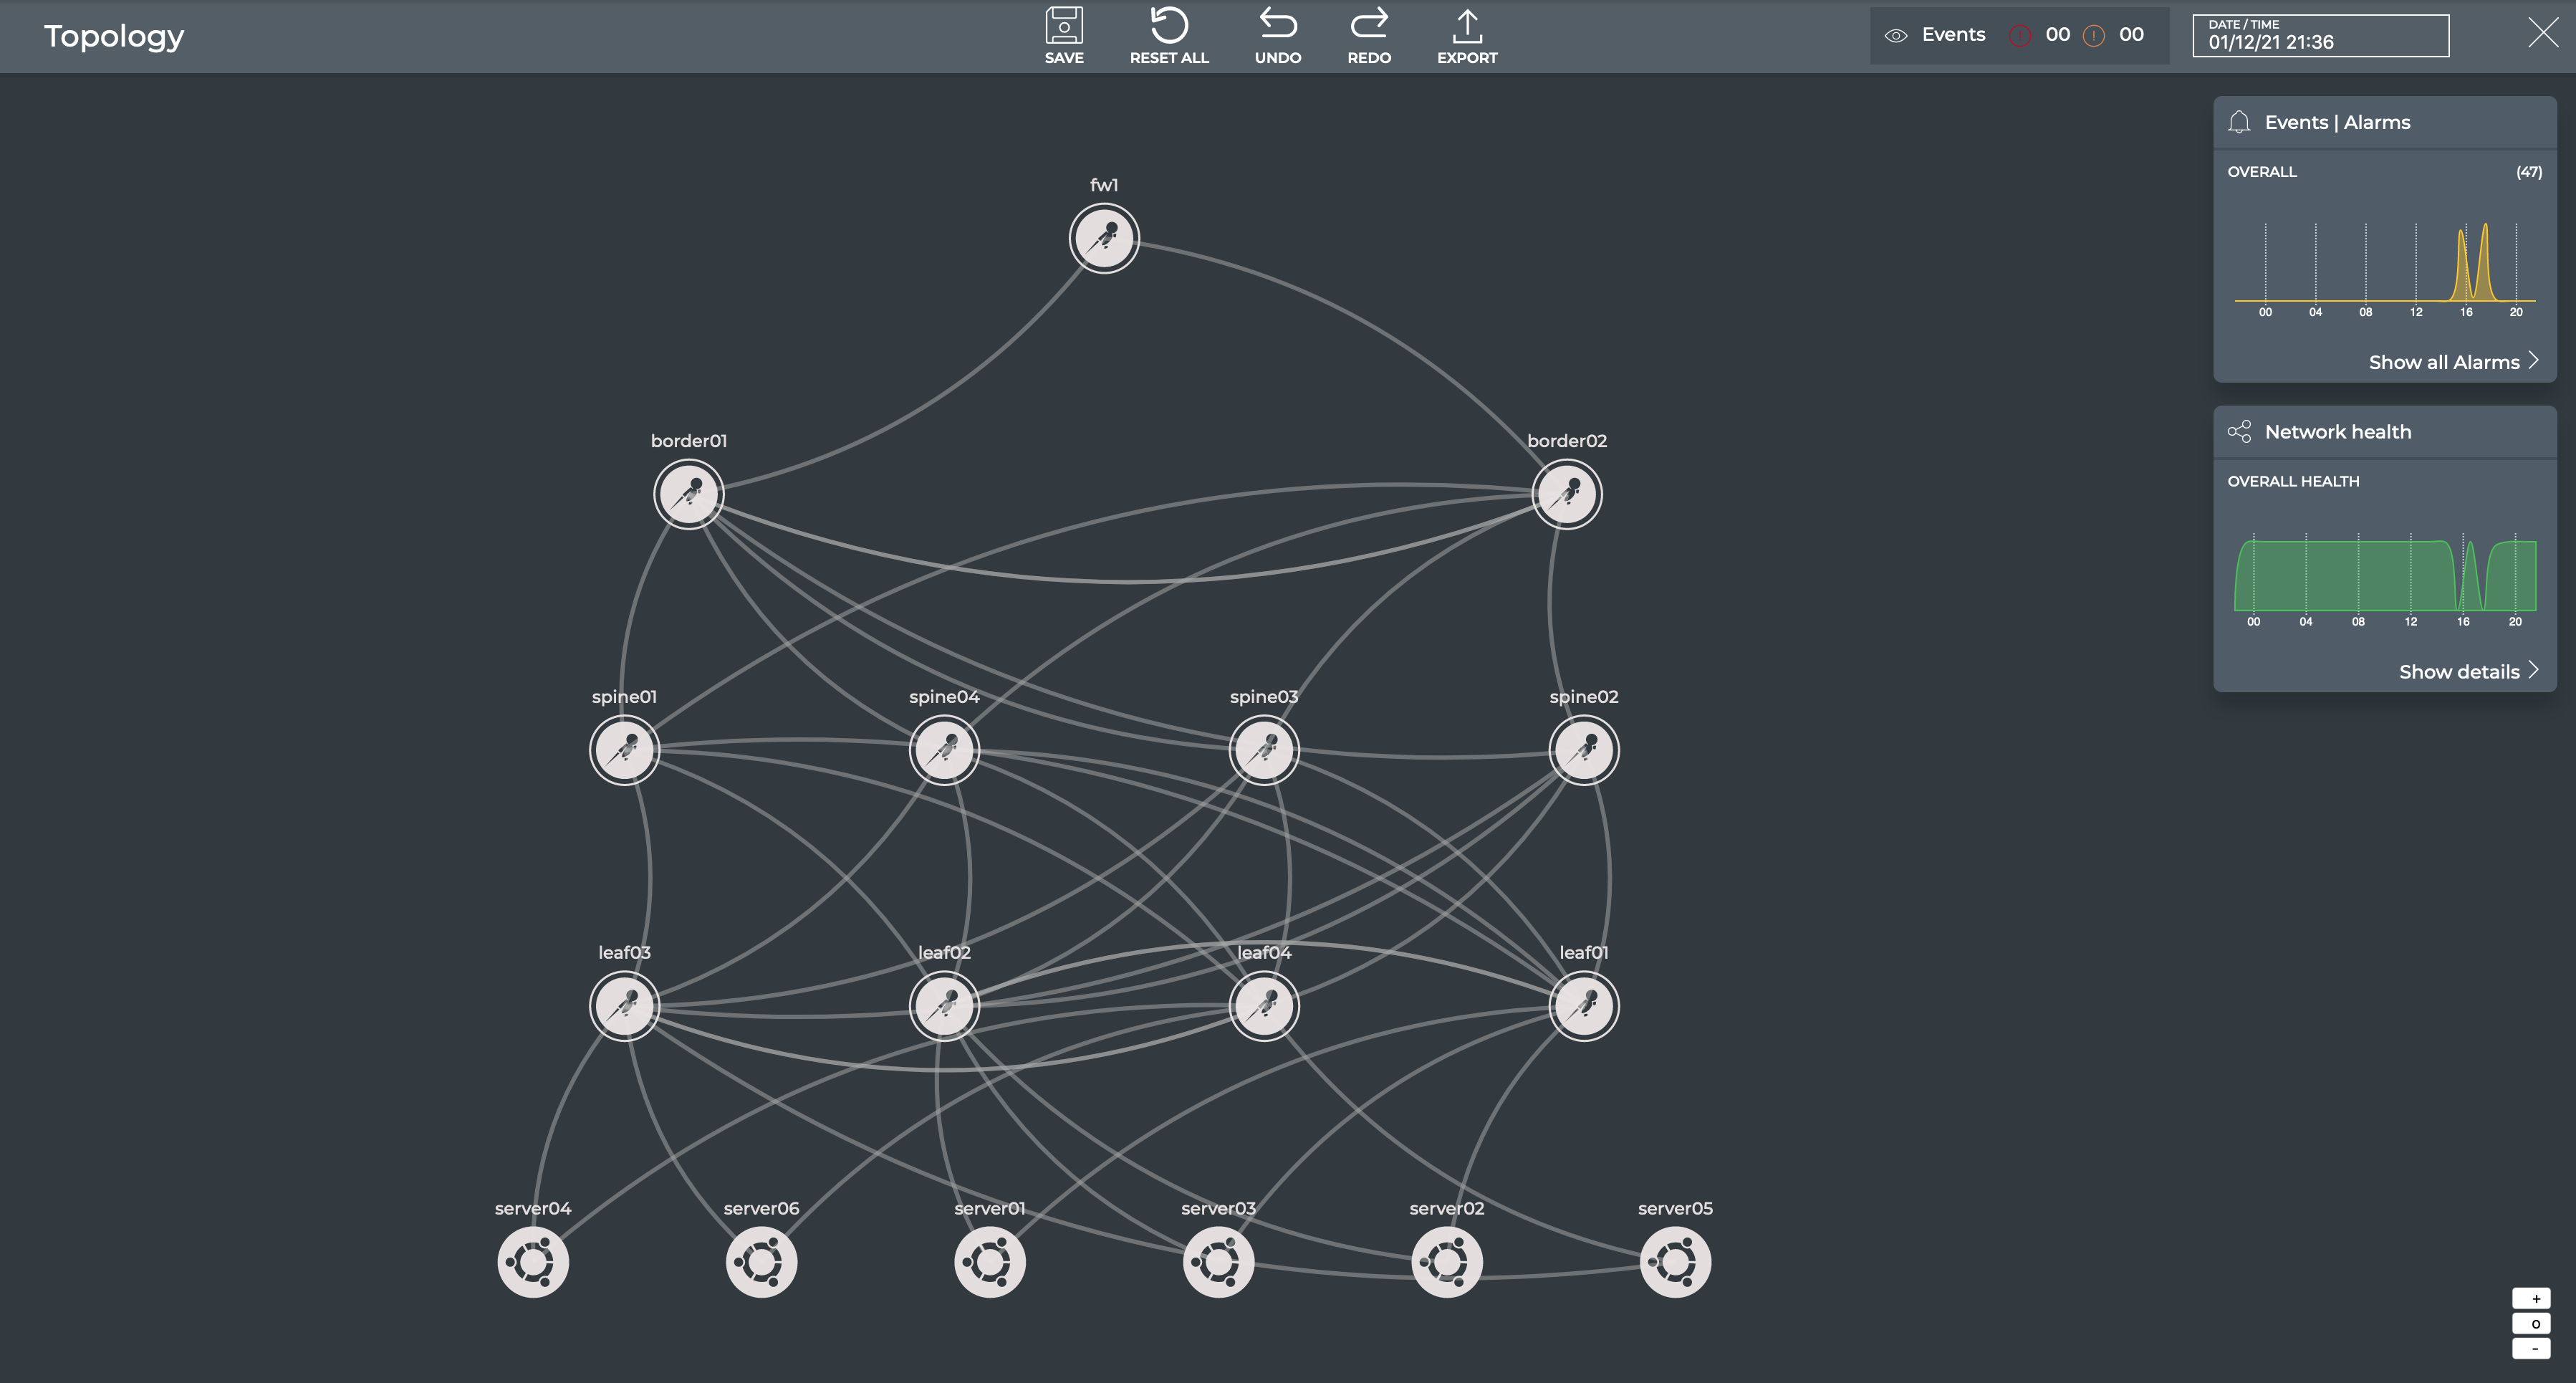
Click
 the Save icon.