NetQ UI Card Reference
This reference describes the cards available with the NetQ 4.0 graphical user interface (NetQ UI), including each item and field on the four sizes of cards. You can open cards using one of two methods:
- Search for the card by name in the Global Search field in the application header
- Click
 . Select a card category or scroll down. Click the desired card. Click Open Cards.
Cards opened on the default NetQ Workbench are not saved. Create a new workbench and open cards there to save and view the cards at a later time.
Cards are listed in alphabetical order by name.
Event Cards
The event cards appear on the default NetQ Workbench. You can also add them to user-created workbenches.
Events|Alarms Card
You can easily monitor critical events occurring across your network using the Alarms card. You can determine the number of events for the various system, interface, and network protocols and services components in the network.
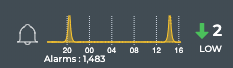
The small Alarms card displays:
| Item | Description |
|---|---|
| Indicates data is for all critical severity events in the network. | |
| Alarm trend | Trend of alarm count, represented by an arrow:
|
| Alarm score | Current count of alarms during the designated time period. |
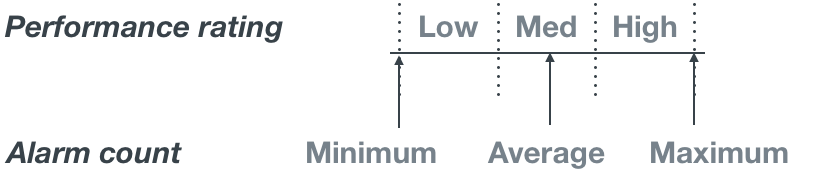
| Alarm rating | Count of alarms relative to the average count of alarms during the designated time period:
 |
| Chart | Distribution alarms received during the designated time period and a total count of all alarms present in the system. |
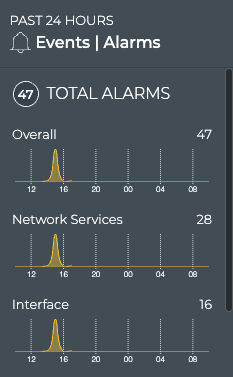
The medium Alarms card displays:
| Item | Description |
|---|---|
| Time period | Range of time in which the displayed data was collected; applies to all card sizes. |
| Indicates data is for all critical events in the network. | |
| Count | Total number of alarms received during the designated time period. |
| Alarm score | Current count of alarms received from each category (overall, system, interface, and network services) during the designated time period. |
| Chart | Distribution of all alarms received from each category during the designated time period. |
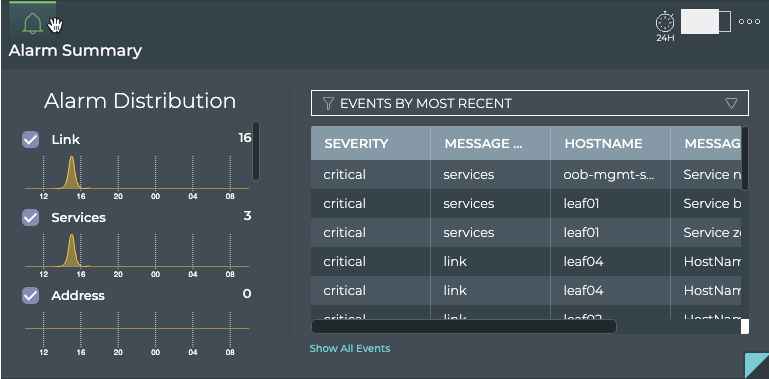
The large Alarms card has one tab.
The Alarm Summary tab displays:
| Item | Description |
|---|---|
| Time period | Range of time in which the displayed data was collected; applies to all card sizes. |
| Indicates data is for all system, trace and interface critical events in the network. | |
| Alarm Distribution | Chart: Distribution of all alarms received from each category during the designated time period:
Count: Total number of alarms received from each category during the designated time period. |
| Table | Listing of items that match the filter selection for the selected alarm categories:
|
| Show All Events | Opens full screen Events | Alarms card with a listing of all events. |
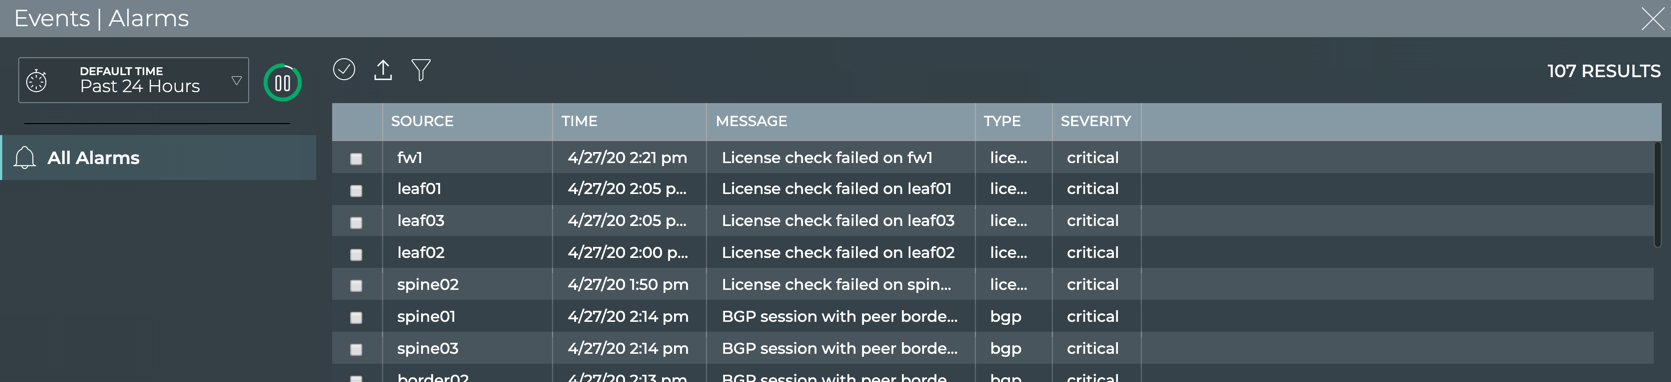
The full screen Alarms card provides tabs for all events.
| Item | Description |
|---|---|
| Title | Events | Alarms |
| Closes full screen card and returns to workbench. | |
| Default Time | Range of time in which the displayed data was collected. |
| Displays data refresh status. Click | |
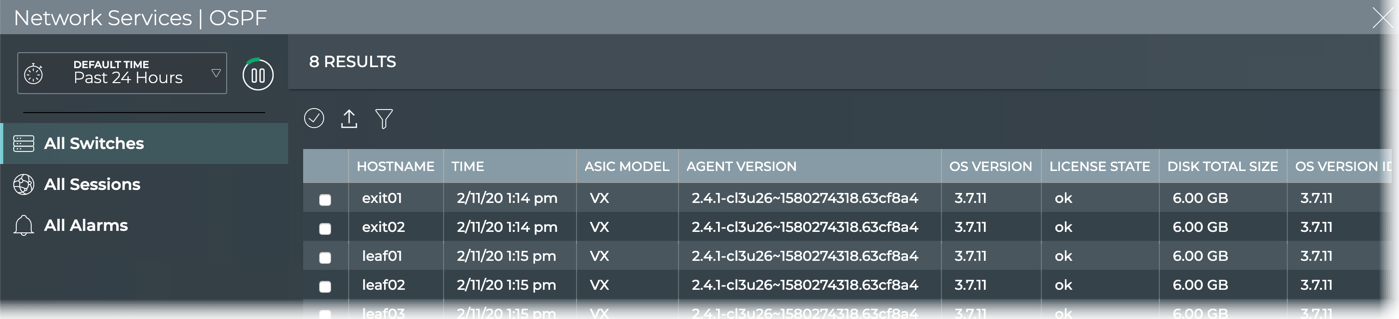
| Results | Number of results found for the selected tab. |
| All Alarms | Displays all alarms received in the time period. By default, the requests list sorts by the date and time that the event occurred (Time). This tab provides the following additional data about each request:
|
| Table Actions | Select, export, or filter the list. Refer to Table Settings. |
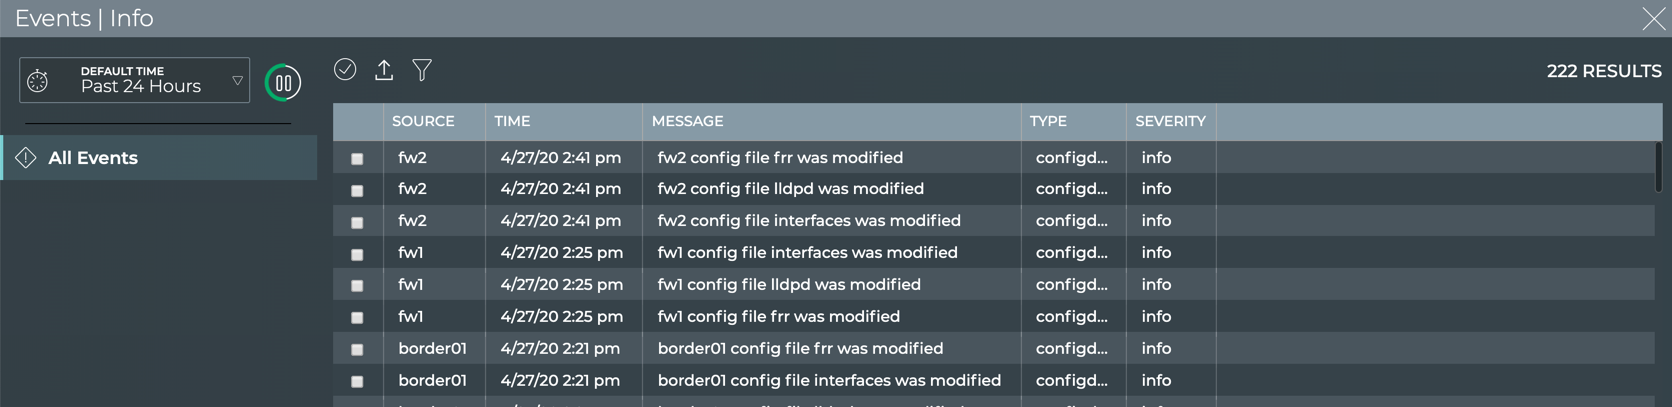
Events|Info Card
You can easily monitor warning, info, and debug severity events occurring across your network using the Info card. You can determine the number of events for the various system, interface, and network protocols and services components in the network.
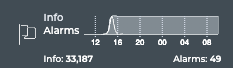
The small Info card displays:
| Item | Description |
|---|---|
| Indicates data is for all warning, info, and debug severity events in the network | |
| Info count | Number of info events received during the designated time period |
| Alarm count | Number of alarm events received during the designated time period |
| Chart | Distribution of all info events and alarms received during the designated time period |
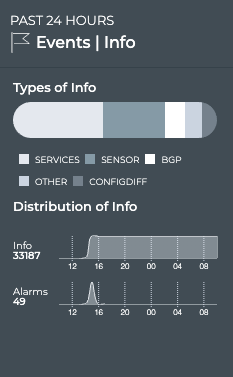
The medium Info card displays:
| Item | Description |
|---|---|
| Time period | Range of time in which the displayed data was collected; applies to all card sizes. |
| Indicates data is for all warning, info, and debug severity events in the network. | |
| Types of Info | Chart which displays the services that have triggered events during the designated time period. Hover over chart to view a count for each type. |
| Distribution of Info | Info Status
|
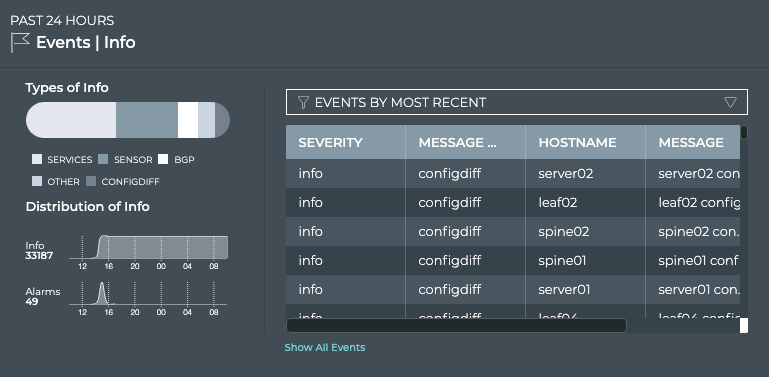
The large Info card displays:
| Item | Description |
|---|---|
| Time period | Range of time in which the displayed data was collected; applies to all card sizes. |
| Indicates data is for all warning, info, and debug severity events in the network. | |
| Types of Info | Chart which displays the services that have triggered events during the designated time period. Hover over chart to view a count for each type. |
| Distribution of Info | Info Status
|
| Table | Listing of items that match the filter selection:
|
| Show All Events | Opens full screen Events | Info card with a listing of all events. |
The full screen Info card provides tabs for all events.
| Item | Description |
|---|---|
| Title | Events | Info |
| Closes full screen card and returns to workbench. | |
| Default Time | Range of time in which the displayed data was collected. |
| Displays data refresh status. Click | |
| Results | Number of results found for the selected tab. |
| All Events | Displays all events (both alarms and info) received in the time period. By default, the requests list is sorted by the date and time that the event occurred (Time). This tab provides the following additional data about each request:
| Table Actions | Select, export, or filter the list. Refer to Table Settings. |
Inventory Cards
The inventory cards are located on the default NetQ Workbench. They can also be added to user-created workbenches.
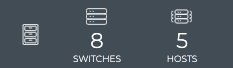
Inventory|Devices Card
The small Devices Inventory card displays:
| Item | Description |
|---|---|
| Indicates data is for device inventory | |
| Total number of switches in inventory during the designated time period | |
| Total number of hosts in inventory during the designated time period |
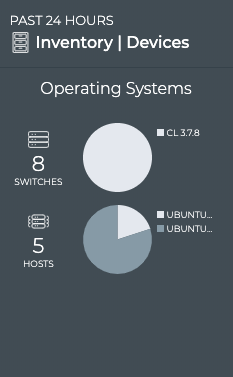
The medium Devices Inventory card displays:
| Item | Description |
|---|---|
| Indicates data is for device inventory | |
| Title | Inventory | Devices |
| Total number of switches in inventory during the designated time period | |
| Total number of hosts in inventory during the designated time period | |
| Charts | Distribution of operating systems deployed on switches and hosts, respectively |
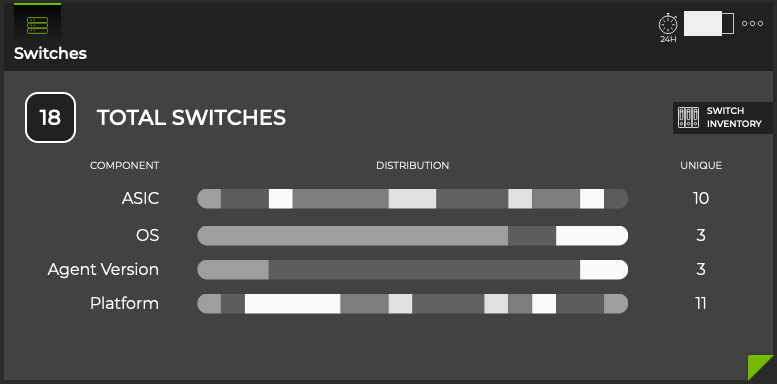
The large Devices Inventory card has one tab.
The Switches tab displays:
| Item | Description |
|---|---|
| Time period | Always Now for inventory by default. |
| Indicates data is for device inventory. | |
| Title | Inventory | Devices. |
| Total number of switches in inventory during the designated time period. | |
| Link to full screen listing of all switches. | |
| Component | Switch components monitored-ASIC, Operating System (OS), NetQ Agent version, and Platform. |
| Distribution charts | Distribution of switch components across the network. |
| Unique | Number of unique items of each component type. For example, for OS, you might have Cumulus Linux 3.7.15, 4.3 and SONiC 202012, giving you a unique count of 3. |
The full screen Devices Inventory card provides tabs for all switches and all hosts.
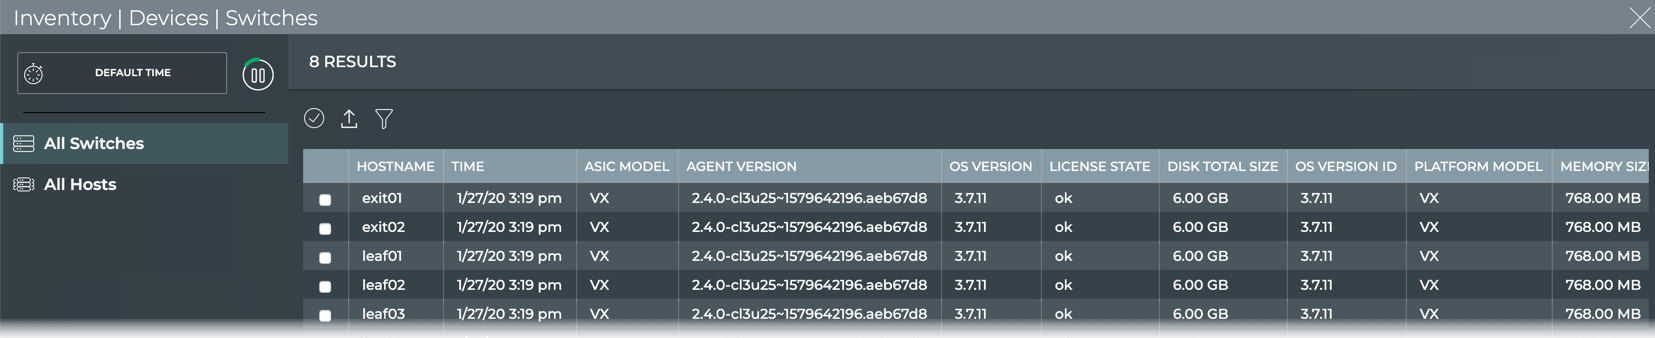
| Item | Description |
|---|---|
| Title | Inventory | Devices | Switches. |
| Closes full screen card and returns to workbench. | |
| Time period | Time period does not apply to the Inventory cards. This is always Default Time. | Displays data refresh status. Click |
| Results | Number of results found for the selected tab. |
| All Switches and All Hosts tabs | Displays all monitored switches and hosts in your network. By default, the device list is sorted by hostname. These tabs provide the following additional data about each device:
| Table Actions | Select, export, or filter the list. Refer to Table Settings. |
Inventory|Switch Card
Knowing what components are included on all of your switches aids in upgrade, compliance, and other planning tasks. Viewing this data is accomplished through the Switch Inventory card.
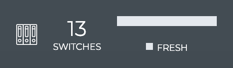
The small Switch Inventory card displays:
| Item | Description |
|---|---|
| Indicates data is for switch inventory | |
| Count | Total number of switches in the network inventory |
| Chart | Distribution of overall health status during the designated time period; fresh versus rotten |
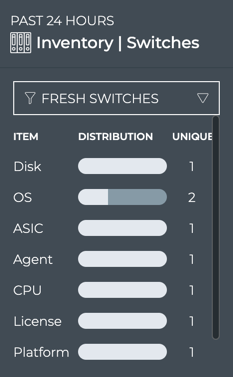
The medium Switch Inventory card displays:
| Item | Description |
|---|---|
| Indicates data is for switch inventory. | |
| Filter | View fresh switches (those you have heard from recently) or rotten switches (those you have not heard from recently) on this card. |
| Chart | Distribution of switch components (disk size, OS, ASIC, NetQ Agents, CPU, platform, and memory size) during the designated time period. Hover over chart segment to view versions of each component. Note: You should only have one version of NetQ Agent running and it should match the NetQ Platform release number. If you have more than one, you likely need to upgrade the older agents. |
| Unique | Number of unique versions of the various switch components. For example, for OS, you might have CL 3.7.1 and CL 3.7.4 making the unique value two. |
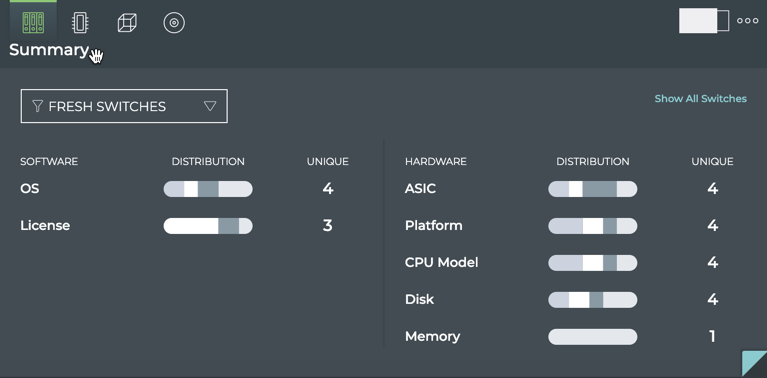
The large Switch Inventory card contains four tabs.
The Summary tab displays:
| Item | Description |
|---|---|
| Indicates data is for switch inventory. | |
| Filter | View fresh switches (those you have heard from recently) or rotten switches (those you have not heard from recently) on this card. |
| Charts | Distribution of switch components (disk size, OS, ASIC, NetQ Agents, CPU, platform, and memory size), divided into software and hardware, during the designated time period. Hover over chart segment to view versions of each component. Note: You should only have one version of NetQ Agent running and it should match the NetQ Platform release number. If you have more than one, you likely need to upgrade the older agents. |
| Unique | Number of unique versions of the various switch components. For example, for OS, you might have CL 3.7.6 and CL 3.7.4 making the unique value two. |
The ASIC tab displays:
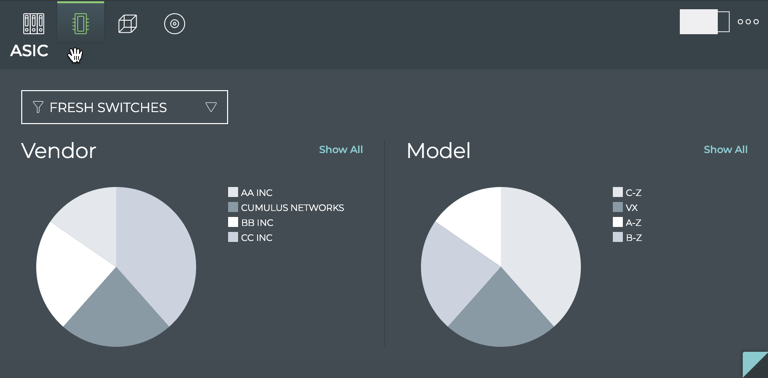
| Item | Description |
|---|---|
| Indicates data is for ASIC information. | |
| Filter | View fresh switches (those you have heard from recently) or rotten switches (those you have not heard from recently) on this card. |
| Vendor chart | Distribution of ASIC vendors. Hover over chart segment to view the number of switches with each version. |
| Model chart | Distribution of ASIC models. Hover over chart segment to view the number of switches with each version. |
| Show All | Opens full screen card displaying all components for all switches. |
The Platform tab displays:
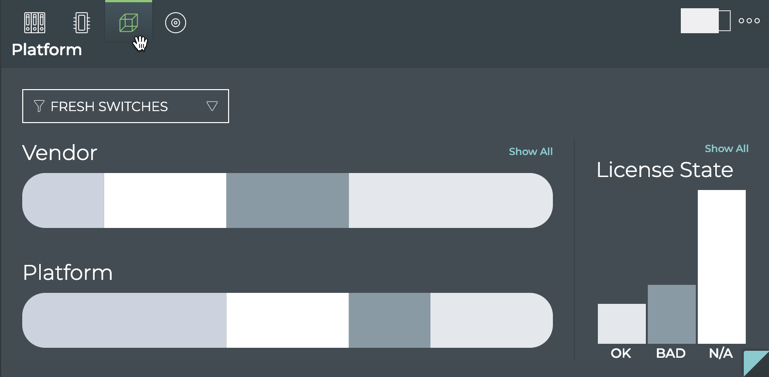
| Item | Description |
|---|---|
| Indicates data is for platform information. | |
| Filter | View fresh switches (those you have heard from recently) or rotten switches (those you have not heard from recently) on this card. |
| Vendor chart | Distribution of platform vendors. Hover over chart segment to view the number of switches with each vendor. |
| Platform chart | Distribution of platform models. Hover over chart segment to view the number of switches with each model. |
| Show All | Opens full screen card displaying all components for all switches. |
The Software tab displays:
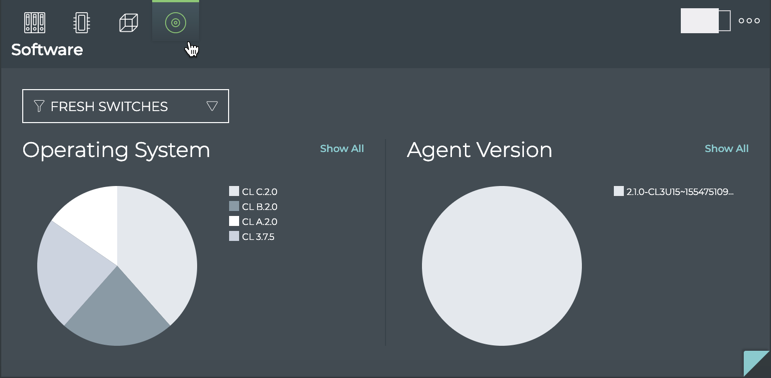
| Item | Description |
|---|---|
| Indicates data is for software information. | |
| Filter | View fresh switches (those you have heard from recently) or rotten switches (those you have not heard from recently) on this card. |
| Operating System chart | Distribution of OS versions. Hover over chart segment to view the number of switches with each version. |
| Agent Version chart | Distribution of NetQ Agent versions. Hover over chart segment to view the number of switches with each version. Note: You should only have one version of NetQ Agent running and it should match the NetQ Platform release number. If you have more than one, you likely need to upgrade the older agents. |
| Show All | Opens full screen card displaying all components for all switches. |
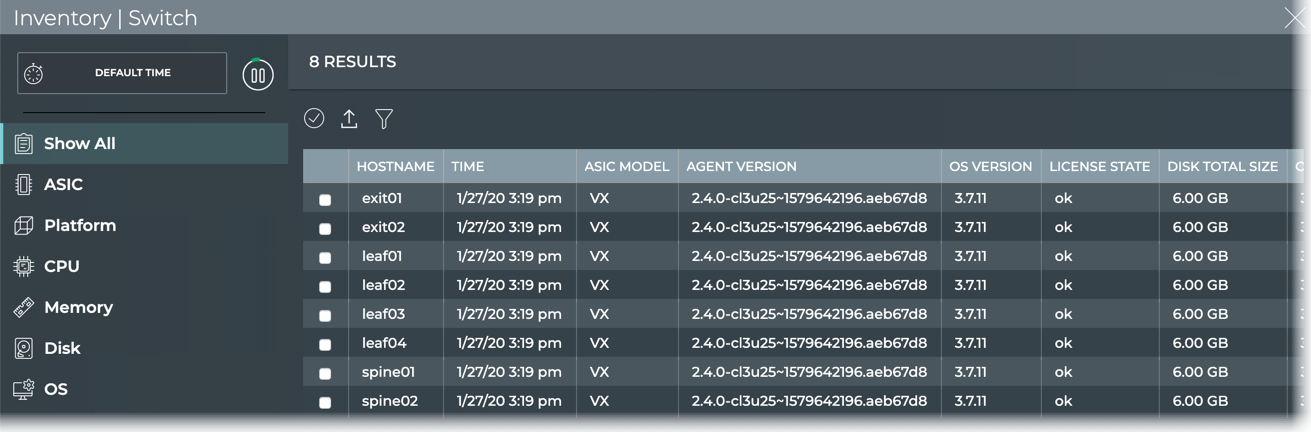
The full screen Switch Inventory card provides tabs for all components, ASIC, platform, CPU, memory, disk, and OS components.
Network Health Card
As with any network, one of the challenges is keeping track of all of the moving parts. With the NetQ GUI, you can view the overall health of your network at a glance and then delve deeper for periodic checks or as conditions arise that require attention. For a general understanding of how well your network is operating, the Network Health card workflow is the best place to start as it contains the highest view and performance roll-ups.
The Network Health card is located on the default NetQ Workbench. It can also be added to user-created workbenches.
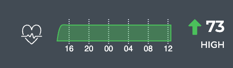
The small Network Health card displays:
| Item | Description |
|---|---|
| Indicates data is for overall Network Health | |
| Health trend | Trend of overall network health, represented by an arrow:
The data collection window varies based on the time period of the card. For a 24 hour time period (default), the window is one hour. This gives you current, hourly, updates about your network health. |
| Health score | Average of health scores for system health, network services health, and interface health during the last data collection window. The health score for each category is calculated as the percentage of items which passed validations versus the number of items checked. The collection window varies based on the time period of the card. For a 24 hour time period (default), the window is one hour. This gives you current, hourly, updates about your network health. |
| Health rating | Performance rating based on the health score during the time window:
|
| Chart | Distribution of overall health status during the designated time period |
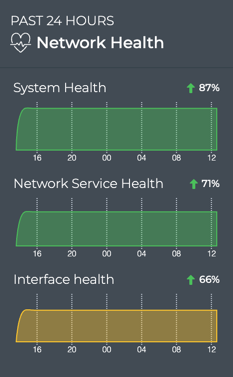
The medium Network Health card displays the distribution, score, and trend of the:
| Item | Description |
|---|---|
| Time period | Range of time in which the displayed data was collected; applies to all card sizes. |
| Indicates data is for overall Network Health. | |
| Health trend | Trend of system, network service, and interface health, represented by an arrow:
The data collection window varies based on the time period of the card. For a 24 hour time period (default), the window is one hour. This gives you current, hourly, updates about your network health. |
| Health score | Percentage of devices which passed validation versus the number of devices checked during the time window for:
The data collection window varies based on the time period of the card. For a 24 hour time period (default), the window is one hour. This gives you current, hourly, updates about your network health. |
| Chart | Distribution of overall health status during the designated time period. |
The large Network Health card contains three tabs.
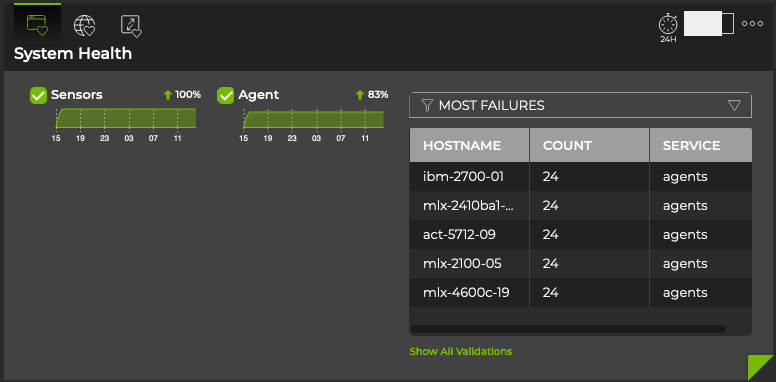
The System Health tab displays:
| Item | Description |
|---|---|
| Time period | Range of time in which the displayed data was collected; applies to all card sizes. |
| Indicates data is for System Health. | |
| Health trend | Trend of NetQ Agents and sensor health, represented by an arrow:
The data collection window varies based on the time period of the card. For a 24 hour time period (default), the window is one hour. This gives you current, hourly, updates about your network health. |
| Health score | Percentage of devices which passed validation versus the number of devices checked during the time window for NetQ Agents and platform sensors. The data collection window varies based on the time period of the card. For a 24 hour time period (default), the window is one hour. This gives you current, hourly, updates about your network health. |
| Charts | Distribution of health score for NetQ Agents and platform sensors during the designated time period. |
| Table | Listing of items that match the filter selection:
|
| Show All Validations | Opens full screen Network Health card with a listing of validations performed by network service and protocol. |
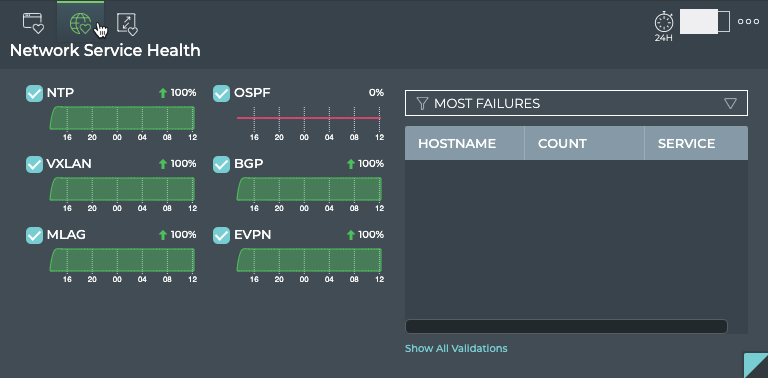
The Network Service Health tab displays:
| Item | Description |
|---|---|
| Time period | Range of time in which the displayed data was collected; applies to all card sizes. |
| Indicates data is for Network Protocols and Services Health. | |
| Health trend | Trend of BGP, CLAG, EVPN, NTP, OSPF, and VXLAN services health, represented by an arrow:
The data collection window varies based on the time period of the card. For a 24 hour time period (default), the window is one hour. This gives you current, hourly, updates about your network health. |
| Health score | Percentage of devices which passed validation versus the number of devices checked during the time window for BGP, CLAG, EVPN, NTP, and VXLAN protocols and services. The data collection window varies based on the time period of the card. For a 24 hour time period (default), the window is one hour. This gives you current, hourly, updates about your network health. |
| Charts | Distribution of passing validations for BGP, CLAG, EVPN, NTP, and VXLAN services during the designated time period. |
| Table | Listing of devices that match the filter selection:
|
| Show All Validations | Opens full screen Network Health card with a listing of validations performed by network service and protocol. |
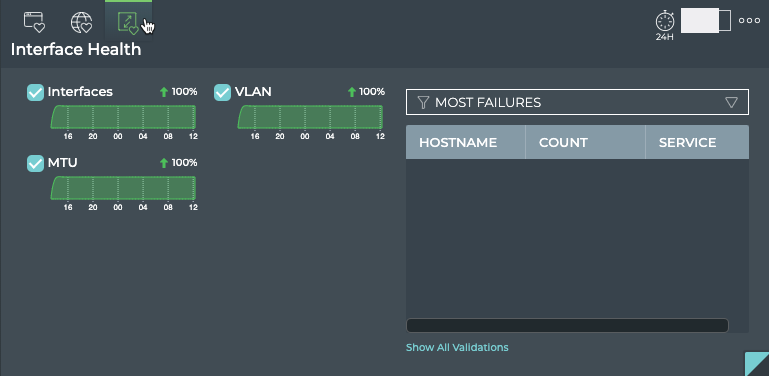
The Interface Health tab displays:
| Item | Description |
|---|---|
| Time period | Range of time in which the displayed data was collected; applies to all card sizes. |
| Indicates data is for Interface Health. | |
| Health trend | Trend of interfaces, VLAN, and MTU health, represented by an arrow:
The data collection window varies based on the time period of the card. For a 24 hour time period (default), the window is one hour. This gives you current, hourly, updates about your network health. |
| Health score | Percentage of devices which passed validation versus the number of devices checked during the time window for interfaces, VLAN, and MTU protocols and ports. The data collection window varies based on the time period of the card. For a 24 hour time period (default), the window is one hour. This gives you current, hourly, updates about your network health. |
| Charts | Distribution of passing validations for interfaces, VLAN, and MTU protocols and ports during the designated time period. |
| Table | Listing of devices that match the filter selection:
|
| Show All Validations | Opens full screen Network Health card with a listing of validations performed by network service and protocol. |
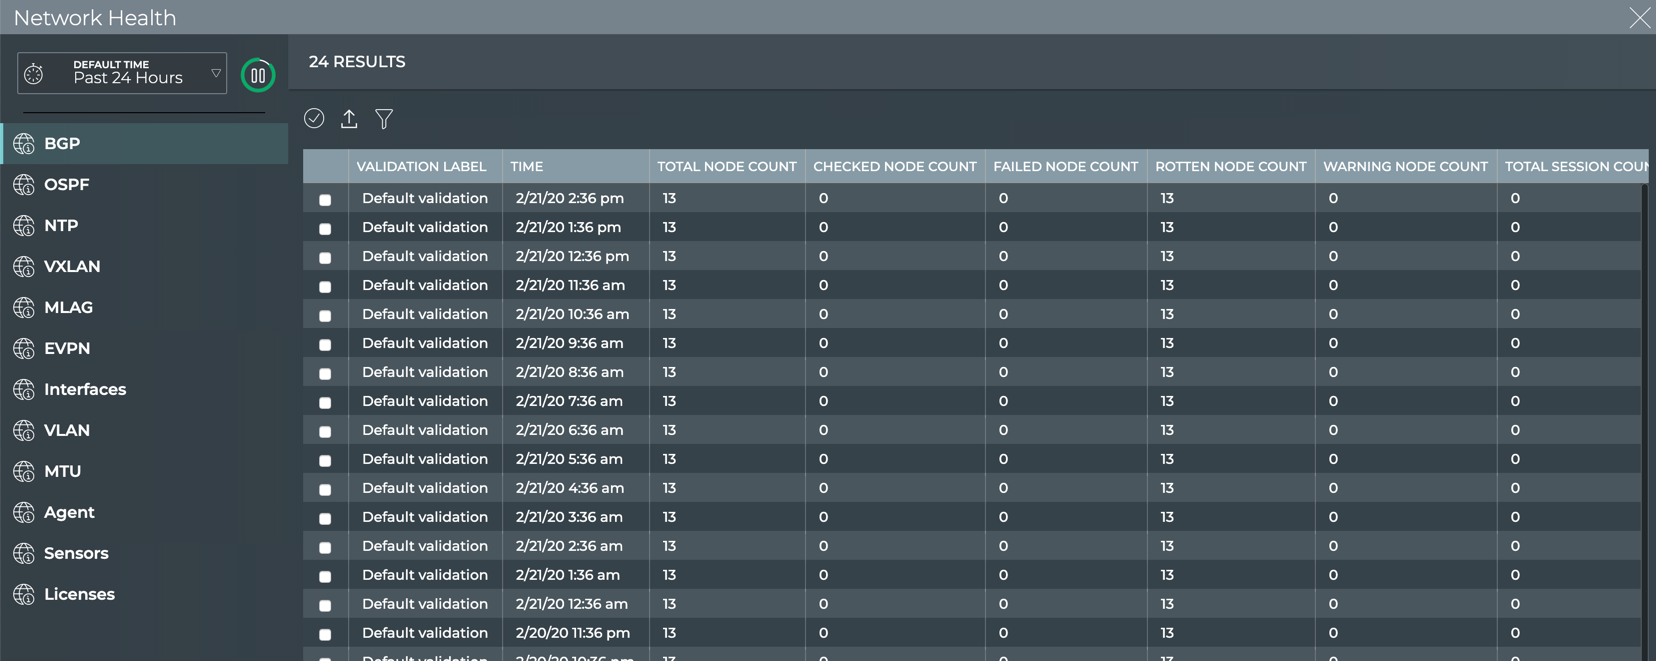
The full screen Network Health card displays all events in the network.
| Item | Description |
|---|---|
| Title | Network Health. |
| Closes full screen card and returns to workbench. | |
| Default Time | Range of time in which the displayed data was collected. |
| Displays data refresh status. Click | |
| Results | Number of results found for the selected tab. |
| Network protocol or service tab | Displays results of that network protocol or service validations that occurred during the designated time period. By default, the requests list is sorted by the date and time that the validation was completed (Time). This tab provides the following additional data about all protocols and services:
The following protocols and services have additional data:
|
| Table Actions | Select, export, or filter the list. Refer to Table Settings. |
Network Services Cards
There are two cards for each of the supported network protocols and services—one for the service as a whole and one for a given session. The network services cards can be added to user-created workbenches.
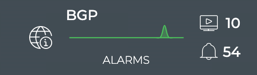
ALL BGP Sessions Card
This card displays performance and status information for all BGP sessions across all nodes in your network.
The small BGP Service card displays:
| Item | Description |
|---|---|
| Indicates data is for all sessions of a Network Service or Protocol | |
| Title | BGP: All BGP Sessions, or the BGP Service |
| Total number of switches and hosts with the BGP service enabled during the designated time period | |
| Total number of BGP-related alarms received during the designated time period | |
| Chart | Distribution of new BGP-related alarms received during the designated time period |
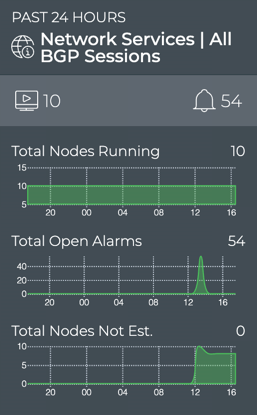
The medium BGP Service card displays:
| Item | Description |
|---|---|
| Time period | Range of time in which the displayed data was collected; applies to all card sizes. |
| Indicates data is for all sessions of a Network Service or Protocol. | |
| Title | Network Services | All BGP Sessions |
| Total number of switches and hosts with the BGP service enabled during the designated time period. | |
| Total number of BGP-related alarms received during the designated time period. | |
| Total Nodes Running chart | Distribution of switches and hosts with the BGP service enabled during the designated time period, and a total number of nodes running the service currently. Note: The node count here might be different than the count in the summary bar. For example, the number of nodes running BGP last week or last month might be more or less than the number of nodes running BGP currently. |
| Total Open Alarms chart | Distribution of BGP-related alarms received during the designated time period, and the total number of current BGP-related alarms in the network. Note: The alarm count here might be different than the count in the summary bar. For example, the number of new alarms received in this time period does not take into account alarms that have already been received and are still active. You might have no new alarms, but still have a total number of alarms present on the network of 10. |
| Total Nodes Not Est. chart | Distribution of switches and hosts with unestablished BGP sessions during the designated time period, and the total number of unestablished sessions in the network currently. Note: The node count here might be different than the count in the summary bar. For example, the number of unestablished session last week or last month might be more of less than the number of nodes with unestablished sessions currently. |
The large BGP service card contains two tabs.
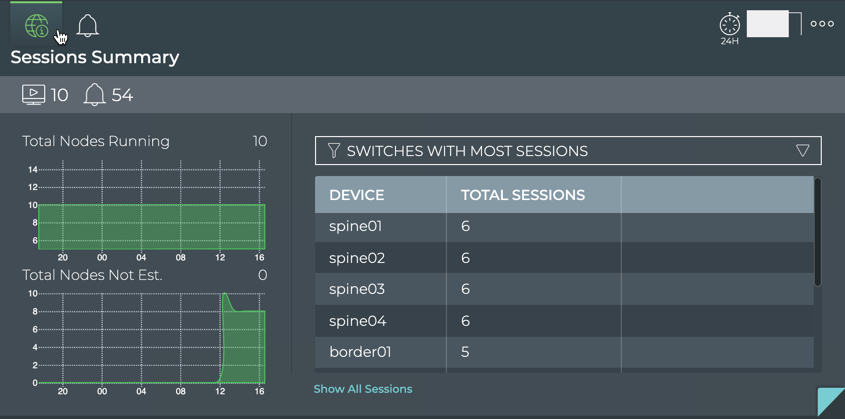
The Sessions Summary tab displays:
| Item | Description |
|---|---|
| Time period | Range of time in which the displayed data was collected; applies to all card sizes. |
| Indicates data is for all sessions of a Network Service or Protocol. | |
| Title | Sessions Summary (visible when you hover over card). |
| Total number of switches and hosts with the BGP service enabled during the designated time period. | |
| Total number of BGP-related alarms received during the designated time period. | |
| Total Nodes Running chart | Distribution of switches and hosts with the BGP service enabled during the designated time period, and a total number of nodes running the service currently. Note: The node count here might be different than the count in the summary bar. For example, the number of nodes running BGP last week or last month might be more or less than the number of nodes running BGP currently. |
| Total Nodes Not Est. chart | Distribution of switches and hosts with unestablished BGP sessions during the designated time period, and the total number of unestablished sessions in the network currently. Note: The node count here might be different than the count in the summary bar. For example, the number of unestablished session last week or last month might be more of less than the number of nodes with unestablished sessions currently. |
| Table/Filter options | When the Switches with Most Sessions filter option is selected, the table displays the switches and hosts running BGP sessions in decreasing order of session count-devices with the largest number of sessions are listed first. When the Switches with Most Unestablished Sessions filter option is selected, the table switches and hosts running BGP sessions in decreasing order of unestablished sessions-devices with the largest number of unestablished sessions are listed first. |
| Show All Sessions | Link to view data for all BGP sessions in the full screen card. |
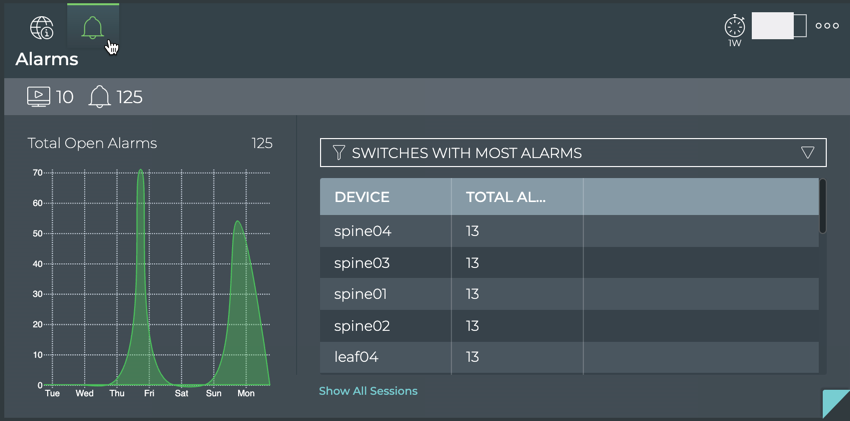
The Alarms tab displays:
| Item | Description |
|---|---|
| Time period | Range of time in which the displayed data was collected; applies to all card sizes. |
| Indicates data is for all alarms for all BGP sessions. | |
| Title | Alarms (visible when you hover over card). |
| Total number of switches and hosts with the BGP service enabled during the designated time period. | |
| Total number of BGP-related alarms received during the designated time period. | |
| Total Alarms chart | Distribution of BGP-related alarms received during the designated time period, and the total number of current BGP-related alarms in the network. Note: The alarm count here might be different than the count in the summary bar. For example, the number of new alarms received in this time period does not take into account alarms that have already been received and are still active. You might have no new alarms, but still have a total number of alarms present on the network of 10. |
| Table/Filter options | When the selected filter option is Switches with Most Alarms, the table displays switches and hosts running BGP in decreasing order of the count of alarms-devices with the largest number of BGP alarms are listed first. |
| Show All Sessions | Link to view data for all BGP sessions in the full screen card. |
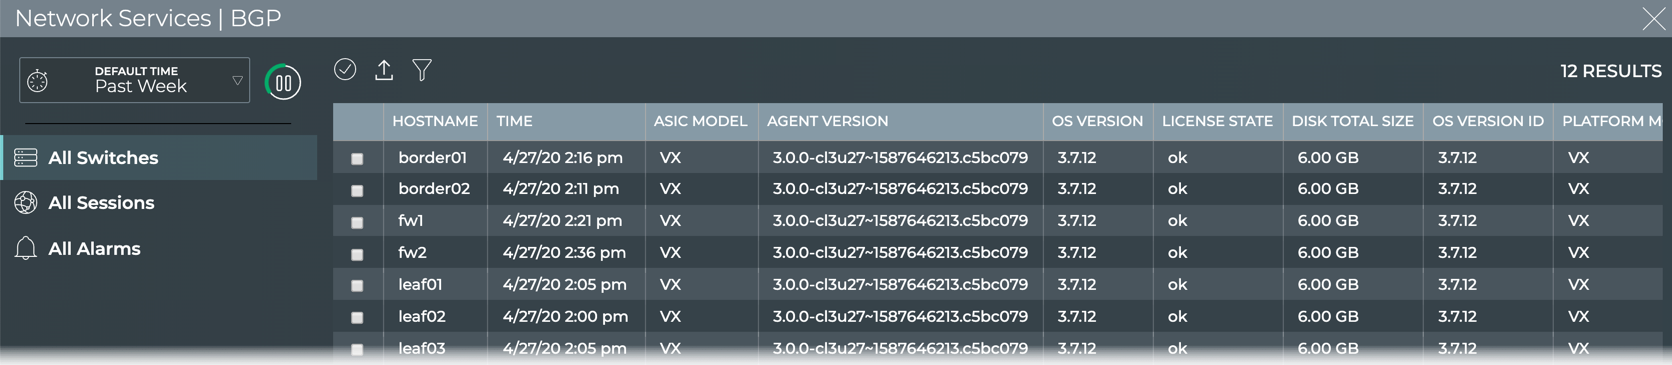
The full screen BGP Service card provides tabs for all switches, all sessions, and all alarms.
| Item | Description |
|---|---|
| Title | Network Services | BGP. |
| Closes full screen card and returns to workbench. | |
| Time period | Range of time in which the displayed data was collected; applies to all card sizes; select an alternate time period by clicking |
| Displays data refresh status. Click | |
| Results | Number of results found for the selected tab. |
| All Switches tab | Displays all switches and hosts running the BGP service. By default, the device list is sorted by hostname. This tab provides the following additional data about each device:
|
| All Sessions tab | Displays all BGP sessions networkwide. By default, the session list is sorted by hostname. This tab provides the following additional data about each session:
|
| All Alarms tab | Displays all BGP events networkwide. By default, the event list is sorted by time, with the most recent events listed first. The tab provides the following additional data about each event:
|
| Table Actions | Select, export, or filter the list. Refer to Table Settings. |
BGP Session Card
This card displays performance and status information for a single BGP session. Card is opened from the full-screen Network Services|All BGP Sessions card.
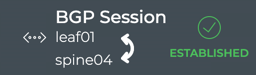
The small BGP Session card displays:
| Item | Description |
|---|---|
| Indicates data is for a single session of a Network Service or Protocol. | |
| Title | BGP Session. |
| Hostnames of the two devices in a session. Arrow points from the host to the peer. | |
| Current status of the session, either established or not established. |
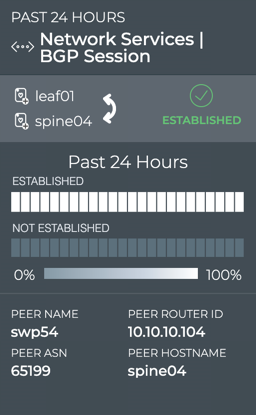
The medium BGP Session card displays:
| Item | Description |
|---|---|
| Time period | Range of time in which the displayed data was collected; applies to all card sizes. |
| Indicates data is for a single session of a Network Service or Protocol. | |
| Title | Network Services | BGP Session. |
| Hostnames of the two devices in a session. Arrow points in the direction of the session. | |
| Current status of the session, either established or not established. | |
| Time period for chart | Time period for the chart data. |
| Session State Changes Chart | Heat map of the state of the given session over the given time period. The status is sampled at a rate consistent with the time period. For example, for a 24 hour period, a status is collected every hour. Refer to Granularity of Data Shown Based on Time Period. |
| Peer Name | Interface name on or hostname for peer device. |
| Peer ASN | Autonomous System Number for peer device. |
| Peer Router ID | IP address of router with access to the peer device. |
| Peer Hostname | User-defined name for peer device. |
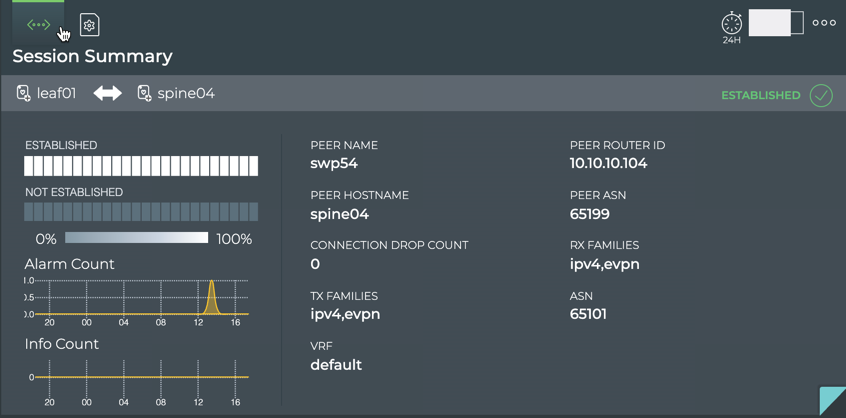
The large BGP Session card contains two tabs.
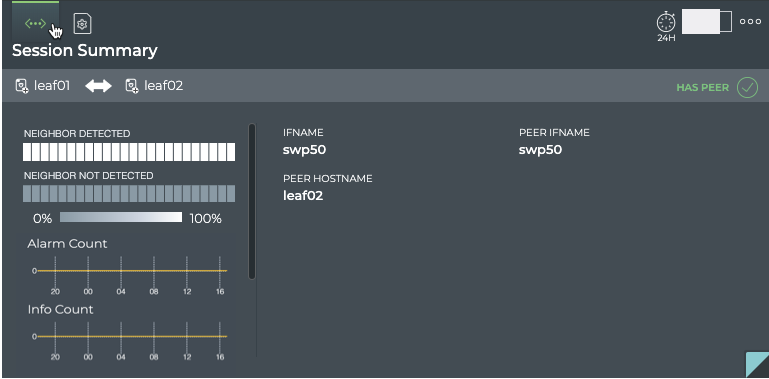
The Session Summary tab displays:
| Item | Description |
|---|---|
| Time period | Range of time in which the displayed data was collected; applies to all card sizes. |
| Indicates data is for a single session of a Network Service or Protocol. | |
| Title | Session Summary (Network Services | BGP Session). |
| Summary bar | Hostnames of the two devices in a session. Current status of the session-either established |
| Session State Changes Chart | Heat map of the state of the given session over the given time period. The status is sampled at a rate consistent with the time period. For example, for a 24 hour period, a status is collected every hour. Refer to Granularity of Data Shown Based on Time Period. |
| Alarm Count Chart | Distribution and count of BGP alarm events over the given time period. |
| Info Count Chart | Distribution and count of BGP info events over the given time period. |
| Connection Drop Count | Number of times the session entered the not established state during the time period. |
| ASN | Autonomous System Number for host device. |
| RX/TX Families | Receive and Transmit address types supported. Values include IPv4, IPv6, and EVPN. |
| Peer Hostname | User-defined name for peer device. |
| Peer Interface | Interface on which the session is connected. |
| Peer ASN | Autonomous System Number for peer device. |
| Peer Router ID | IP address of router with access to the peer device. |
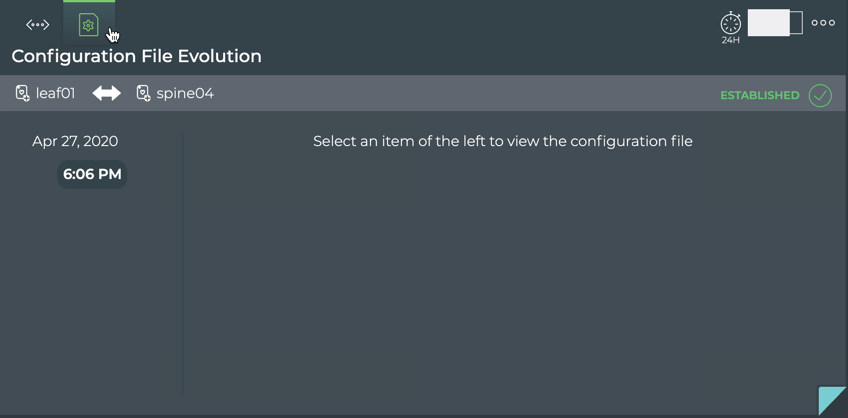
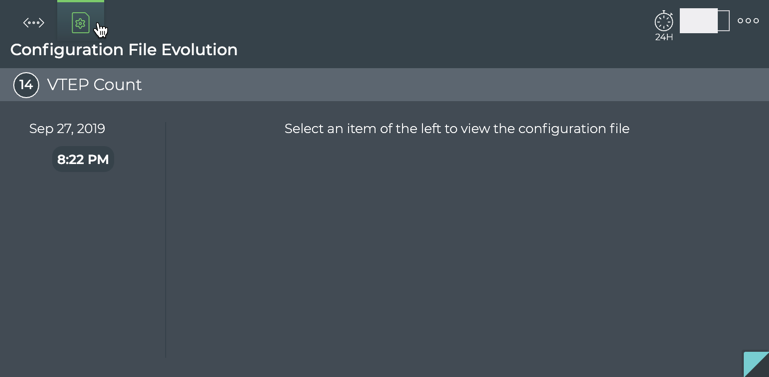
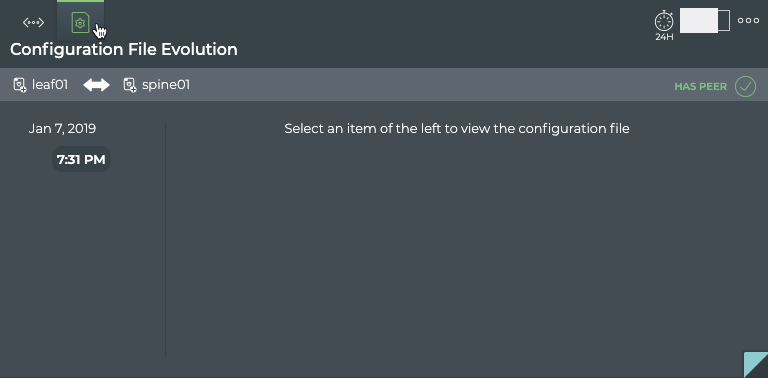
The Configuration File Evolution tab displays:
| Item | Description |
|---|---|
| Time period | Range of time in which the displayed data was collected; applies to all card sizes. |
| Indicates configuration file information for a single session of a Network Service or Protocol. | |
| Title | (Network Services | BGP Session) Configuration File Evolution. |
| Device identifiers (hostname, IP address, or MAC address) for host and peer in session. Click on | |
| Indication of host role, primary | |
| Timestamps | When changes to the configuration file have occurred, the date and time are indicated. Click the time to see the changed file. |
| Configuration File | When File is selected, the configuration file as it was at the selected time is shown. When Diff is selected, the configuration file at the selected time is shown on the left and the configuration file at the previous timestamp is shown on the right. Differences are highlighted. Note: If no configuration file changes have been made, only the original file date is shown. |
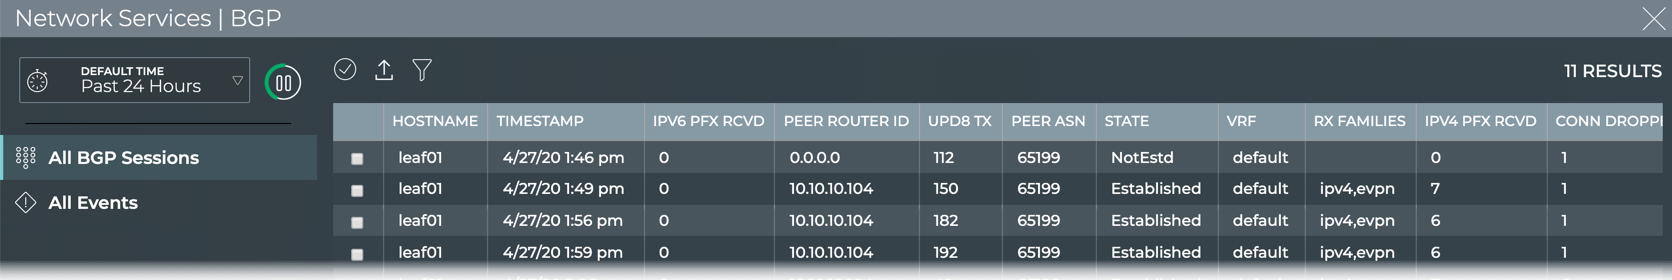
The full screen BGP Session card provides tabs for all BGP sessions and all events.
| Item | Description |
|---|---|
| Title | Network Services | BGP. |
| Closes full screen card and returns to workbench. | |
| Time period | Range of time in which the displayed data was collected; applies to all card sizes. |
| Displays data refresh status. Click | |
| Results | Number of results found for the selected tab. |
| All BGP Sessions tab | Displays all BGP sessions running on the host device. This tab provides the following additional data about each session:
|
| All Events tab | Displays all events networkwide. By default, the event list is sorted by time, with the most recent events listed first. The tab provides the following additional data about each event:
|
| Table Actions | Select, export, or filter the list. Refer to Table Settings. |
With NetQ, you can monitor the number of nodes running the EVPN service, view switches with the sessions, total number of VNIs, and alarms triggered by the EVPN service. For an overview and how to configure EVPN in your data center network, refer to Ethernet Virtual Private Network-EVPN.
All EVPN Sessions Card
This card displays performance and status information for all EVPN sessions across all nodes in your network.
The small EVPN Service card displays:
| Item | Description |
|---|---|
| Indicates data is for all sessions of a Network Service or Protocol | |
| Title | EVPN: All EVPN Sessions, or the EVPN Service |
| Total number of switches and hosts with the EVPN service enabled during the designated time period | |
| Total number of EVPN-related alarms received during the designated time period | |
| Chart | Distribution of EVPN-related alarms received during the designated time period |
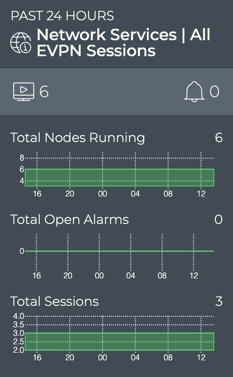
The medium EVPN Service card displays:
| Item | Description |
|---|---|
| Time period | Range of time in which the displayed data was collected; applies to all card sizes. |
| Indicates data is for all sessions of a Network Service or Protocol. | |
| Title | Network Services | All EVPN Sessions. |
| Total number of switches and hosts with the EVPN service enabled during the designated time period. | |
| Total number of EVPN-related alarms received during the designated time period. | |
| Total Nodes Running chart | Distribution of switches and hosts with the EVPN service enabled during the designated time period, and a total number of nodes running the service currently. Note: The node count here might be different than the count in the summary bar. For example, the number of nodes running EVPN last week or last month might be more or less than the number of nodes running EVPN currently. |
| Total Open Alarms chart | Distribution of EVPN-related alarms received during the designated time period, and the total number of current EVPN-related alarms in the network. Note: The alarm count here might be different than the count in the summary bar. For example, the number of new alarms received in this time period does not take into account alarms that have already been received and are still active. You might have no new alarms, but still have a total number of alarms present on the network of 10. |
| Total Sessions chart | Distribution of EVPN sessions during the designated time period, and the total number of sessions running on the network currently. |
The large EVPN service card contains two tabs.
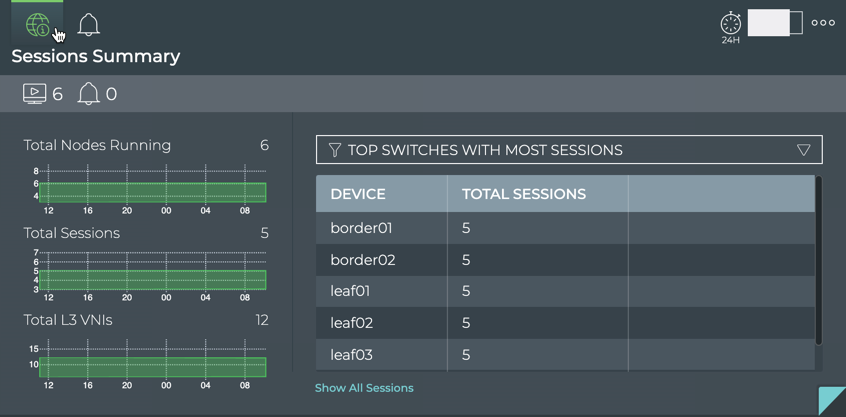
The Sessions Summary tab which displays:
| Item | Description |
|---|---|
| Time period | Range of time in which the displayed data was collected; applies to all card sizes. |
| Indicates data is for all sessions of a Network Service or Protocol. | |
| Title | Sessions Summary (visible when you hover over card). |
| Total number of switches and hosts with the EVPN service enabled during the designated time period. | |
| Total number of EVPN-related alarms received during the designated time period. | |
| Total Nodes Running chart | Distribution of switches and hosts with the EVPN service enabled during the designated time period, and a total number of nodes running the service currently. Note: The node count here might be different than the count in the summary bar. For example, the number of nodes running EVPN last week or last month might be more or less than the number of nodes running EVPN currently. |
| Total Sessions chart | Distribution of EVPN sessions during the designated time period, and the total number of sessions running on the network currently. |
| Total L3 VNIs chart | Distribution of layer 3 VXLAN Network Identifiers during this time period, and the total number of VNIs in the network currently. |
| Table/Filter options | When the Top Switches with Most Sessions filter is selected, the table displays devices running EVPN sessions in decreasing order of session count-devices with the largest number of sessions are listed first. When the Switches with Most L2 EVPN filter is selected, the table displays devices running layer 2 EVPN sessions in decreasing order of session count-devices with the largest number of sessions are listed first. When the Switches with Most L3 EVPN filter is selected, the table displays devices running layer 3 EVPN sessions in decreasing order of session count-devices with the largest number of sessions are listed first. |
| Show All Sessions | Link to view data for all EVPN sessions network-wide in the full screen card. |
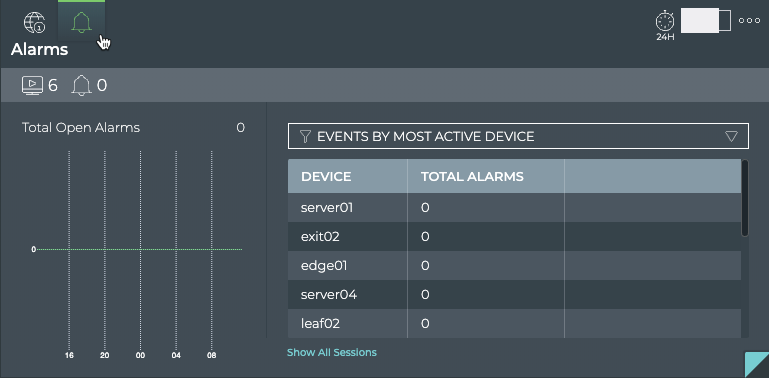
The Alarms tab which displays:
| Item | Description |
|---|---|
| Time period | Range of time in which the displayed data was collected; applies to all card sizes. |
| Indicates data is for all alarms for all sessions of a Network Service or Protocol. | |
| Title | Alarms (visible when you hover over card). |
| Total number of switches and hosts with the EVPN service enabled during the designated time period. | |
| Total number of EVPN-related alarms received during the designated time period. | |
| Total Alarms chart | Distribution of EVPN-related alarms received during the designated time period, and the total number of current BGP-related alarms in the network. Note: The alarm count here might be different than the count in the summary bar. For example, the number of new alarms received in this time period does not take into account alarms that have already been received and are still active. You might have no new alarms, but still have a total number of alarms present on the network of 10. |
| Table/Filter options | When the Events by Most Active Device filter is selected, the table displays devices running EVPN sessions in decreasing order of alarm count-devices with the largest number of alarms are listed first. |
| Show All Sessions | Link to view data for all EVPN sessions in the full screen card. |
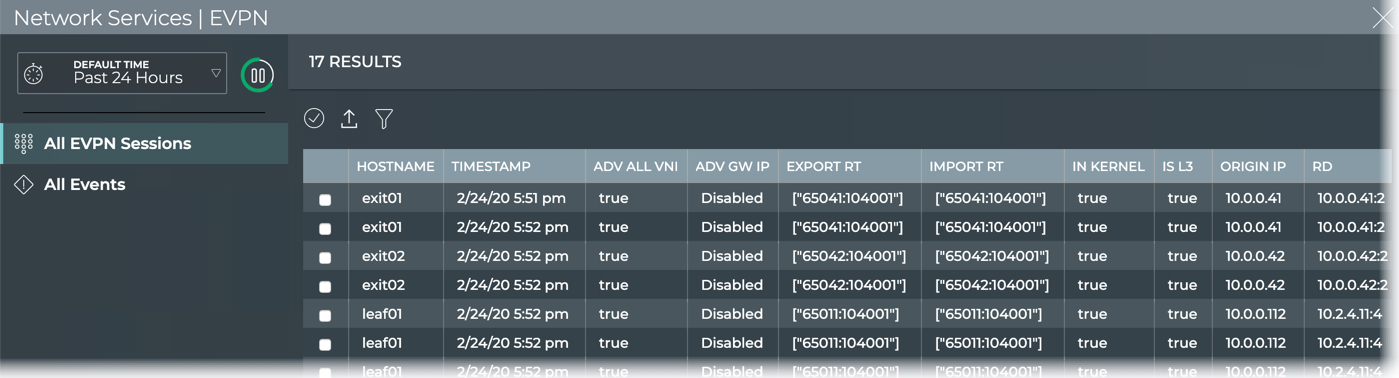
The full screen EVPN Service card provides tabs for all switches, all sessions, all alarms.
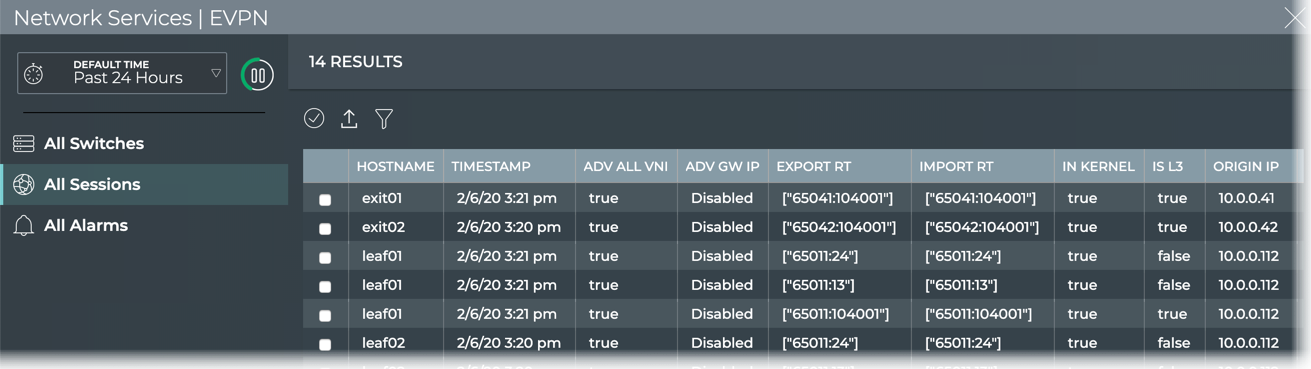
| Item | Description |
|---|---|
| Title | Network Services | EVPN |
| Closes full screen card and returns to workbench. | |
| Time period | Range of time in which the displayed data was collected; applies to all card sizes; select an alternate time period by clicking |
| Displays data refresh status. Click | |
| Results | Number of results found for the selected tab. |
| All Switches tab | Displays all switches and hosts running the EVPN service. By default, the device list is sorted by hostname. This tab provides the following additional data about each device:
|
| All Sessions tab | Displays all EVPN sessions network-wide. By default, the session list is sorted by hostname. This tab provides the following additional data about each session:
|
| All Alarms tab | Displays all EVPN events network-wide. By default, the event list is sorted by time, with the most recent events listed first. The tab provides the following additional data about each event:
|
| Table Actions | Select, export, or filter the list. Refer to Table Settings. |
EVPN Session Card
This card displays performance and status information for a single EVPN session. Card is opened from the full-screen Network Services|All EVPN Sessions card.
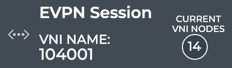
The small EVPN Session card displays:
| Item | Description |
|---|---|
| Indicates data is for an EVPN session | |
| Title | EVPN Session |
| VNI Name | Name of the VNI (virtual network instance) used for this EVPN session |
| Current VNI Nodes | Total number of VNI nodes participating in the EVPN session currently |
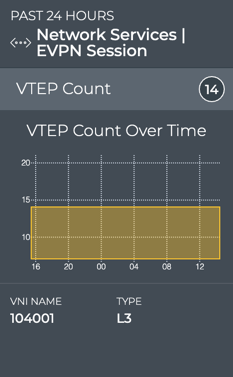
The medium EVPN Session card displays:
| Item | Description |
|---|---|
| Time period | Range of time in which the displayed data was collected; applies to all card sizes |
| Indicates data is for an EVPN session | |
| Title | Network Services|EVPN Session |
| Summary bar | VTEP (VXLAN Tunnel EndPoint) Count: Total number of VNI nodes participating in the EVPN session currently |
| VTEP Count Over Time chart | Distribution of VTEP counts during the designated time period |
| VNI Name | Name of the VNI used for this EVPN session |
| Type | Indicates whether the session is established as part of a layer 2 (L2) or layer 3 (L3) overlay network |
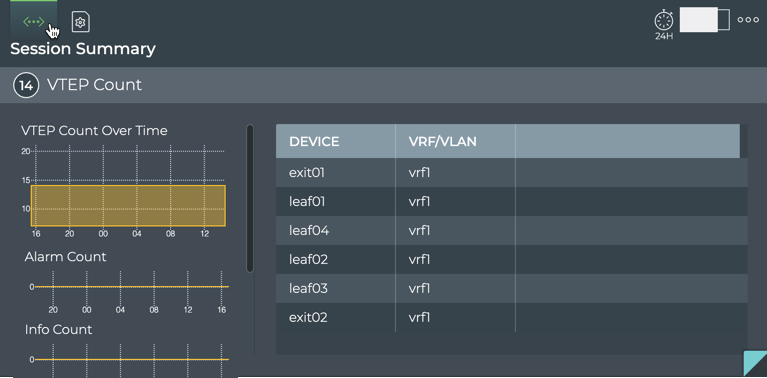
The large EVPN Session card contains two tabs.
The Session Summary tab displays:
| Item | Description |
|---|---|
| Time period | Range of time in which the displayed data was collected; applies to all card sizes |
| Indicates data is for an EVPN session | |
| Title | Session Summary (Network Services | EVPN Session) |
| Summary bar | VTEP (VXLAN Tunnel EndPoint) Count: Total number of VNI devices participating in the EVPN session currently |
| VTEP Count Over Time chart | Distribution of VTEPs during the designated time period |
| Alarm Count chart | Distribution of alarms during the designated time period |
| Info Count chart | Distribution of info events during the designated time period |
| Table | VRF (for layer 3) or VLAN (for layer 2) identifiers by device |
The Configuration File Evolution tab displays:
| Item | Description |
|---|---|
| Time period | Range of time in which the displayed data was collected; applies to all card sizes. |
| Indicates configuration file information for a single session of a Network Service or Protocol. | |
| Title | (Network Services | EVPN Session) Configuration File Evolution. |
| VTEP count (currently). | |
| Timestamps | When changes to the configuration file have occurred, the date and time are indicated. Click the time to see the changed file. |
| Configuration File | When File is selected, the configuration file as it was at the selected time is shown. When Diff is selected, the configuration file at the selected time is shown on the left and the configuration file at the previous timestamp is shown on the right. Differences are highlighted. Note: If no configuration file changes have been made, only the original file date is shown. |
The full screen EVPN Session card provides tabs for all EVPN sessions and all events.
| Item | Description |
|---|---|
| Title | Network Services | EVPN. |
| Closes full screen card and returns to workbench. | |
| Time period | Range of time in which the displayed data was collected; applies to all card sizes; select an alternate time period by clicking |
| Displays data refresh status. Click | |
| Results | Number of results found for the selected tab. |
| All EVPN Sessions tab | Displays all EVPN sessions network-wide. By default, the session list is sorted by hostname. This tab provides the following additional data about each session:
|
| All Events tab | Displays all events network-wide. By default, the event list is sorted by time, with the most recent events listed first. The tab provides the following additional data about each event:
|
| Table Actions | Select, export, or filter the list. Refer to Table Settings. |
ALL LLDP Sessions Card
This card displays performance and status information for all LLDP sessions across all nodes in your network.
With NetQ, you can monitor the number of nodes running the LLDP service, view nodes with the most LLDP neighbor nodes, those nodes with the least neighbor nodes, and view alarms triggered by the LLDP service. For an overview and how to configure LLDP in your data center network, refer to Link Layer Discovery Protocol.
The small LLDP Service card displays:
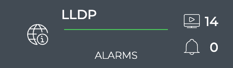
| Item | Description |
|---|---|
| Indicates data is for all sessions of a Network Service or Protocol. | |
| Title | LLDP: All LLDP Sessions, or the LLDP Service. |
| Total number of switches with the LLDP service enabled during the designated time period. | |
| Total number of LLDP-related alarms received during the designated time period. | |
| Chart | Distribution of LLDP-related alarms received during the designated time period. |
The medium LLDP Service card displays:
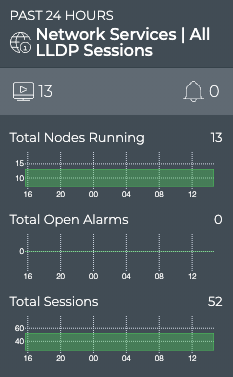
| Item | Description |
|---|---|
| Time period | Range of time in which the displayed data was collected; applies to all card sizes. |
| Indicates data is for all sessions of a Network Service or Protocol. | |
| Title | LLDP: All LLDP Sessions, or the LLDP Service. |
| Total number of switches with the LLDP service enabled during the designated time period. | |
| Total number of LLDP-related alarms received during the designated time period. | |
| Total Nodes Running chart | Distribution of switches and hosts with the LLDP service enabled during the designated time period, and a total number of nodes running the service currently. Note: The node count here might be different than the count in the summary bar. For example, the number of nodes running LLDP last week or last month might be more or less than the number of nodes running LLDP currently. |
| Total Open Alarms chart | Distribution of LLDP-related alarms received during the designated time period, and the total number of current LLDP-related alarms in the network. Note: The alarm count here might be different than the count in the summary bar. For example, the number of new alarms received in this time period does not take into account alarms that have already been received and are still active. You might have no new alarms, but still have a total number of alarms present on the network of 10. |
| Total Sessions chart | Distribution of LLDP sessions running during the designated time period, and the total number of sessions running on the network currently. |
The large LLDP service card contains two tabs.
The Sessions Summary tab which displays:
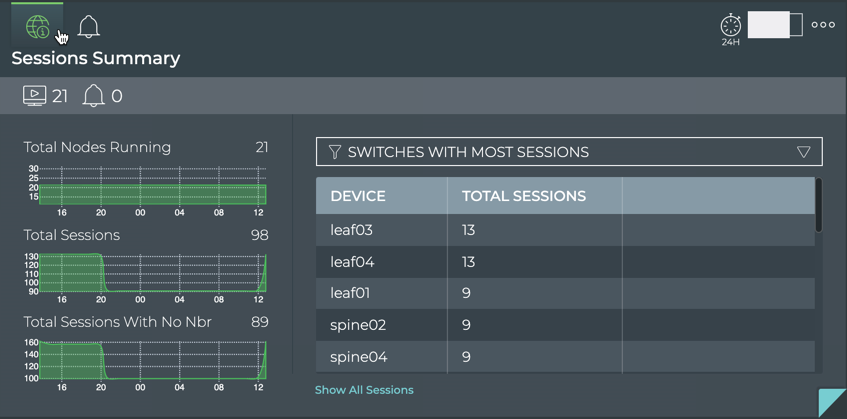
| Item | Description |
|---|---|
| Time period | Range of time in which the displayed data was collected; applies to all card sizes. |
| Indicates data is for all sessions of a Network Service or Protocol. | |
| Title | Sessions Summary (Network Services | All LLDP Sessions). |
| Total number of switches with the LLDP service enabled during the designated time period. | |
| Total number of LLDP-related alarms received during the designated time period. | |
| Total Nodes Running chart | Distribution of switches and hosts with the LLDP service enabled during the designated time period, and a total number of nodes running the service currently. Note: The node count here might be different than the count in the summary bar. For example, the number of nodes running LLDP last week or last month might be more or less than the number of nodes running LLDP currently. |
| Total Sessions chart | Distribution of LLDP sessions running during the designated time period, and the total number of sessions running on the network currently. |
| Total Sessions with No Nbr chart | Distribution of LLDP sessions missing neighbor information during the designated time period, and the total number of session missing neighbors in the network currently. |
| Table/Filter options | When the Switches with Most Sessions filter is selected, the table displays switches running LLDP sessions in decreasing order of session count-devices with the largest number of sessions are listed first. When the Switches with Most Unestablished Sessions filter is selected, the table displays switches running LLDP sessions in decreasing order of unestablished session count-devices with the largest number of unestablished sessions are listed first. |
| Show All Sessions | Link to view all LLDP sessions in the full screen card. |
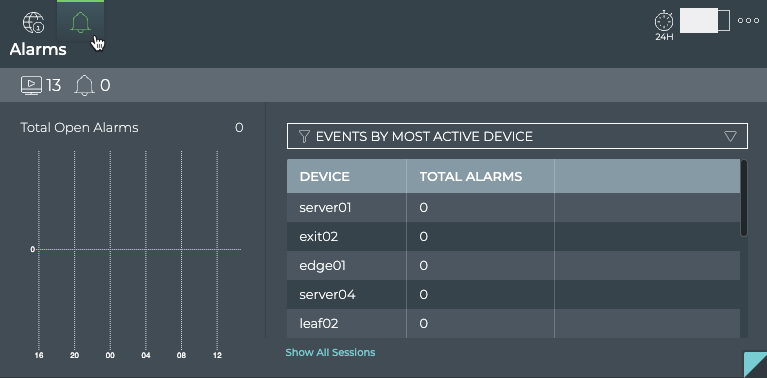
The Alarms tab which displays:
| Item | Description |
|---|---|
| Time period | Range of time in which the displayed data was collected; applies to all card sizes. |
| Indicates data is all alarms for all LLDP sessions. | |
| Title | Alarms (visible when you hover over card). |
| Total number of switches with the LLDP service enabled during the designated time period. | |
| Total number of LLDP-related alarms received during the designated time period. | |
| Total Alarms chart | Distribution of LLDP-related alarms received during the designated time period, and the total number of current LLDP-related alarms in the network. Note: The alarm count here might be different than the count in the summary bar. For example, the number of new alarms received in this time period does not take into account alarms that have already been received and are still active. You might have no new alarms, but still have a total number of alarms present on the network of 10. |
| Table/Filter options | When the Events by Most Active Device filter is selected, the table displays switches running LLDP sessions in decreasing order of alarm count-devices with the largest number of sessions are listed first |
| Show All Sessions | Link to view all LLDP sessions in the full screen card. |
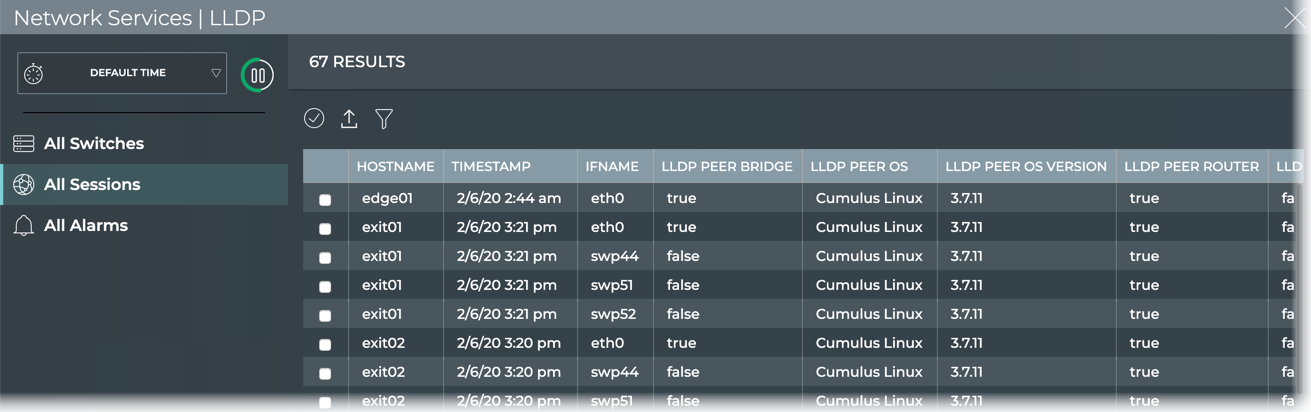
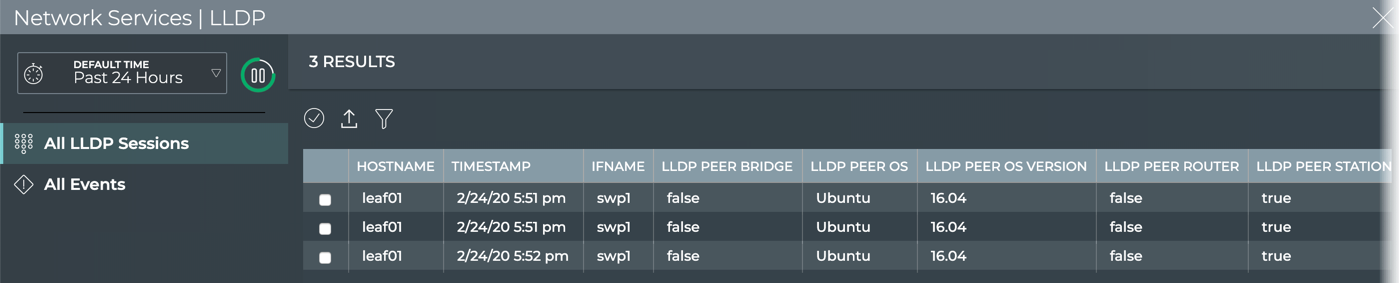
The full screen LLDP Service card provides tabs for all switches, all sessions, and all alarms.
| Item | Description |
|---|---|
| Title | Network Services | LLDP. |
| Closes full screen card and returns to workbench. | |
| Time period | Range of time in which the displayed data was collected; applies to all card sizes; select an alternate time period by clicking |
| Displays data refresh status. Click | |
| Results | Number of results found for the selected tab. |
| All Switches tab | Displays all switches and hosts running the LLDP service. By default, the device list is sorted by hostname. This tab provides the following additional data about each device:
|
| All Sessions tab | Displays all LLDP sessions networkwide. By default, the session list is sorted by hostname. This tab provides the following additional data about each session:
|
| All Alarms tab | Displays all LLDP events networkwide. By default, the event list is sorted by time, with the most recent events listed first. The tab provides the following additional data about each event:
| Table Actions | Select, export, or filter the list. Refer to Table Settings. |
LLDP Session Card
This card displays performance and status information for a single LLDP session. Card is opened from the full-screen Network Services|All LLDP Sessions card.
The small LLDP Session card displays:

| Item | Description |
|---|---|
| Indicates data is for a single session of a Network Service or Protocol. | |
| Title | LLDP Session. |
| Host and peer devices in session. Host is shown on top, with peer below. | |
| Indicates whether the host sees the peer or not; |
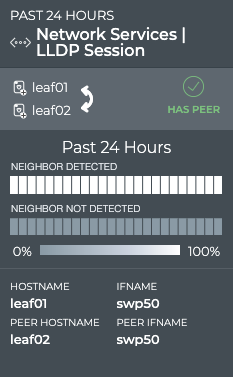
The medium LLDP Session card displays:
| Item | Description |
|---|---|
| Time period | Range of time in which the displayed data was collected. |
| Indicates data is for a single session of a Network Service or Protocol. | |
| Title | LLDP Session. |
| Host and peer devices in session. Arrow points from host to peer. | |
| Indicates whether the host sees the peer or not; | |
| Time period | Range of time for the distribution chart. |
| Heat map | Distribution of neighbor availability (detected or undetected) during this given time period. |
| Hostname | User-defined name of the host device. |
| Interface Name | Software interface on the host device where the session is running. |
| Peer Hostname | User-defined name of the peer device. |
| Peer Interface Name | Software interface on the peer where the session is running. |
The large LLDP Session card contains two tabs.
The Session Summary tab displays:
| Item | Description |
|---|---|
| Time period | Range of time in which the displayed data was collected. |
| Indicates data is for a single session of a Network Service or Protocol. | |
| Title | Summary Session (Network Services | LLDP Session). |
| Host and peer devices in session. Arrow points from host to peer. | |
| Indicates whether the host sees the peer or not; | |
| Heat map | Distribution of neighbor state (detected or undetected) during this given time period. |
| Alarm Count chart | Distribution and count of LLDP alarm events during the given time period. |
| Info Count chart | Distribution and count of LLDP info events during the given time period. |
| Host Interface Name | Software interface on the host where the session is running. |
| Peer Hostname | User-defined name of the peer device. |
| Peer Interface Name | Software interface on the peer where the session is running. |
The Configuration File Evolution tab displays:
| Item | Description |
|---|---|
| Time period | Range of time in which the displayed data was collected; applies to all card sizes. |
| Indicates configuration file information for a single session of a Network Service or Protocol. | |
| Title | (Network Services | LLDP Session) Configuration File Evolution. |
| Device identifiers (hostname, IP address, or MAC address) for host and peer in session. Click | |
| Indicates whether the host sees the peer or not; | |
| Timestamps | When changes to the configuration file have occurred, the date and time are indicated. Click the time to see the changed file. |
| Configuration File | When File is selected, the configuration file as it was at the selected time is shown. When Diff is selected, the configuration file at the selected time is shown on the left and the configuration file at the previous timestamp is shown on the right. Differences are highlighted. Note: If no configuration file changes have been made, the card shows no results. |
The full screen LLDP Session card provides tabs for all LLDP sessions and all events.
| Item | Description |
|---|---|
| Title | Network Services | LLDP. |
| Closes full screen card and returns to workbench. | |
| Time period | Range of time in which the displayed data was collected; applies to all card sizes; select an alternate time period by clicking |
| Displays data refresh status. Click | |
| Results | Number of results found for the selected tab. |
| All LLDP Sessions tab | Displays all LLDP sessions on the host device. By default, the session list is sorted by hostname. This tab provides the following additional data about each session:
|
| All Events tab | Displays all events networkwide. By default, the event list is sorted by time, with the most recent events listed first. The tab provides the following additional data about each event:
|
| Table Actions | Select, export, or filter the list. Refer to Table Settings. |
All MLAG Sessions Card
This card displays performance and status information for all MLAG sessions across all nodes in your network.
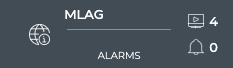
The small MLAG Service card displays:
| Item | Description |
|---|---|
| Indicates data is for all sessions of a Network Service or Protocol | |
| Title | MLAG: All MLAG Sessions, or the MLAG Service |
| Total number of switches with the MLAG service enabled during the designated time period | |
| Total number of MLAG-related alarms received during the designated time period | |
| Chart | Distribution of MLAG-related alarms received during the designated time period |
The medium MLAG Service card displays:
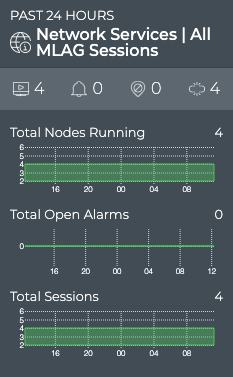
| Item | Description |
|---|---|
| Time period | Range of time in which the displayed data was collected; applies to all card sizes. |
| Indicates data is for all sessions of a Network Service or Protocol. | |
| Title | Network Services | All MLAG Sessions. |
| Total number of switches with the MLAG service enabled during the designated time period. | |
| Total number of MLAG-related alarms received during the designated time period. | |
| Total number of sessions with an inactive backup IP address during the designated time period. | |
| Total number of bonds with only a single connection during the designated time period. | |
| Total Nodes Running chart | Distribution of switches and hosts with the MLAG service enabled during the designated time period, and a total number of nodes running the service currently. Note: The node count here might be different than the count in the summary bar. For example, the number of nodes running MLAG last week or last month might be more or less than the number of nodes running MLAG currently. |
| Total Open Alarms chart | Distribution of MLAG-related alarms received during the designated time period, and the total number of current MLAG-related alarms in the network. Note: The alarm count here might be different than the count in the summary bar. For example, the number of new alarms received in this time period does not take into account alarms that have already been received and are still active. You might have no new alarms, but still have a total number of alarms present on the network of 10. |
| Total Sessions chart | Distribution of MLAG sessions running during the designated time period, and the total number of sessions running on the network currently. |
The large MLAG service card contains two tabs.
The All MLAG Sessions summary tab which displays:
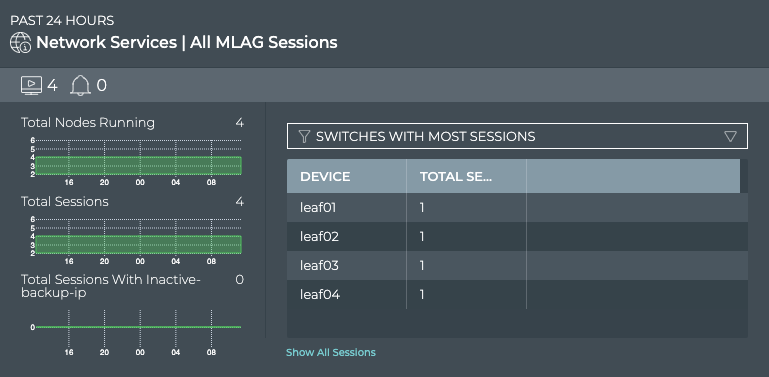
| Item | Description |
|---|---|
| Time period | Range of time in which the displayed data was collected; applies to all card sizes. |
| Indicates data is for all sessions of a Network Service or Protocol. | |
| Title | All MLAG Sessions Summary |
| Total number of switches with the MLAG service enabled during the designated time period. | |
| Total number of MLAG-related alarms received during the designated time period. | |
| Total Nodes Running chart | Distribution of switches and hosts with the MLAG service enabled during the designated time period, and a total number of nodes running the service currently. Note: The node count here might be different than the count in the summary bar. For example, the number of nodes running MLAG last week or last month might be more or less than the number of nodes running MLAG currently. |
| Total Sessions chart | Distribution of MLAG sessions running during the designated time period, and the total number of sessions running on the network currently. |
| Total Sessions with Inactive-backup-ip chart | Distribution of sessions without an active backup IP defined during the designated time period, and the total number of these sessions running on the network currently. |
| Table/Filter options | When the Switches with Most Sessions filter is selected, the table displays switches running MLAG sessions in decreasing order of session count-devices with the largest number of sessions are listed first. When the Switches with Most Unestablished Sessions filter is selected, the table displays switches running MLAG sessions in decreasing order of unestablished session count-devices with the largest number of unestablished sessions are listed first. |
| Show All Sessions | Link to view all MLAG sessions in the full screen card. |
The All MLAG Alarms tab which displays:
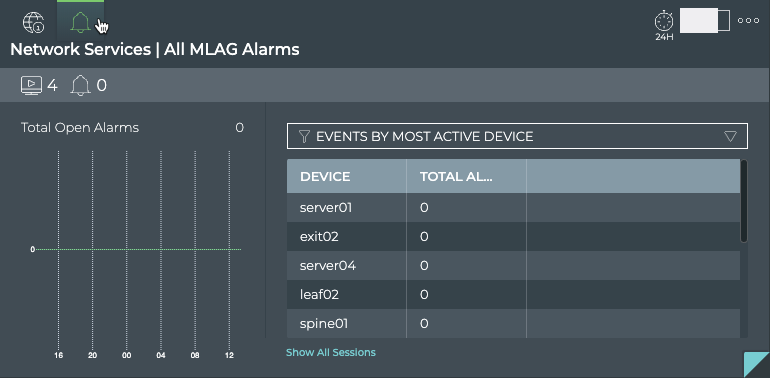
| Item | Description |
|---|---|
| Time period | Range of time in which the displayed data was collected; applies to all card sizes. |
| Indicates alarm data for all MLAG sessions. | |
| Title | Network Services | All MLAG Alarms (visible when you hover over card). |
| Total number of switches with the MLAG service enabled during the designated time period. | |
| Total number of MLAG-related alarms received during the designated time period. | |
| Total Alarms chart | Distribution of MLAG-related alarms received during the designated time period, and the total number of current MLAG-related alarms in the network. Note: The alarm count here might be different than the count in the summary bar. For example, the number of new alarms received in this time period does not take into account alarms that have already been received and are still active. You might have no new alarms, but still have a total number of alarms present on the network of 10. |
| Table/Filter options | When the Events by Most Active Device filter is selected, the table displays switches running MLAG sessions in decreasing order of alarm count-devices with the largest number of sessions are listed first. |
| Show All Sessions | Link to view all MLAG sessions in the full screen card. |
The full screen MLAG Service card provides tabs for all switches, all sessions, and all alarms.
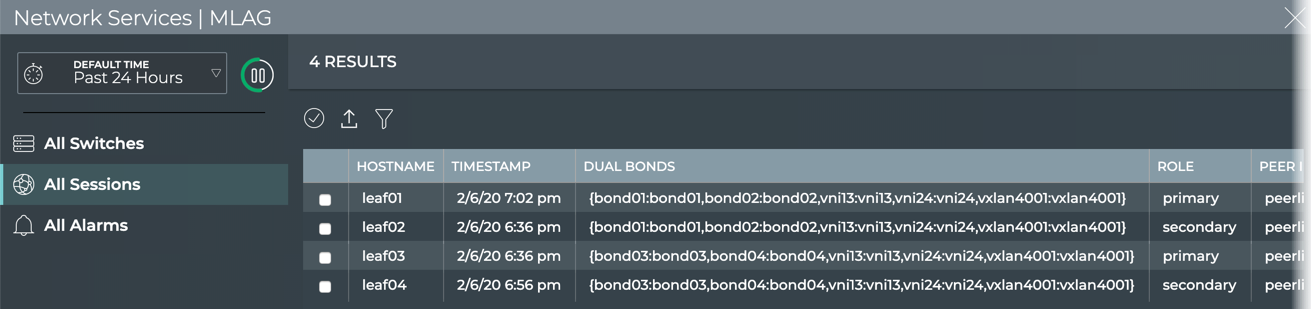
| Item | Description |
|---|---|
| Title | Network Services | MLAG. |
| Closes full screen card and returns to workbench. | |
| Time period | Range of time in which the displayed data was collected; applies to all card sizes; select an alternate time period by clicking |
| Displays data refresh status. Click | |
| Results | Number of results found for the selected tab. |
| All Switches tab | Displays all switches and hosts running the MLAG service. By default, the device list is sorted by hostname. This tab provides the following additional data about each device:
|
| All Sessions tab | Displays all MLAG sessions network-wide. By default, the session list is sorted by hostname. This tab provides the following additional data about each session:
|
| All Alarms tab | Displays all MLAG events network-wide. By default, the event list is sorted by time, with the most recent events listed first. The tab provides the following additional data about each event:
|
| Table Actions | Select, export, or filter the list. Refer to Table Settings. |
MLAG Session Card
This card displays performance and status information for a single MLAG session. Card is opened from the full-screen Network Services|All MLAG Sessions card.
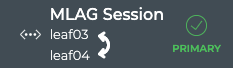
The small MLAG Session card displays:
| Item | Description |
|---|---|
| Indicates data is for a single session of a Network Service or Protocol. | |
| Title | CLAG Session. |
| Device identifiers (hostname, IP address, or MAC address) for host and peer in session. | |
| Indication of host role, primary |
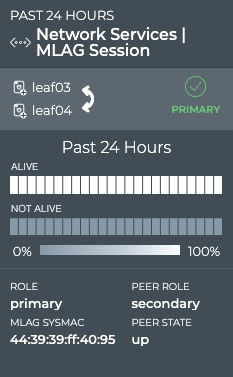
The medium MLAG Session card displays:
| Item | Description |
|---|---|
| Time period (in header) | Range of time in which the displayed data was collected; applies to all card sizes. |
| Indicates data is for a single session of a Network Service or Protocol. | |
| Title | Network Services | MLAG Session. |
| Device identifiers (hostname, IP address, or MAC address) for host and peer in session. Arrow points from the host to the peer. Click | |
| Indication of host role, primary | |
| Time period (above chart) | Range of time for data displayed in peer status chart. |
| Peer Status chart | Distribution of peer availability, alive or not alive, during the designated time period. The number of time segments in a time period varies according to the length of the time period. |
| Role | Role that host device is playing. Values include primary and secondary. |
| CLAG sysmac | System MAC address of the MLAG session. |
| Peer Role | Role that peer device is playing. Values include primary and secondary. |
| Peer State | Operational state of the peer, up (true) or down (false). |
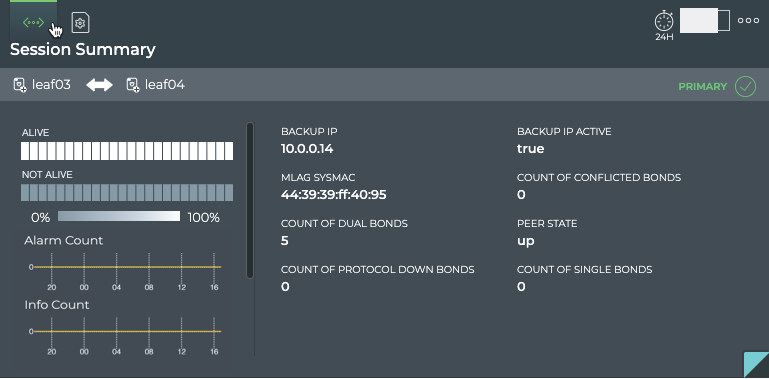
The large MLAG Session card contains two tabs.
The Session Summary tab displays:
| Item | Description |
|---|---|
| Time period | Range of time in which the displayed data was collected; applies to all card sizes. |
| Indicates data is for a single session of a Network Service or Protocol. | |
| Title | (Network Services | MLAG Session) Session Summary. |
| Device identifiers (hostname, IP address, or MAC address) for host and peer in session. Arrow points from the host to the peer. Click | |
| Indication of host role, primary | |
| Alarm Count Chart | Distribution and count of CLAG alarm events over the given time period. |
| Info Count Chart | Distribution and count of CLAG info events over the given time period. |
| Peer Status chart | Distribution of peer availability, alive or not alive, during the designated time period. The number of time segments in a time period varies according to the length of the time period. |
| Backup IP | IP address of the interface to use if the peerlink (or bond) goes down. |
| Backup IP Active | Indicates whether the backup IP address is configured. |
| CLAG SysMAC | System MAC address of the MLAG session. |
| Peer State | Operational state of the peer, up (true) or down (false). |
| Count of Dual Bonds | Number of bonds connecting to both switches. |
| Count of Single Bonds | Number of bonds connecting to only one switch. |
| Count of Protocol Down Bonds | Number of bonds with interfaces that were brought down by the clagd service. |
| Count of Conflicted Bonds | Number of bonds which have a set of interfaces that are not the same on both switches. |
The Configuration File Evolution tab displays:

| Item | Description |
|---|---|
| Time period | Range of time in which the displayed data was collected; applies to all card sizes. |
| Indicates configuration file information for a single session of a Network Service or Protocol. | |
| Title | (Network Services | MLAG Session) Configuration File Evolution. |
| Device identifiers (hostname, IP address, or MAC address) for host and peer in session. Arrow points from the host to the peer. Click | |
| Indication of host role, primary | |
| Timestamps | When changes to the configuration file have occurred, the date and time are indicated. Click the time to see the changed file. |
| Configuration File | When File is selected, the configuration file as it was at the selected time is shown. When Diff is selected, the configuration file at the selected time is shown on the left and the configuration file at the previous timestamp is shown on the right. Differences are highlighted. |
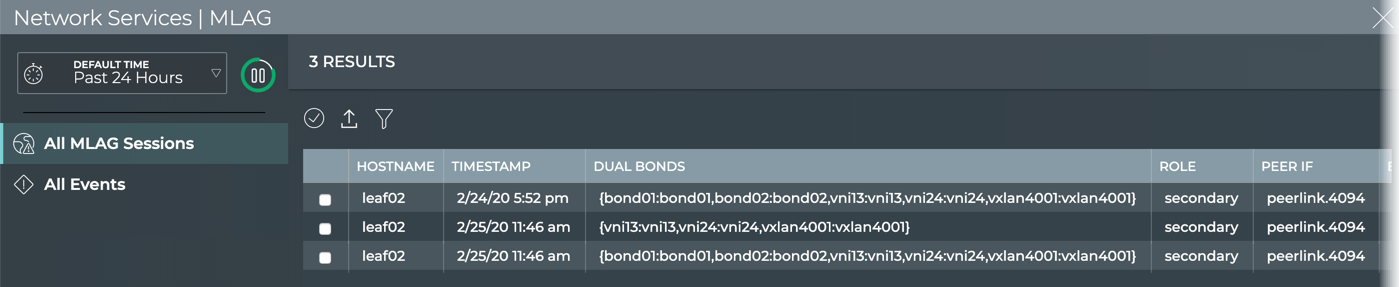
The full screen MLAG Session card provides tabs for all MLAG sessions and all events.
| Item | Description |
|---|---|
| Title | Network Services | MLAG |
| Closes full screen card and returns to workbench | |
| Time period | Range of time in which the displayed data was collected; applies to all card sizes; select an alternate time period by clicking |
| Displays data refresh status. Click | |
| Results | Number of results found for the selected tab |
| All MLAG Sessions tab | Displays all MLAG sessions for the given session. By default, the session list is sorted by hostname. This tab provides the following additional data about each session:
|
| All Events tab | Displays all events network-wide. By default, the event list is sorted by time, with the most recent events listed first. The tab provides the following additional data about each event:
|
| Table Actions | Select, export, or filter the list. Refer to Table Settings. |
All OSPF Sessions Card
This card displays performance and status information for all OSPF sessions across all nodes in your network.
The small OSPF Service card displays:
| Item | Description |
|---|---|
| Indicates data is for all sessions of a Network Service or Protocol | |
| Title | OSPF: All OSPF Sessions, or the OSPF Service |
| Total number of switches and hosts with the OSPF service enabled during the designated time period | |
| Total number of OSPF-related alarms received during the designated time period | |
| Chart | Distribution of OSPF-related alarms received during the designated time period |
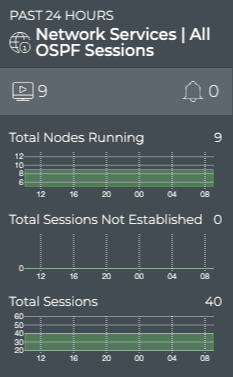
The medium OSPF Service card displays:
| Item | Description |
|---|---|
| Time period | Range of time in which the displayed data was collected; applies to all card sizes. |
| Indicates data is for all sessions of a Network Service or Protocol. | |
| Title | Network Services | All OSPF Sessions. |
| Total number of switches and hosts with the OSPF service enabled during the designated time period. | |
| Total number of OSPF-related alarms received during the designated time period. | |
| Total Nodes Running chart | Distribution of switches and hosts with the OSPF service enabled during the designated time period, and a total number of nodes running the service currently. Note: The node count here might be different than the count in the summary bar. For example, the number of nodes running OSPF last week or last month might be more or less than the number of nodes running OSPF currently. |
| Total Sessions Not Established chart | Distribution of unestablished OSPF sessions during the designated time period, and the total number of unestablished sessions in the network currently. Note: The node count here might be different than the count in the summary bar. For example, the number of unestablished session last week or last month might be more of less than the number of nodes with unestablished sessions currently. |
| Total Sessions chart | Distribution of OSPF sessions during the designated time period, and the total number of sessions running on the network currently. |
The large OSPF service card contains two tabs.
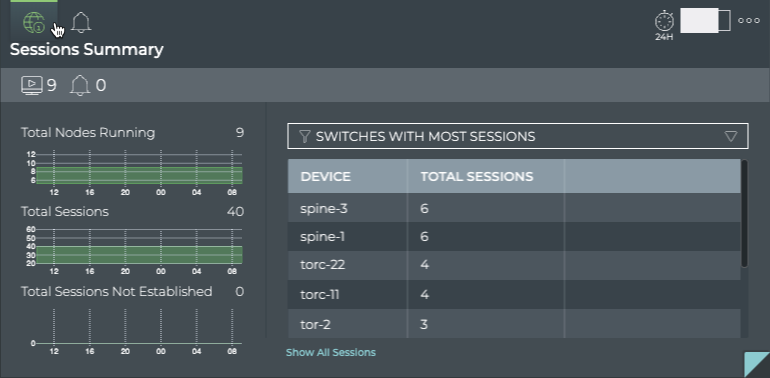
The Sessions Summary tab displays:
| Item | Description |
|---|---|
| Time period | Range of time in which the displayed data was collected; applies to all card sizes. |
| Indicates data is for all sessions of a Network Service or Protocol. | |
| Title | Sessions Summary (visible when you hover over card). |
| Total number of switches and hosts with the OSPF service enabled during the designated time period. | |
| Total number of OSPF-related alarms received during the designated time period. | |
| Total Nodes Running chart | Distribution of switches and hosts with the OSPF service enabled during the designated time period, and a total number of nodes running the service currently. Note: The node count here might be different than the count in the summary bar. For example, the number of nodes running OSPF last week or last month might be more or less than the number of nodes running OSPF currently. |
| Total Sessions chart | Distribution of OSPF sessions during the designated time period, and the total number of sessions running on the network currently. |
| Total Sessions Not Established chart | Distribution of unestablished OSPF sessions during the designated time period, and the total number of unestablished sessions in the network currently. Note: The node count here might be different than the count in the summary bar. For example, the number of unestablished session last week or last month might be more of less than the number of nodes with unestablished sessions currently. |
| Table/Filter options | When the Switches with Most Sessions filter option is selected, the table displays the switches and hosts running OSPF sessions in decreasing order of session count-devices with the largest number of sessions are listed first When the Switches with Most Unestablished Sessions filter option is selected, the table switches and hosts running OSPF sessions in decreasing order of unestablished sessions-devices with the largest number of unestablished sessions are listed first |
| Show All Sessions | Link to view data for all OSPF sessions in the full screen card. |
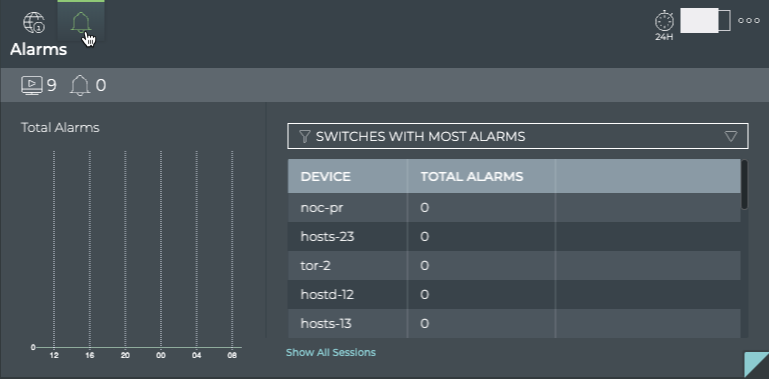
The Alarms tab displays:
| Item | Description |
|---|---|
| Time period | Range of time in which the displayed data was collected; applies to all card sizes. |
| Indicates data is all alarms for all OSPF sessions. | |
| Title | Alarms (visible when you hover over card). |
| Total number of switches and hosts with the OSPF service enabled during the designated time period. | |
| Total number of OSPF-related alarms received during the designated time period. | |
| Total Alarms chart | Distribution of OSPF-related alarms received during the designated time period, and the total number of current OSPF-related alarms in the network. Note: The alarm count here might be different than the count in the summary bar. For example, the number of new alarms received in this time period does not take into account alarms that have already been received and are still active. You might have no new alarms, but still have a total number of alarms present on the network of 10. |
| Table/Filter options | When the selected filter option is Switches with Most Alarms, the table displays switches and hosts running OSPF in decreasing order of the count of alarms-devices with the largest number of OSPF alarms are listed first |
| Show All Sessions | Link to view data for all OSPF sessions in the full screen card. |
The full screen OSPF Service card provides tabs for all switches, all sessions, and all alarms.
| Item | Description |
|---|---|
| Title | Network Services | OSPF. |
| Closes full screen card and returns to workbench. | |
| Time period | Range of time in which the displayed data was collected; applies to all card sizes; select an alternate time period by clicking |
| Displays data refresh status. Click | |
| Results | Number of results found for the selected tab |
| All Switches tab | Displays all switches and hosts running the OSPF service. By default, the device list is sorted by hostname. This tab provides the following additional data about each device:
|
| All Sessions tab | Displays all OSPF sessions networkwide. By default, the session list is sorted by hostname. This tab provides the following additional data about each session:
|
| All Alarms tab | Displays all OSPF events networkwide. By default, the event list is sorted by time, with the most recent events listed first. The tab provides the following additional data about each event:
|
| Table Actions | Select, export, or filter the list. Refer to Table Settings. |
OSPF Session Card
This card displays performance and status information for a single OSPF session. Card is opened from the full-screen Network Services|All OSPF Sessions card.
The small OSPF Session card displays:

| Item | Description |
|---|---|
| Indicates data is for a single session of a Network Service or Protocol. | |
| Title | OSPF Session. |
| Hostnames of the two devices in a session. Host appears on top with peer below. | |
| Current state of OSPF. |
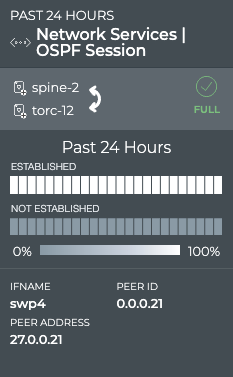
The medium OSPF Session card displays:
| Item | Description |
|---|---|
| Time period | Range of time in which the displayed data was collected; applies to all card sizes. |
| Indicates data is for a single session of a Network Service or Protocol. | |
| Title | Network Services | OSPF Session. |
| Hostnames of the two devices in a session. Host appears on top with peer below. | |
| Current state of OSPF. | |
| Time period for chart | Time period for the chart data. |
| Session State Changes Chart | Heat map of the state of the given session over the given time period. The status is sampled at a rate consistent with the time period. For example, for a 24 hour period, a status is collected every hour. Refer to Granularity of Data Shown Based on Time Period. |
| Ifname | Interface name on or hostname for host device where session resides. |
| Peer Address | IP address of the peer device. |
| Peer ID | IP address of router with access to the peer device. |
The large OSPF Session card contains two tabs.
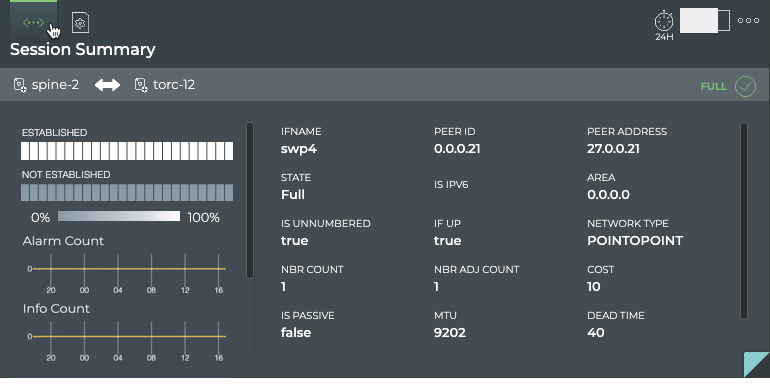
The Session Summary tab displays:
| Item | Description |
|---|---|
| Time period | Range of time in which the displayed data was collected; applies to all card sizes. |
| Indicates data is for a single session of a Network Service or Protocol. | |
| Title | Session Summary (Network Services | OSPF Session). |
| Summary bar | Hostnames of the two devices in a session. Arrow points in the direction of the session. Current state of OSPF. |
| Session State Changes Chart | Heat map of the state of the given session over the given time period. The status is sampled at a rate consistent with the time period. For example, for a 24 hour period, a status is collected every hour. Refer to Granularity of Data Shown Based on Time Period. |
| Alarm Count Chart | Distribution and count of OSPF alarm events over the given time period. |
| Info Count Chart | Distribution and count of OSPF info events over the given time period. |
| Ifname | Name of the interface on the host device where the session resides. |
| State | Current state of OSPF. |
| Is Unnumbered | Indicates if the session is part of an unnumbered OSPF configuration (true) or part of a numbered OSPF configuration (false). |
| Nbr Count | Number of routers in the OSPF configuration. |
| Is Passive | Indicates if the host is in a passive state (true) or active state (false). |
| Peer ID | IP address of router with access to the peer device. |
| Is IPv6 | Indicates if the IP address of the host device is IPv6 (true) or IPv4 (false). |
| If Up | Indicates if the interface on the host is up (true) or down (false). |
| Nbr Adj Count | Number of adjacent routers for this host. |
| MTU | Maximum transmission unit (MTU) on shortest path between the host and peer. |
| Peer Address | IP address of the peer device. |
| Area | Routing domain of the host device. |
| Network Type | Architectural design of the network. Values include Point-to-Point and Broadcast. |
| Cost | Shortest path through the network between the host and peer devices. |
| Dead Time | Countdown timer, starting at 40 seconds, that is constantly reset as messages are heard from the neighbor. If the dead time gets to zero, the neighbor is presumed dead, the adjacency is torn down, and the link removed from SPF calculations in the OSPF database. |
The Configuration File Evolution tab displays:
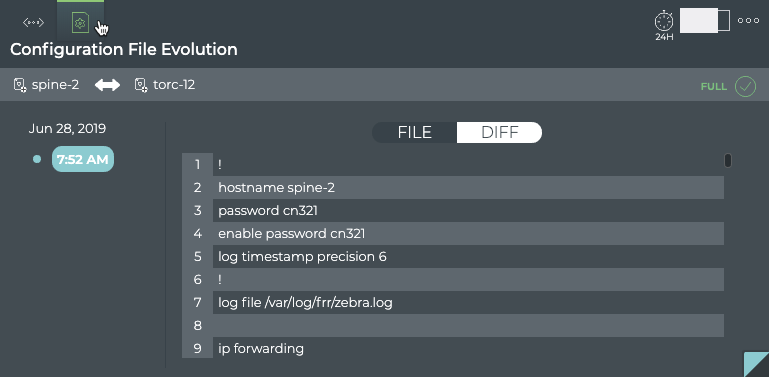
| Item | Description |
|---|---|
| Time period | Range of time in which the displayed data was collected; applies to all card sizes. |
| Indicates configuration file information for a single session of a Network Service or Protocol. | |
| Title | (Network Services | OSPF Session) Configuration File Evolution. |
| Device identifiers (hostname, IP address, or MAC address) for host and peer in session. Arrow points from the host to the peer. Click | |
| Current state of OSPF. | |
| Timestamps | When changes to the configuration file have occurred, the date and time are indicated. Click the time to see the changed file. |
| Configuration File | When File is selected, the configuration file as it was at the selected time is shown. When Diff is selected, the configuration file at the selected time is shown on the left and the configuration file at the previous timestamp is shown on the right. Differences are highlighted. |
The full screen OSPF Session card provides tabs for all OSPF sessions and all events.
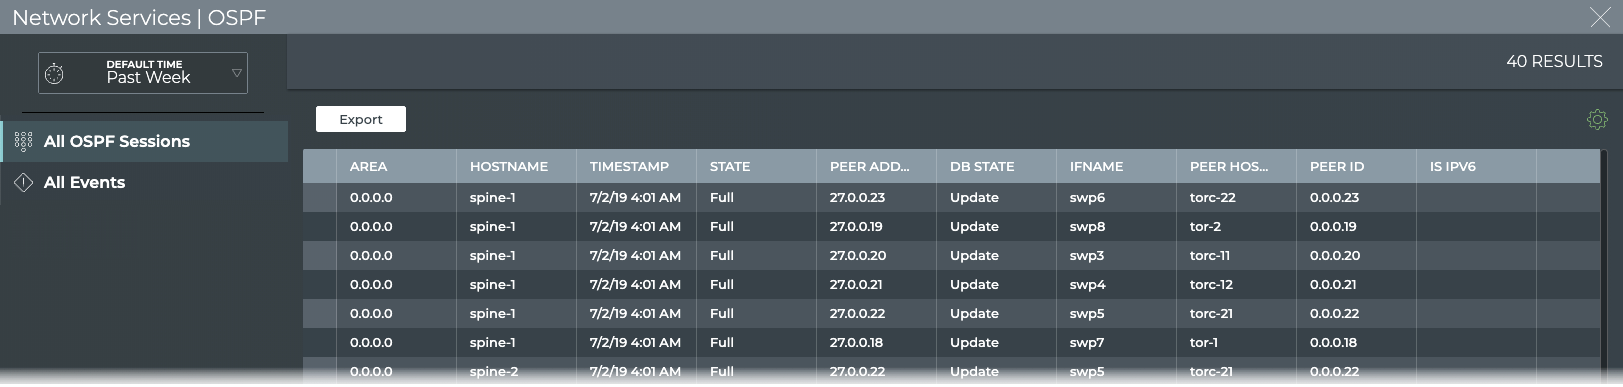
| Item | Description |
|---|---|
| Title | Network Services | OSPF. |
| Closes full screen card and returns to workbench. | |
| Time period | Range of time in which the displayed data was collected; applies to all card sizes; select an alternate time period by clicking |
| Displays data refresh status. Click | |
| Results | Number of results found for the selected tab. |
| All OSPF Sessions tab | Displays all OSPF sessions running on the host device. The session list is sorted by hostname by default. This tab provides the following additional data about each session:
|
| All Events tab | Displays all events network-wide. By default, the event list is sorted by time, with the most recent events listed first. The tab provides the following additional data about each event:
|
| Table Actions | Select, export, or filter the list. Refer to Table Settings. |
Switch Card
Viewing detail about a particular switch is essential when troubleshooting performance issues. With NetQ you can view the overall performance and drill down to view attributes of the switch, interface performance and the events associated with a switch. This is accomplished through the Switches card.
Switch cards can be added to user-created workbenches. Click ![]() to open a switch card.
to open a switch card.
The small Switch card displays:
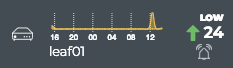
| Item | Description |
|---|---|
| Indicates data is for a single switch. | |
| title | Hostname of switch. |
| Chart | Distribution of switch alarms during the designated time period. |
| Trend | Trend of alarm count, represented by an arrow:
|
| Count | Current count of alarms on the switch. |
| Rating | Overall performance of the switch. Determined by the count of alarms relative to the average count of alarms during the designated time period:
|
The medium Switch card displays:
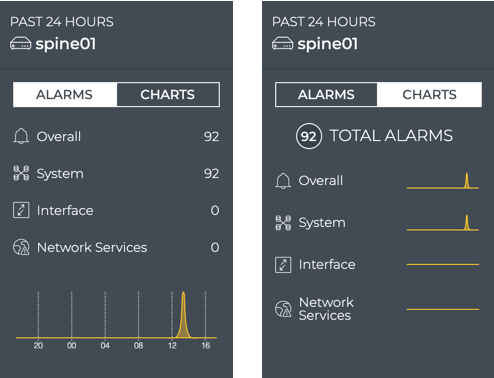
| Item | Description |
|---|---|
| Indicates data is for a single switch. | |
| title | Hostname of switch. |
| Alarms | When selected, displays distribution and count of alarms by alarm category, generated by this switch during the designated time period. |
| Charts | When selected, displays distribution of alarms by alarm category, during the designated time period. |
The large Switch card contains four tabs:
The Attributes tab displays:
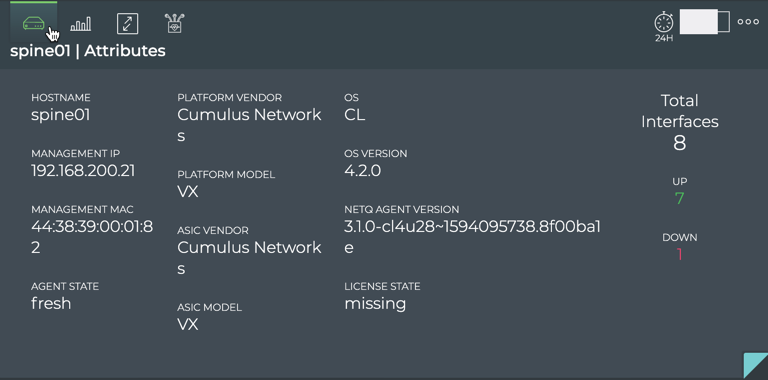
| Item | Description |
|---|---|
| Indicates data is for a single switch. | |
| title | <Hostname> | Attributes. |
| Hostname | User-defined name for this switch. |
| Management IP | IPv4 or IPv6 address used for management of this switch. |
| Management MAC | MAC address used for management of this switch. |
| Agent State | Operational state of the NetQ Agent on this switch; Fresh or Rotten. |
| Platform Vendor | Manufacturer of this switch box. Cumulus Networks is identified as the vendor for a switch in the Cumulus in the Cloud (CITC) environment, as seen here. |
| Platform Model | Manufacturer model of this switch. VX is identified as the model for a switch in CITC environment, as seen here. |
| ASIC Vendor | Manufacturer of the ASIC installed on the motherboard. |
| ASIC Model | Manufacturer model of the ASIC installed on the motherboard. |
| OS | Operating system running on the switch. CL indicates Cumulus Linux is installed. |
| OS Version | Version of the OS running on the switch. |
| NetQ Agent Version | Version of the NetQ Agent running on the switch. |
| Total Interfaces | Total number of interfaces on this switch, and the number of those that are up and down. |
The Utilization tab displays:
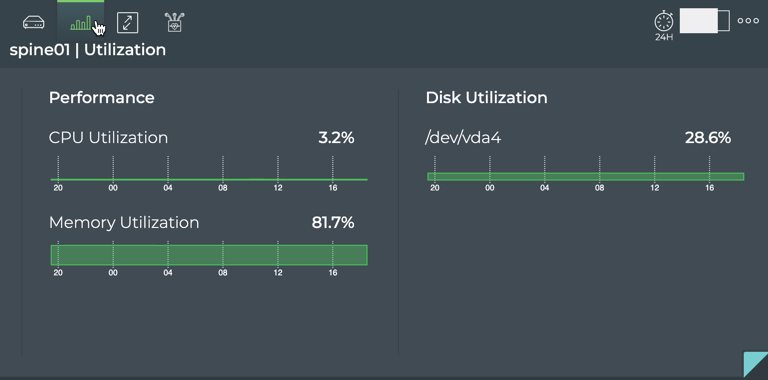
| Item | Description |
|---|---|
| Indicates utilization data is for a single switch. | |
| Title | <Hostname> | Utilization. |
| Performance | Displays distribution of CPU and memory usage during the designated time period. |
| Disk Utilization | Displays distribution of disk usage during the designated time period. |
The Interfaces tab displays:
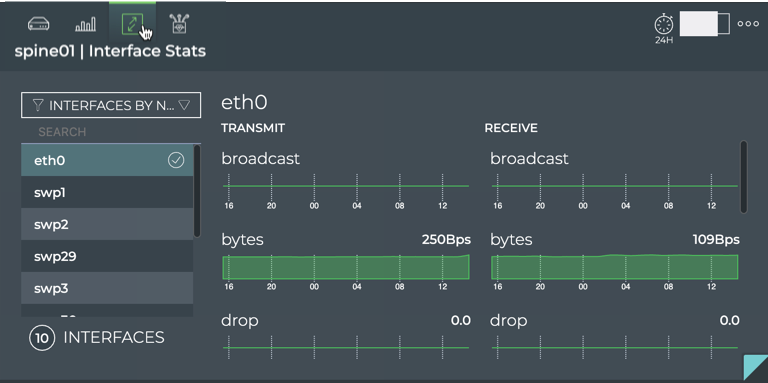
| Item | Description |
|---|---|
| Indicates interface statistics for a single switch. | |
| Title | <Hostname> | Interface Stats. |
| Interface List | List of interfaces present during the designated time period. |
| Interface Filter | Sorts interface list by Name, Rx Util (receive utilization), or Tx Util (transmit utilization). |
| Interfaces Count | Number of interfaces present during the designated time period. |
| Interface Statistics | Distribution and current value of various transmit and receive statistics associated with a selected interface:
|
The Digital Optics tab displays:
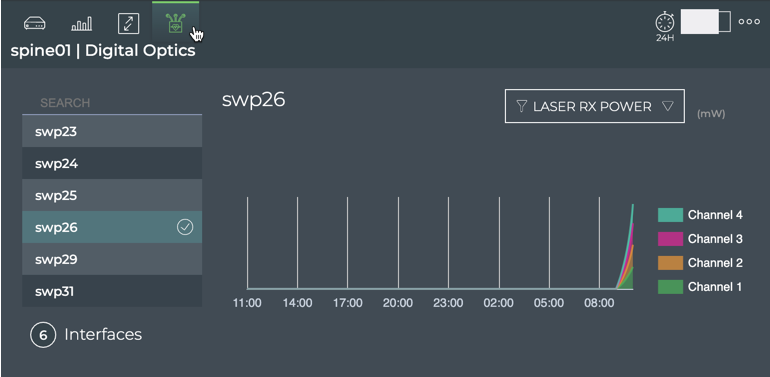
| Item | Description |
|---|---|
| Indicates digital optics metrics for a single switch. | |
| Title | <Hostname> | Digital Optics. |
| Interface List | List of interfaces present during the designated time period. |
| Search | Search for an interface by Name. |
| Interfaces Count | Number of interfaces present during the designated time period. |
| Digital Optics Statistics | Use the parameter dropdown to change the chart view to see metrics for Laser RX Power, Laser Output Power, Laser Bias Current, Module Temperature, and Module Voltage. |
The full screen Switch card provides multiple tabs.
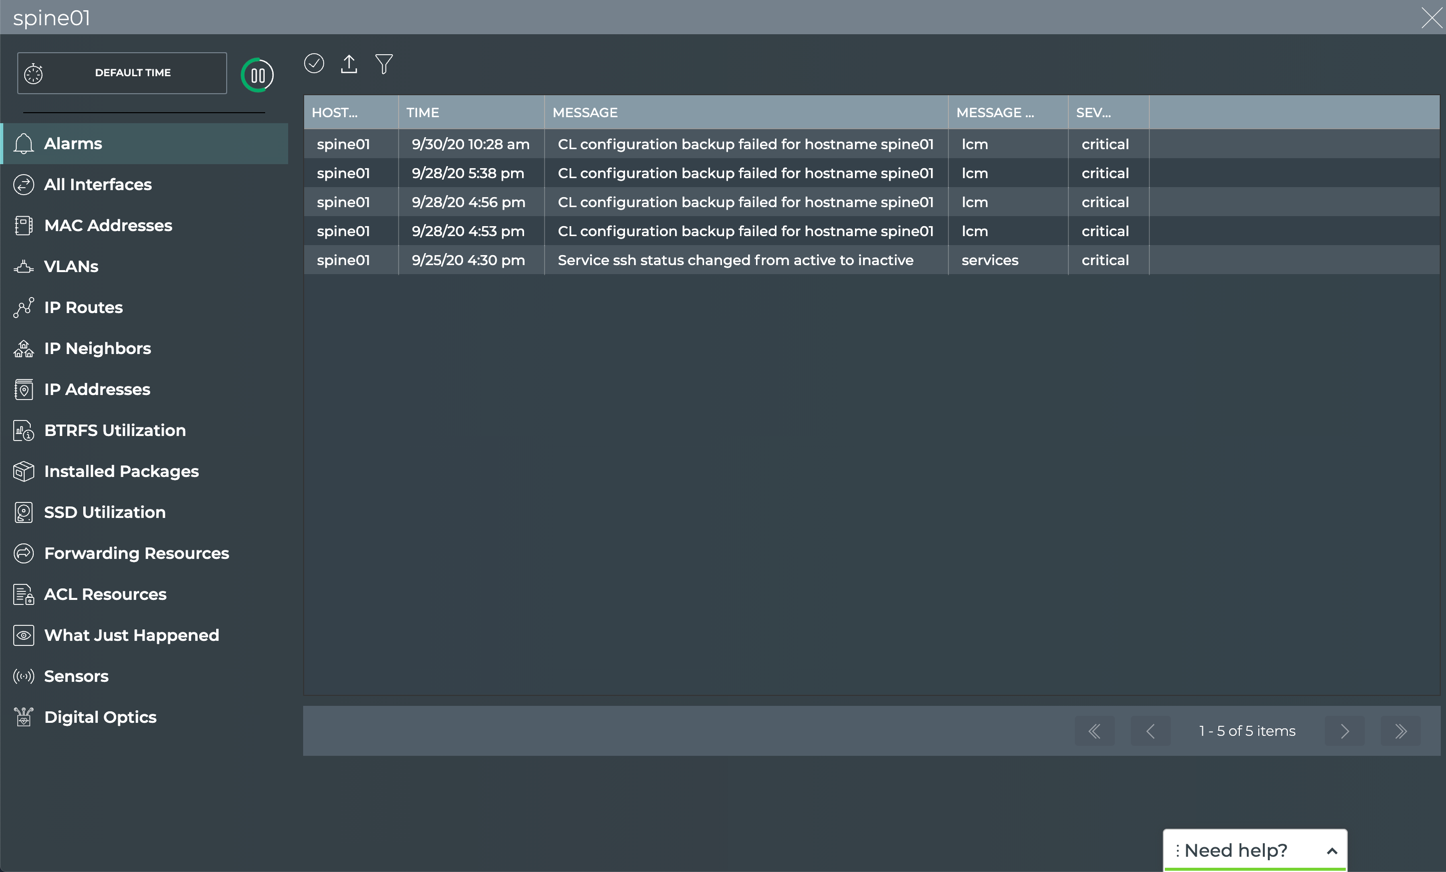
| Item | Description |
|---|---|
| Title | <hostname> |
| Closes full screen card and returns to workbench. | |
| Default Time | Displayed data is current as of this moment. |
| Displays data refresh status. Click | |
| Results | Number of results found for the selected tab. |
| Alarms | Displays all known critical alarms for the switch. This tab provides the following additional data about each address:
|
| All Interfaces | Displays all known interfaces on the switch. This tab provides the following additional data about each interface:
|
| MAC Addresses | Displays all known MAC addresses for the switch. This tab provides the following additional data about each MAC address:
|
| VLANs | Displays all configured VLANs on the switch. This tab provides the following additional data about each VLAN:
|
| IP Routes | Displays all known IP routes for the switch. This tab provides the following additional data about each route:
|
| IP Neighbors | Displays all known IP neighbors of the switch. This tab provides the following additional data about each neighbor:
|
| IP Addresses | Displays all known IP addresses for the switch. This tab provides the following additional data about each address:
|
| BTRFS Utilization | Displays disk utilization information for devices running Cumulus Linux 3.x and the b-tree file system (BTRFS):
|
| Installed Packages | Displays all known interfaces on the switch. This tab provides the following additional data about each package:
|
| SSD Utilization | Displays overall health and utilization of a 3ME3 solid state drive (SSD). This tab provides the following data about each drive:
|
| Forwarding Resources | Displays usage statistics for all forwarding resources on the switch. This tab provides the following additional data about each resource:
|
| ACL Resources | Displays usage statistics for all ACLs on the switch. The following is diplayed for each ACL:
|
| What Just Happened | Displays displays events based on conditions detected in the data plane on the switch. Refer to What Just Happened for descriptions of the fields in this table. |
| Sensors | Displays all known sensors on the switch. This tab provides a table for each type of sensor. Select the sensor type using the filter above the table.
|
| Digital Optics | Displays all available digital optics performance metrics. This tab provides a table for each of five metrics.
|
| Table Actions | Select, export, or filter the list. Refer to Table Settings. |
Trace Cards
There are three cards used to perform on-demand and scheduled traces—one for the creation of on-demand and scheduled traces and two for the results. Trace cards can be added to user-created workbenches.
Trace Request Card
This card is used to create new on-demand or scheduled trace requests or to run a scheduled trace on demand.
The small Trace Request card displays:

| Item | Description |
|---|---|
| Indicates a trace request | |
| Select Trace list | Select a scheduled trace request from the list |
| Go | Click to start the trace now |
The medium Trace Request card displays:
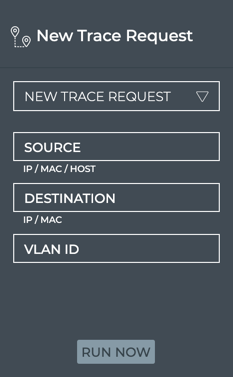
| Item | Description |
|---|---|
| Indicates a trace request. | |
| Title | New Trace Request. |
| New Trace Request | Create a new layer 2 or layer 3 (no VRF) trace request. |
| Source | (Required) Hostname or IP address of device where to begin the trace. |
| Destination | (Required) Ending point for the trace. For layer 2 traces, value must be a MAC address. For layer 3 traces, value must be an IP address. |
| VLAN ID | Numeric identifier of a VLAN. Required for layer 2 trace requests. |
| Run Now | Start the trace now. |
The large Trace Request card displays:
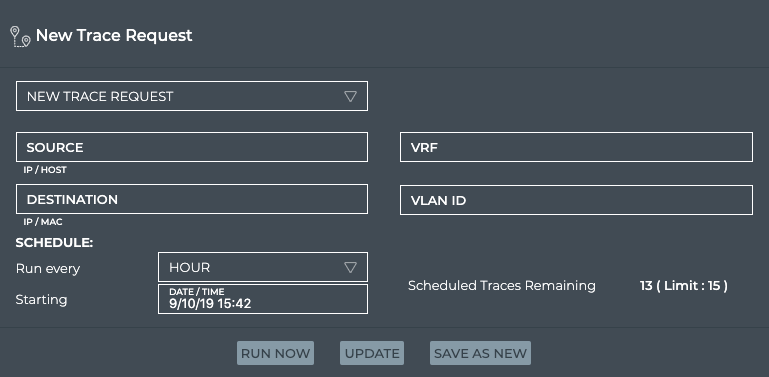
| Item | Description |
|---|---|
| Indicates a trace request. | |
| Title | New Trace Request. |
| Trace selection | Leave New Trace Request selected to create a new request, or choose a scheduled request from the list. |
| Source | (Required) Hostname or IP address of device where to begin the trace. |
| Destination | (Required) Ending point for the trace. For layer 2 traces, value must be a MAC address. For layer 3 traces, value must be an IP address. |
| VRF | Optional for layer 3 traces. Virtual Route Forwarding interface to be used as part of the trace path. |
| VLAN ID | Required for layer 2 traces. Virtual LAN to be used as part of the trace path. |
| Schedule | Sets the frequency with which to run a new trace (Run every) and when to start the trace for the first time (Starting). |
| Run Now | Start the trace now. |
| Update | Update is available when a scheduled trace request is selected from the dropdown list and you make a change to its configuration. Clicking Update saves the changes to the existing scheduled trace. |
| Save As New | Save As New is available in two instances:
|
The full screen Trace Request card displays:
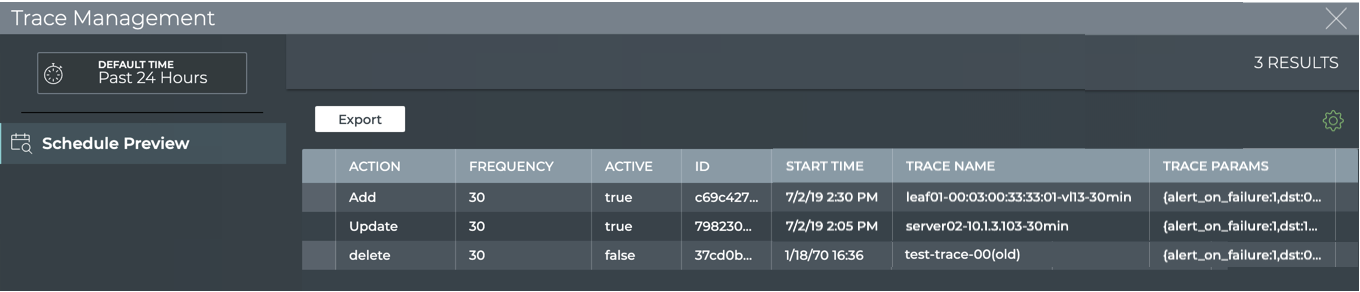
| Item | Description |
|---|---|
| Title | Trace Request. |
| Closes full screen card and returns to workbench. | |
| Time period | Range of time in which the displayed data was collected; applies to all card sizes; select an alternate time period by clicking |
| Results | Number of results found for the selected tab. |
| Schedule Preview tab | Displays all scheduled trace requests for the given user. By default, the listing is sorted by Start Time, with the most recently started traces listed at the top. The tab provides the following additional data about each event:
|
| Table Actions | Select, export, or filter the list. Refer to Table Settings. |
On-demand Trace Results Card
This card is used to view the results of on-demand trace requests.
The small On-demand Trace Results card displays:

| Item | Description |
|---|---|
| Indicates an on-demand trace result. | |
| Source and destination of the trace, identified by their address or hostname. Source is listed on top with arrow pointing to destination. | |
| Indicates success or failure of the trace request. A successful result implies all paths were successful without any warnings or failures. A failure result implies there was at least one path with warnings or errors. |
The medium On-demand Trace Results card displays:
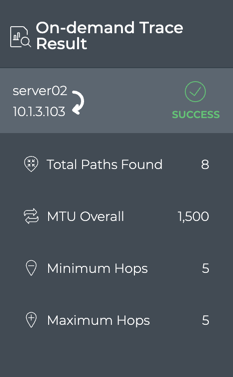
| Item | Description |
|---|---|
| Indicates an on-demand trace result. | |
| Title | On-demand Trace Result. |
| Source and destination of the trace, identified by their address or hostname. Source is listed on top with arrow pointing to destination. | |
| Indicates success or failure of the trace request. A successful result implies all paths were successful without any warnings or failures. A failure result implies there was at least one path with warnings or errors. | |
| Total Paths Found | Number of paths found between the two devices. |
| MTU Overall | Average size of the maximum transmission unit for all paths. |
| Minimum Hops | Smallest number of hops along a path between the devices. |
| Maximum Hops | Largest number of hops along a path between the devices. |
The large On-demand Trace Results card contains two tabs.
The On-demand Trace Result tab displays:
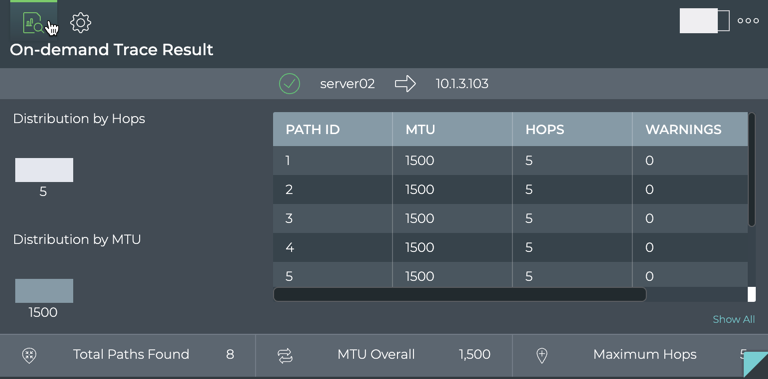
| Item | Description |
|---|---|
| Indicates an on-demand trace result. | |
| Title | On-demand Trace Result. |
| Indicates success or failure of the trace request. A successful result implies all paths were successful without any warnings or failures. A failure result implies there was at least one path with warnings or errors. | |
| Source and destination of the trace, identified by their address or hostname. Source is listed on top with arrow pointing to destination. | |
| Distribution by Hops chart | Displays the distributions of various hop counts for the available paths. |
| Distribution by MTU chart | Displays the distribution of MTUs used on the interfaces used in the available paths. |
| Table | Provides detailed path information, sorted by the route identifier, including:
|
| Total Paths Found | Number of paths found between the two devices. |
| MTU Overall | Average size of the maximum transmission unit for all paths. |
| Minimum Hops | Smallest number of hops along a path between the devices. |
The On-demand Trace Settings tab displays:
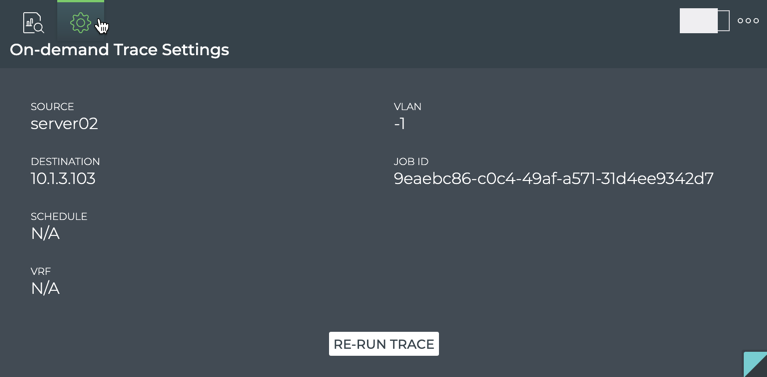
| Item | Description |
|---|---|
| Indicates an on-demand trace setting | |
| Title | On-demand Trace Settings |
| Source | Starting point for the trace |
| Destination | Ending point for the trace |
| Schedule | Does not apply to on-demand traces |
| VRF | Associated virtual route forwarding interface, when used with layer 3 traces |
| VLAN | Associated virtual local area network, when used with layer 2 traces |
| Job ID | Identifier of the job; used internally |
| Re-run Trace | Clicking this button runs the trace again |
The full screen On-demand Trace Results card displays:
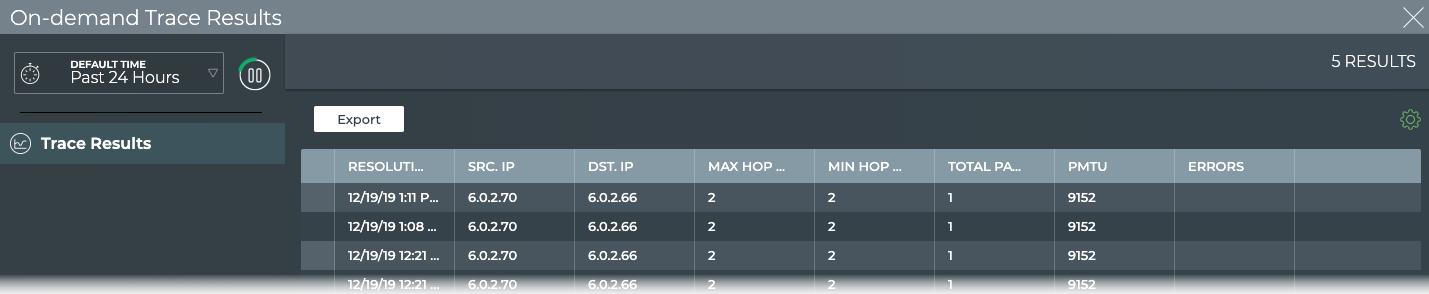
| Item | Description |
|---|---|
| Title | On-demand Trace Results |
| Closes full screen card and returns to workbench | |
| Time period | Range of time in which the displayed data was collected; applies to all card sizes; select an alternate time period by clicking |
| Results | Number of results found for the selected tab |
| Trace Results tab | Provides detailed path information, sorted by the Resolution Time (date and time results completed), including:
|
| Table Actions | Select, export, or filter the list. Refer to Table Settings |
Scheduled Trace Results Card
This card is used to view the results of scheduled trace requests.
The small Scheduled Trace Results card displays:
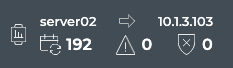
| Item | Description |
|---|---|
| Indicates a scheduled trace result. | |
| Source and destination of the trace, identified by their address or hostname. Source is listed on left with arrow pointing to destination. | |
| Results | Summary of trace results: a successful result implies all paths were successful without any warnings or failures; a failure result implies there was at least one path with warnings or errors.
|
The medium Scheduled Trace Results card displays:
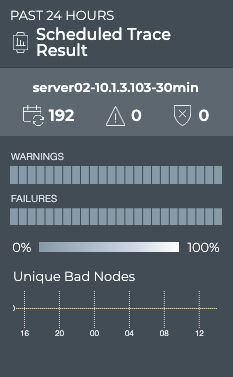
| Item | Description |
|---|---|
| Time period | Range of time in which the displayed data was collected; applies to all card sizes. |
| Indicates a scheduled trace result. | |
| Title | Scheduled Trace Result. |
| Summary | Name of scheduled validation and summary of trace results: a successful result implies all paths were successful without any warnings or failures; a failure result implies there was at least one path with warnings or errors.
|
| Charts | Heat map: A time segmented view of the results. For each time segment, the color represents the percentage of warning and failed results. Refer to Granularity of Data Shown Based on Time Period for details on how to interpret the results. Unique Bad Nodes: Distribution of unique nodes that generated the indicated warnings and/or failures. |
The large Scheduled Trace Results card contains two tabs:
The Results tab displays:
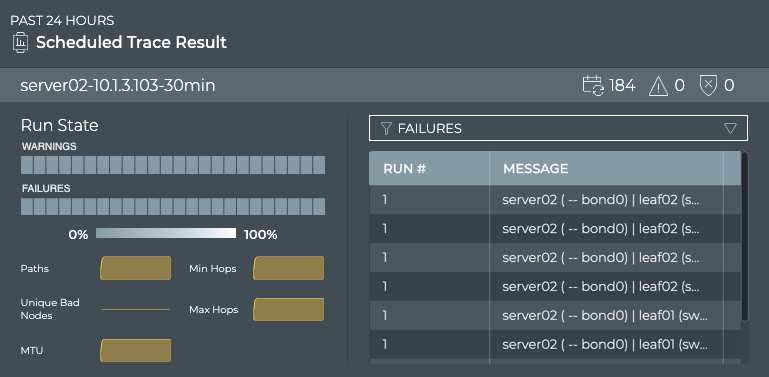
| Item | Description |
|---|---|
| Time period | Range of time in which the displayed data was collected; applies to all card sizes. |
| Indicates a scheduled trace result. | |
| Title | Scheduled Trace Result. |
| Summary | Name of scheduled validation and summary of trace results: a successful result implies all paths were successful without any warnings or failures; a failure result implies there was at least one path with warnings or errors.
|
| Charts | Heat map: A time segmented view of the results. For each time segment, the color represents the percentage of warning and failed results. Refer to Granularity of Data Shown Based on Time Period for details on how to interpret the results. Small charts: Display counts for each item during the same time period, for the purpose of correlating with the warnings and errors shown in the heat map. |
| Table/Filter options | When the Failures filter option is selected, the table displays the failure messages received for each run. When the Paths filter option is selected, the table displays all of the paths tried during each run. When the Warning filter option is selected, the table displays the warning messages received for each run. |
The Configuration tab displays:
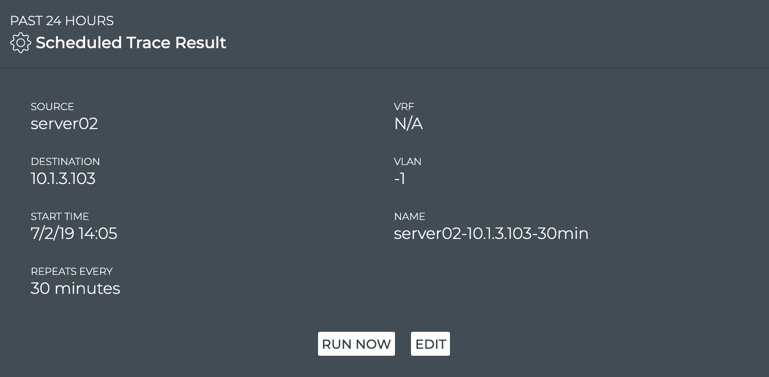
| Item | Description |
|---|---|
| Time period | Range of time in which the displayed data was collected; applies to all card sizes. |
| Indicates a scheduled trace configuration. | |
| Title | Scheduled Trace Configuration (Scheduled Trace Result). |
| Source | Address or hostname of the device where the trace was started. |
| Destination | Address of the device where the trace was stopped. |
| Schedule | The frequency and starting date and time to run the trace. |
| VRF | Virtual Route Forwarding interface, when defined. |
| VLAN | Virtual LAN identifier, when defined. |
| Name | User-defined name of the scheduled trace. |
| Run Now | Start the trace now. |
| Edit | Modify the trace. Opens Trace Request card with this information pre-populated. |
The full screen Scheduled Trace Results card displays:
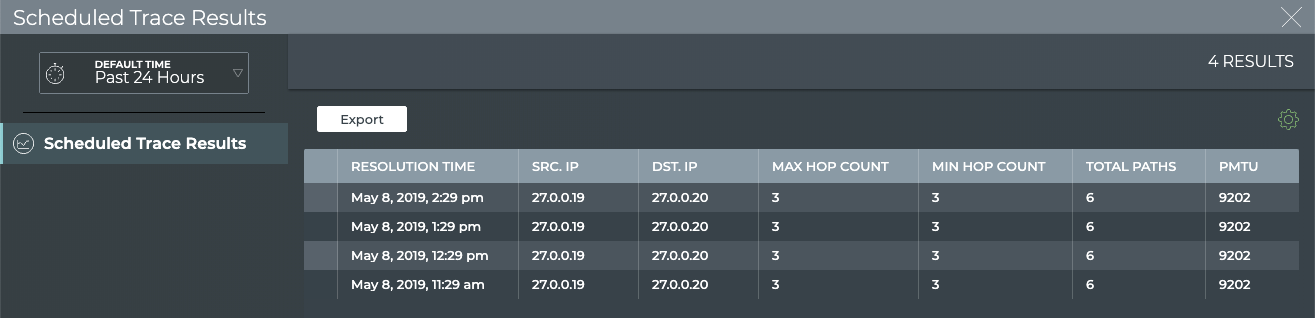
| Item | Description |
|---|---|
| Title | Scheduled Trace Results |
| Closes full screen card and returns to workbench. | |
| Time period | Range of time in which the displayed data was collected; applies to all card sizes; select an alternate time period by clicking |
| Results | Number of results found for the selected tab. |
| Scheduled Trace Results tab | Displays the basic information about the trace, including:
Click on a result to open a detailed view of the results. |
| Table Actions | Select, export, or filter the list. Refer to Table Settings. |
Validation Cards
There are three cards used to perform on-demand and scheduled validations—one for the creation of on-demand and scheduled validations and two for the results. Validation cards can be added to user-created workbenches.
Validation Request Card
This card is used to create a new on-demand or scheduled validation request or run a scheduled validation on demand.
The small Validation Request card displays:

| Item | Description |
|---|---|
| Indicates a validation request. | |
| Validation | Select a scheduled request to run that request on-demand. A default validation is provided for each supported network protocol and service, which runs a network-wide validation check. These validations run every 60 minutes, but you can run them on-demand at any time. Note: No new requests can be configured from this size card. |
| GO | Start the validation request. The corresponding On-demand Validation Result cards are opened on your workbench, one per protocol and service. |
The medium Validation Request card displays:
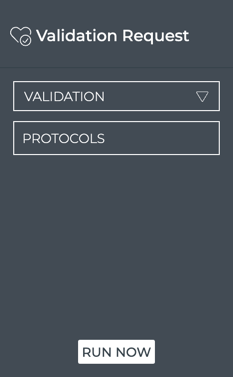
| Item | Description |
|---|---|
| Indicates a validation request. | |
| Title | Validation Request. |
| Validation | Select a scheduled request to run that request on-demand. A default validation is provided for each supported network protocol and service, which runs a network-wide validation check. These validations run every 60 minutes, but you can run them on-demand at any time. Note: No new requests can be configured from this size card. |
| Protocols | The protocols included in a selected validation request are listed here. |
The large Validation Request card displays:
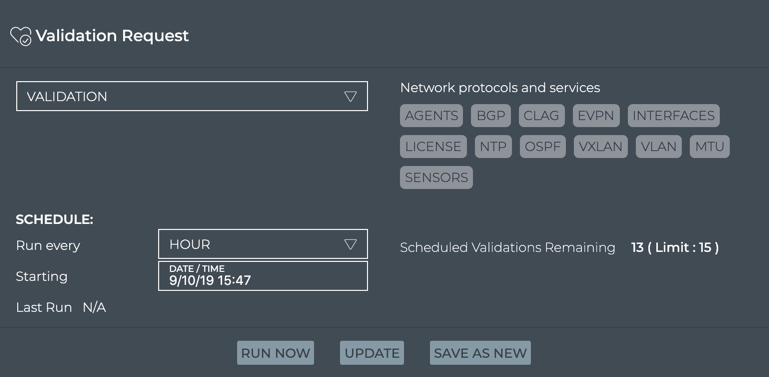
| Item | Description |
|---|---|
| Indicates a validation request. | |
| Title | Validation Request. |
| Validation | Depending on user intent, this field is used to:
|
| Protocols | For a selected scheduled validation, the protocols included in a validation request are listed here. For new on-demand or scheduled validations, click these to include them in the validation. |
| Schedule | For a selected scheduled validation, the schedule and the time of the last run are displayed. For new scheduled validations, select the frequency and starting date and time.
|
| Scheduled Validations | Count of scheduled validations that are currently scheduled compared to the maximum of 15 allowed. |
| Run Now | Start the validation request. |
| Update | When changes are made to a selected validation request, Update becomes available so that you can save your changes. Be aware, that if you update a previously saved validation request, the historical data collected will no longer match the data results of future runs of the request. If your intention is to leave this request unchanged and create a new request, click Save As New instead. |
| Save As New | When changes are made to a previously saved validation request, Save As New becomes available so that you can save the modified request as a new request. |
The full screen Validation Request card displays all scheduled validation requests.
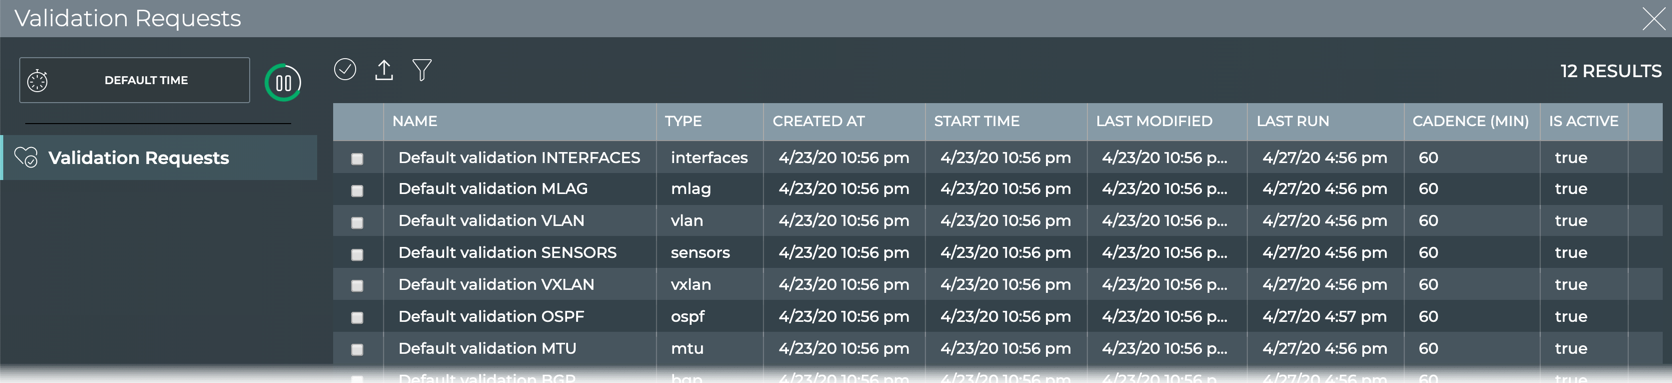
| Item | Description |
|---|---|
| Title | Validation Request. |
| Closes full screen card and returns to workbench. | |
| Default Time | No time period is displayed for this card as each validation request has its own time relationship. |
| Displays data refresh status. Click | |
| Results | Number of results found for the selected tab. |
| Validation Requests | Displays all scheduled validation requests. By default, the requests list is sorted by the date and time that it was originally created (Created At). This tab provides the following additional data about each request:
|
| Table Actions | Select, export, or filter the list. Refer to Table Settings. |
On-Demand Validation Result Card
This card is used to view the results of on-demand validation requests.
The small Validation Result card displays:
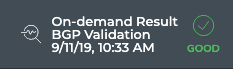
| Item | Description |
|---|---|
| Indicates an on-demand validation result. | |
| Title | On-demand Result <Network Protocol or Service Name> Validation. |
| Timestamp | Date and time the validation was completed. |
Status of the validation job, where:
|
The medium Validation Result card displays:
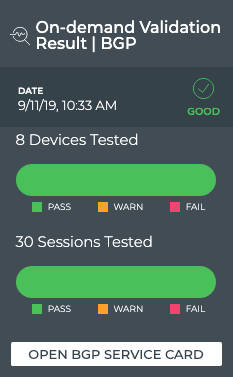
| Item | Description |
|---|---|
| Indicates an on-demand validation result. | |
| Title | On-demand Validation Result | <Network Protocol or Service Name>. |
| Timestamp | Date and time the validation was completed. |
Status of the validation job, where:
| |
| Devices Tested | Chart with the total number of devices included in the validation and the distribution of the results.
Hover over chart to view the number of devices and the percentage of all tested devices for each result category. |
| Sessions Tested | For BGP, chart with total number of BGP sessions included in the validation and the distribution of the overall results. For EVPN, chart with total number of BGP sessions included in the validation and the distribution of the overall results. For Interfaces, chart with total number of ports included in the validation and the distribution of the overall results. In each of these charts:
Hover over chart to view the number of devices, sessions, or ports and the percentage of all tested devices, sessions, or ports for each result category. This chart does not apply to other Network Protocols and Services, and thus is not displayed for those cards. |
| Open <Service> Card | Click to open the corresponding medium Network Services card, where available. |
The large Validation Result card contains two tabs.
The Summary tab displays:
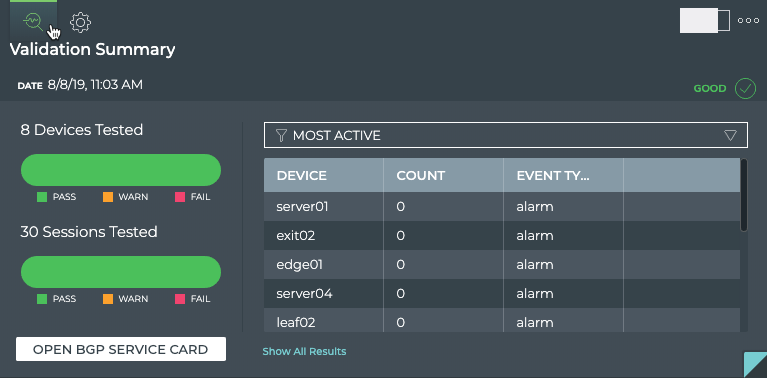
| Item | Description |
|---|---|
| Indicates an on-demand validation result. | |
| Title | On-demand Validation Result | Summary | <Network Protocol or Service Name>. |
| Date | Day and time when the validation completed. |
Status of the validation job, where:
| |
| Devices Tested | Chart with the total number of devices included in the validation and the distribution of the results.
Hover over chart to view the number of devices and the percentage of all tested devices for each result category. |
| Sessions Tested | For BGP, chart with total number of BGP sessions included in the validation and the distribution of the overall results. For EVPN, chart with total number of BGP sessions included in the validation and the distribution of the overall results. For Interfaces, chart with total number of ports included in the validation and the distribution of the overall results. For OSPF, chart with total number of OSPF sessions included in the validation and the distribution of the overall results. In each of these charts:
Hover over chart to view the number of devices, sessions, or ports and the percentage of all tested devices, sessions, or ports for each result category. This chart does not apply to other Network Protocols and Services, and thus is not displayed for those cards. |
| Open <Service> Card | Click to open the corresponding medium Network Services card, when available. |
| Table/Filter options | When the Most Active filter option is selected, the table displays switches and hosts running the given service or protocol in decreasing order of alarm counts. Devices with the largest number of warnings and failures are listed first. You can click on the device name to open its switch card on your workbench. When the Most Recent filter option is selected, the table displays switches and hosts running the given service or protocol sorted by timestamp, with the device with the most recent warning or failure listed first. The table provides the following additional information:
|
| Show All Results | Click to open the full screen card with all on-demand validation results sorted by timestamp. |
The Configuration tab displays:
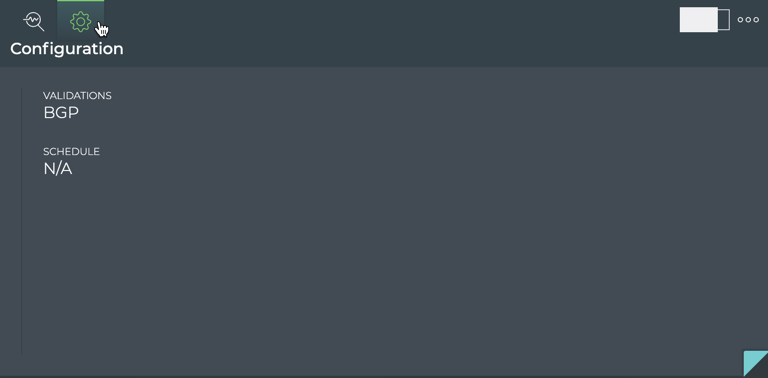
| Item | Description |
|---|---|
| Indicates an on-demand validation request configuration. | |
| Title | On-demand Validation Result | Configuration | <Network Protocol or Service Name>. |
| Validations | List of network protocols or services included in the request that produced these results. |
| Schedule | Not relevant to on-demand validation results. Value is always N/A. |
The full screen Validation Result card provides a tab for all on-demand validation results.
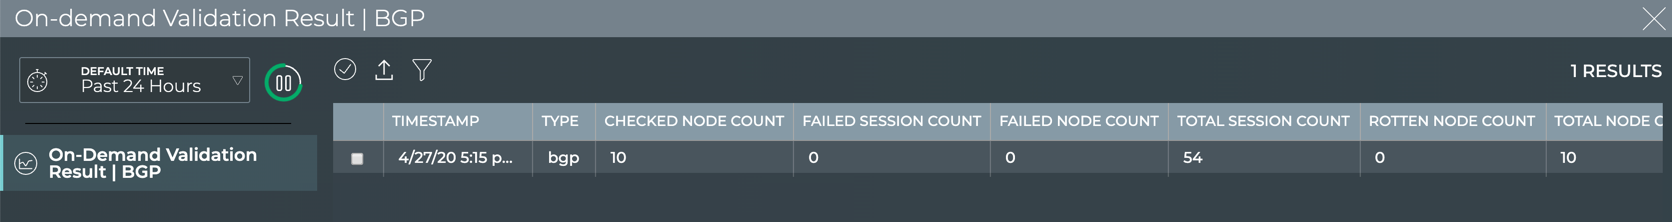
| Item | Description |
|---|---|
| Title | Validation Results | On-demand. |
| Closes full screen card and returns to workbench. | |
| Time period | Range of time in which the displayed data was collected; applies to all card sizes; select an alternate time period by clicking |
| Displays data refresh status. Click | |
| Results | Number of results found for the selected tab. |
| On-demand Validation Result | <network protocol or service> | Displays all unscheduled validation results. By default, the results list is sorted by Timestamp. This tab provides the following additional data about each result:
|
| Table Actions | Select, export, or filter the list. Refer to Table Settings. |
Scheduled Validation Result Card
This card is used to view the results of scheduled validation requests.
The small Scheduled Validation Result card displays:

| Item | Description |
|---|---|
| Indicates a scheduled validation result. | |
| Title | Scheduled Result <Network Protocol or Service Name> Validation. |
| Results | Summary of validation results:
|
Status of the validation job, where:
|
The medium Scheduled Validation Result card displays:
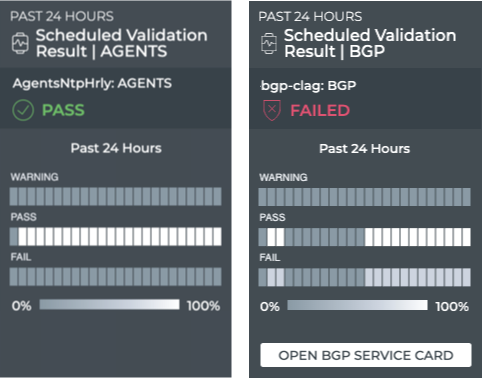
| Item | Description |
|---|---|
| Time period | Range of time in which the displayed data was collected; applies to all card sizes. |
| Indicates a scheduled validation result. | |
| Title | Scheduled Validation Result | <Network Protocol or Service Name>. |
| Summary | Summary of validation results:
|
| Chart | Validation results, where:
|
| Open <Service> Card | Click to open the corresponding medium Network Services card, when available. |
The large Scheduled Validation Result card contains two tabs.
The Summary tab displays:
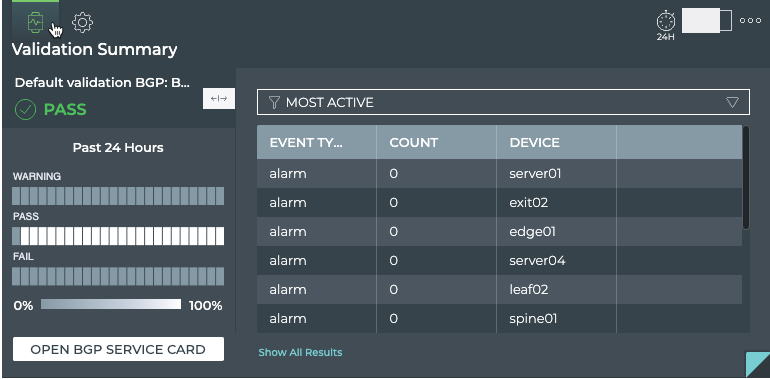
| Item | Description |
|---|---|
| Indicates a scheduled validation result. | |
| Title | Validation Summary (Scheduled Validation Result | <Network Protocol or Service Name>). |
| Summary | Summary of validation results:
|
| Chart | Validation results, where:
|
| Open <Service> Card | Click to open the corresponding medium Network Services card, when available. |
| Table/Filter options | When the Most Active filter option is selected, the table displays switches and hosts running the given service or protocol in decreasing order of alarm counts-devices with the largest number of warnings and failures are listed first. When the Most Recent filter option is selected, the table displays switches and hosts running the given service or protocol sorted by timestamp, with the device with the most recent warning or failure listed first. The table provides the following additional information:
|
| Show All Results | Click to open the full screen card with all scheduled validation results sorted by timestamp. |
The Configuration tab displays:
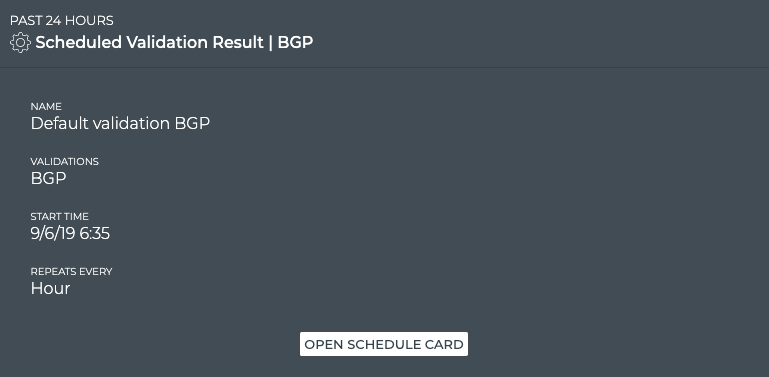
| Item | Description |
|---|---|
| Indicates a scheduled validation configuration | |
| Title | Configuration (Scheduled Validation Result | <Network Protocol or Service Name>) |
| Name | User-defined name for this scheduled validation |
| Validations | List of validations included in the validation request that created this result |
| Schedule | User-defined schedule for the validation request that created this result |
| Open Schedule Card | Opens the large Validation Request card for editing this configuration |
The full screen Scheduled Validation Result card provides tabs for all scheduled validation results for the service.
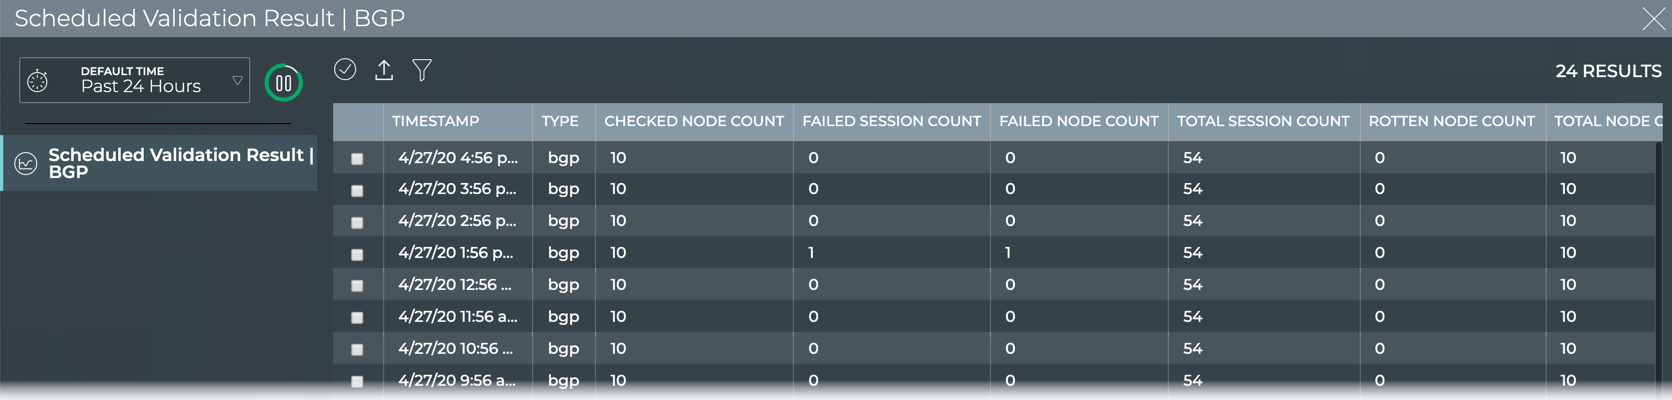
| Item | Description |
|---|---|
| Title | Scheduled Validation Results | <Network Protocol or Service>. |
| Closes full screen card and returns to workbench. | |
| Time period | Range of time in which the displayed data was collected; applies to all card sizes; select an alternate time period by clicking |
| Displays data refresh status. Click | |
| Results | Number of results found for the selected tab. |
| Scheduled Validation Result | <network protocol or service> | Displays all unscheduled validation results. By default, the results list is sorted by timestamp. This tab provides the following additional data about each result:
|
| Table Actions | Select, export, or filter the list. Refer to Table Settings. |